Simulation computer model for virtual research of optoelectronic measuring systems

Author: Gritskevich Y. V., Zviagintcheva P. A., Makarova D. G., Egorenko M. P., Zolotarev V. V.
Journal: Siberian Aerospace Journal @vestnik-sibsau-en
Section: Informatics, computer technology and management
Article in issue: 4 vol.20, 2019.
Free access
The paper considers a simulation computer model of an optoelectronic system for measuring the point objects coordinates. The model allows optimal coordination of the system links parameters in order to minimize the measurement error. The method of multiple statistical tests which allows accumulating the results of single computational experiments for each specific measurement event with a unique random distribution of links parameters and characteristics, and then carrying out statistical processing of the accumulated results is the main method of computer simulation. As a result of multiple analyses, multi-parameter functional dependencies that provide optimal coordination of parameters controlled by the designer or operator according to the criterion of the resulting measurement error minimizing are realized. The article presents the results of evaluating modeling parameters that reduce the measurement error. It is relevant to apply this method when using the same measuring system in different operating conditions, for different measured objects and when performing various functional tasks since it allows adapting the system for a specific application. The model presented in the article can be concretized for the purpose of evaluating and multi-parameter optimization of particular object parameters, as well as for developing a virtual measuring stand on the basis of the model and its modifications.
Coordinate measurement, point object, computer simulation, measurement error, optimal parameter matching.
Short address: https://sciup.org/148321701
IDR: 148321701 | UDC: 681.7:004 | DOI: 10.31772/2587-6066-2019-20-4-416-422
Text of the scientific article Simulation computer model for virtual research of optoelectronic measuring systems
Introduction. The problem of remote determination of the spatial position of various stationary and dynamic objects is effectively solved using optoelectronic measuring systems. Currently, a photo detector array (PDA) [1] is the main detecting element, in the plane of which the image of the measured object is built. PDA-based coordinators are used in astronomical and geodetic measurements, in guidance and aiming devices [2; 3], as well as in personal identification systems using biometric parameters [4]. In the latter case we mean registering the coordinates of some cardinal points, the ratio of the distances between which is one of the components of the identification vector.
It is advisable to take the image of a point object as the basic measured element. It is the measurement error of this element coordinates that determines the functional quality of the device. Obviously, in the case of an ideal optical system the image of a point will be a point. Then the measurement error is determined by the geometric dimensions of an individual sensitive array element (pixel) [5]. Error reduction is possible due to the fact that a real lens creates an image of a point in the form of a scattering spot.
When such a spot is formed, the image energy is no longer concentrated on one sensitive element of the array, but is distributed over the surfaces of several detectors, which creates a charge relief in the region of accumulation of PDA signal charges. Having obtained the exact numerical values of the signals for adjacent elements onto which the scattering spot is projected and having processed these values using an interpolation algorithm that takes into account the imbalance in the distribution of signals among elementary detectors, we can calculate the coordinates of the spot center in the PDA vertical and horizontal relative to a given coordinate center in the PDA plane.
If the scattering spot is round, which is typical for its location in the eyesight central (paraxial) zone, then there is no need to carry out interpolation processing for all array elements that fall into the optical signal energy zone. It is enough to determine the extreme pixel with the maximum signal and construct the interpolating functions only by the vertical and horizontal sets of detectors symmetric with respect to the extreme element (column and row, respectively).
If a PDA is an ideal one, that is, there are no noises and dark currents in it, then the calculating errors in the horizontal or vertical coordinates will decrease with increasing the number of sample elements to a certain value that ensures representativeness of the result. Further increase in the number of processed pixels will no longer affect the error. The error itself in this case will be determined by the computational error of the computer.
A real PDA is characterized by the presence of both dark currents and noise. This leads to deformation of the ideal charge relief and to increasing the error of coordinate measurement [6]. Moreover, increasing the number of processed pixels can increase the measurement error, since the processing will include elements in which signal charges are already absent, and noise components continue to participate in the calculation process. Other factors, such as the instability of the initial optical signal, atmospheric turbulence, vibrations, etc., also affect the resulting error. We can say that the measurement error is determined by signal fluctuations distributed over the optoelectronic path and having different physical origin [7].
Problem statement. At present, decrease in the measurement error is achieved mainly due to the improvement of the qualitative indicators of the devices hardware and the improvement of the algorithms for PDA output signals [8] processing. Computer simulation is used, as a rule, for the preliminary development of various design decisions at the stage of scientific research [9].
The presence of a computer model that allows optimal matching of coordinator links according to the criterion of minimizing the measurement error is an urgent problem, the solution of which will ensure the adaptation of a designed or operated measuring device to actual conditions of its use in order to increase the accuracy of measurements.
As it has already been noted above, fluctuation (noise) processes distributed along the optoelectronic path are the main factors for increasing measurement errors. The presence of random components in a useful signal requires the implementation of a basic modeling algorithm in the format of multiple statistical tests. In this case, the device links parameters and characteristics are initially set in the form of nominal values having the essence of the mathematical expectation for each component involved in the computing process. Also a probabilistic law that describes the behavior of a random variable and the parameters of a random process necessary for modeling, for example, mean standard deviation (MSD) are determined for these components.
In a single computer experiment a random point (its coordinates) is generated in the PDA plane. Then a corresponding spatial function with a vertex whose coordinates correspond to the generated point coordinates is constructed in the scattering spot in accordance with the energy distribution law. The distribution of array signal charges which are then converted taking into account the probabilistic nature of physical processes into a random discrete function of the signals accumulated by the PDA pixels is calculated using the convolution operation between the array raster and the energy distribution function. Using this discrete function the approximate value of the scattering spot center is calculated by interpolation. The difference between the positions of the true random point and the calculated spot center is stored as a single random error.
Conducting a series of repeated statistical tests for each new random position of the generated point and the unique distribution of random array parameters allows finally obtaining the MSD for the entire set of statistical experiments. Each new series of statistical experiments involves a purposeful deterministic change in one of the coordinator controlled parameters in a real range of acceptable values. Thus, the function of the dependence of the error in measuring the coordinates δ i on the variable parameter p i , that is, δ i = f (p i ), is realized. The minimum value of this objective function will be the optimal parameter value providing the smallest measurement error, other conditions being equal.
Obviously, carrying out such an analysis in a multiparameter space will allow getting an optimally consistent set of controllable parameters that meets the criterion of minimizing the measurement error. It should be noted that the solution of this problem does not imply the development of new instruments or methods for measuring coordinates, nor does it touch upon the improvement of algorithms for determining the position of the vertex of the energy distribution function in the scattering spot. The main purpose of the research is to develop computer-oriented tools and methods for optimal coordination of the parameters and characteristics of the optoelectronic path links of the measuring device controlled by the designer or operator, which would ensure minimization of the measurement error in the presence of an already set (designed or physically implemented) coordinator. That is, we are mean creating a virtual test stand for the optimal choice of parameters and operating modes of a real device planned for practical use, taking into account the real conditions of its operation in accordance with a given functional purpose.
As it has already been noted above, the scattering spot formed in the paraxial region is round. The invariance of such a spot relative to the selected coordinate system allows setting the function of the illumination distribution in the spot E ( x , y ) for only one coordinate. Let such a coordinate be x . The function itself is assumed to be Gaussian:
( x - x 0 )2
E ( x ) = Φ 0 2 ⋅ e 2 ⋅π⋅ r 2 , (1) 2 ⋅π⋅ r 2
where Φ 0 is the incident radiation power; x 0 is the real random coordinate of the point generated in the PDA plane; r is the scattering spot radius at the level of 0.606 from the maximum illumination level.
In the case of a single generation of fluctuations, only PDA noises are taken into account, which are specified in fractions of the useful signal for the multiplicative noise component, and, similarly, in fractions of the dark signal for the additive noise component.
The convolution of the array raster and the illumination distribution function in the point image leads to the conversion of the continuous input optical signal E ( x ) into a stepwise discrete function S ( i ), where S is the electrical signal and i is the number of the array raster element in a row. Each element of the vector S ( i ) contains a signal determined for a specific random implementation of the point, determined by the integrated illumination of the raster i -th element, and a noise random component generated inside the i -th element in accordance with a given MSD. The simplest interpolation algorithm for calculating the energy center, which is a modification of the method of determining the mass center of a system of material points known from the course of theoretical mechanics, was used to determine the coordinate of the center x c of the scattering spot:
Σ im = 1 S ( i ) ⋅ x c ( i )
Σ im = 1 S ( i )
where S ( i ) is the signal in the i -th element of the row; x c ( i ) is the coordinate of the i -th element center; m is the number of sample elements involved in the processing.
The calculation of the final error is carried out on the basis of all random implementations for a particular series of multiple statistical tests.
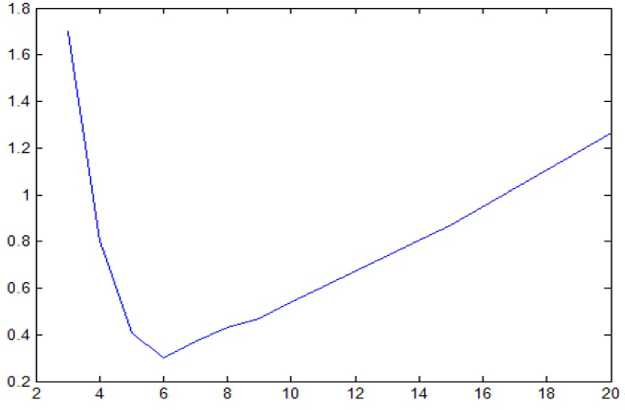
Discussion of simulation results . It is obvious that if the size of the scattering spot is smaller than the pixel size, then the measurement error of the spot center coordinate will be determined by the size of the pixel. Increase in the scattering spot diameter will reduce the error due to the inclusion of adjacent pixels in the processing. Too much "expansion" of the spot will reduce the energy level of the optical signal due to the distribution of energy over a larger area. Therefore, there must be some optimal spot radius which will provide the minimum measurement error. This hypothesis was tested in [10; 11]. A virtual experiment in which the scattering spot radius varied with a certain step from the value of the pixel size to a size of several hundred pixels was conducted for given raster parameters and values of noise components. Multiple statistical tests were carried out, and the current error was calculated for each new value of the radius. Fig. 1 shows the resulting optimization graph, from which it can be seen that there really is a radius of the scattering spot which minimizes the measurement error.
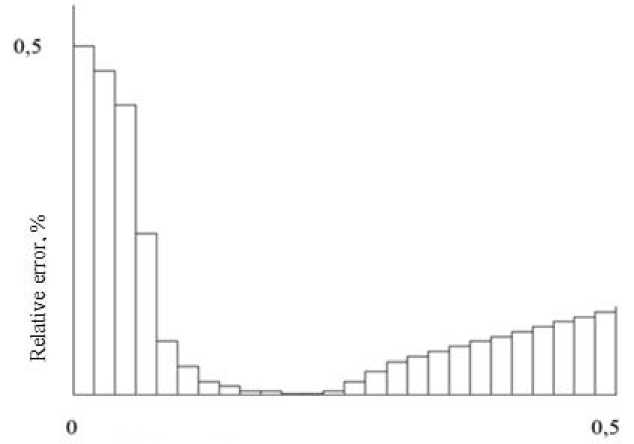
The optimal number of sample elements was also determined, which minimizes the error [12]. The number of pixels involved in the interpolation process discretely increased from 1 (the pixel with the maximum signal) to n (the total number of pixels in the row). Pixel increment was performed symmetrically on both sides of the extreme pixel. Each step was accompanied by the calculation of the error by the method of multiple statistical tests. With a small number of sample elements the error was large. Then as the number of pixels involved in the processing increases the error decreases. But with a certain value of the processed pixels, it again began to increase. This is due to the fact that at the periphery of the spot the useful signal became smaller than noise signals which began to make a significant contribution to the final error. The more “noise” pixels that did not contain signal com- ponents were added to the processing the larger was this contribution. Fig. 2 is a stepwise graph illustrating the results of the described computational experiment.
The horizontal of this graph shows the number of sample pixels normalized relative to the total number of pixels in the row, and the vertical shows the measurement error.
The graphs shown in fig. 1, 2 are illustrative (demonstrative), and the parameters of the arrays in computational experiments are selected in such a way as to increase the visibility of the presented results. In this regard there is no need to give the parameters of the optoelectronic paths of the measuring systems for which these graphs were obtained.
Scattering spot radius, micron
Fig. 1. Dependence of the optimal coordinate measurement error on the scattering spot radius
Рис. 1. Зависимость оптимальной погрешности измерения координаты от радиуса пятна рассеяния
Normalized number of sample elements
Fig. 2. Dependence of the relative error of coordinate measurement on the number of sample elements
Рис. 2. Зависимость относительной погрешности измерения координаты от количества элементов выборки
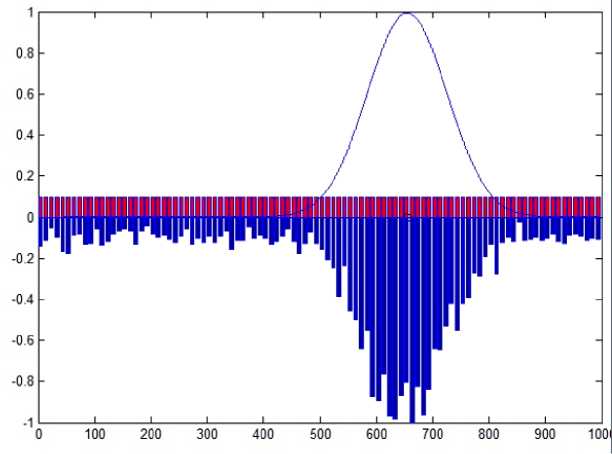
Fig. 3. Distribution of charge packets over the pixels of the matrix row at a small radius of the scattering spot
Рис. 3. Распределение зарядовых пакетов по пикселям строки матрицы при малом радиусе пятна рассеяния
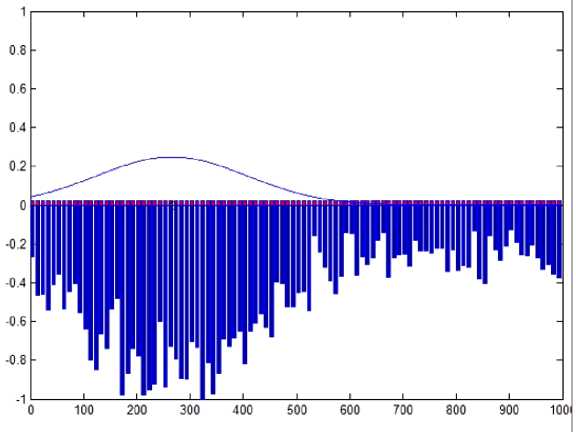
Fig. 4. Distribution of charge packets over the pixels of the matrix row at a large radius of the scattering spot
Рис. 4. Распределение зарядовых пакетов по пикселям строки матрицы при большом радиусе пятна рассеяния
The appearance of the screen interfaces on which the results of single statistical tests are presented is of interest. They are shown in fig. 3, 4.
Gaussian function of illumination distribution in the scattering spot is displayed at the top of both figures. The lower part corresponds to the discrete distribution of charges (signal and noise) accumulated under the influence of optical radiation. It is obvious that in fig. 3 the charge relief has a sharper character due to the smaller size of the scattering spot. The increase in the spot radius in fig. 4 leads to “blurring” of the charge relief. In both cases the amount of spot energy remains constant, but the radius increase in Fig. 4 reduces the proportion of energy per 1 pixel. Therefore, the charge relief shown in Fig. 4 undergoes noticeable deformations, which of course leads to a significant increase in the measurement error of the scattering spot center.
For example, when analyzing a dynamic object [13] a sequential series of measurements of its current position coordinates at equal time intervals determined by the sig- nal accumulation period is made in order to determine both the trajectory of its movement and the parameters characterizing the movement of the object (speed, acceleration). It is obvious that decrease in the accumulation time would lead to more accurate measurements, but then the signal charge would not have time to accumulate to the value necessary for accurate fixation of the calculated coordinate. At the same time the increase in the accumulation time will lead to blurring of the image [14; 15]. There appears the problem of determining such an optimal accumulation time that would ensure the smallest measurement error of the current coordinate. A similar problem could also be solved using the proposed model.
Conclusion. The described model is of a generalized character and demonstrates only some of the possibilities provided by it in terms of the optimal coordination of individual parameters and operating modes of optoelectronic measuring systems. The development of the model takes place, firstly, along the path of concretization as applied to real designed or operated devices, and secondly, towards the development of multi-parameter optimization of coordinators by combining the parameters and characteristics of various parts of the system into one modeling process.
All this creates the prerequisites for creating a virtual stand which provides the development and configuration of measuring systems that most effectively fulfill the tasks planned for them.
References Simulation computer model for virtual research of optoelectronic measuring systems
- Malinin V. V. Modelirovanie i optimizatsiya optikoelektronnykh priborov s fotopriemnymi matritsami [Modeling and optimization of optoelectronic devices with photodetector arrays]. Novosibirsk, Nauka Publ., 2005, 256 p.
- Zheltko Ch. N., Pastukhov M. A., Gura D. A., Shevchenko G. G. [Evaluation of the error in measuring horizontal angles during the geodetic support of high-rise construction]. Regional'nye aspekty razvitiya nauki i obrazovaniya v oblasti arkhitektury, stroitel'stva, zemleustroystva i kadastrov v nachale III tysyacheletiya. Nauchnye chteniya pamyati professora V. B. Fedosenko [Regional aspects of the development of science and education in the field of architecture, construction, land management and cadastre at the beginning of the III Millennium. Scientific readings in memory of Professor V. B. Fedosenko]. Komsomol'sk-na-Amure, Komsomol'skiyna- Amure gosudarstvennyy tekhnicheskiy universitet Publ., 2015, P. 389–394 (In Russ.).
- Belokonev V. M., Itigin A. M.-Sh., Shlishevskiy V. B. [Theoretical errors in determining the polar coordinates of luminous objects using a two-channel optoelectronic system with matrix photodetectors]. Opticheskiy zhurnal. 2003, No. 7, P. 91–92 (In Russ.).
- Jain A. K., Flynn P., Ross A. A. Handbook of biometrics. Springer. 2008, 565 p.
- Bukreev V. I., Dmitrieva M. N., Ivankin I. R., Eventave Yu. M. [Estimation of the position and velocity of the image center of the light spot by the charge distribution in the matrix CCD-structure]. Tekhnika sredstv svyazi. Cer. Tekhnika televideniya. 1990, No. 2, P. 71–77 (In Russ.).
- Gusarov V. F. [Influence of characteristics of matrix photodetectors on the accuracy of optoelectronic system with optical equal-signal zone]. Sb. trudov V Vserossiyskogo kongressa molodykh uchenykh [All-Russian Congress of young scientists]. 2016, Vol. 1, P. 124–128 (In Russ.).
- Belokonev V. M., Itigin A. M.-Sh., Prudnikov N. V., Shlishevskiy V. B. [The concept of building an optoelectronic system for automatic determination of target coordinates by a light flash]. Izv. vuzov. Priborostroenie. 2003, No. 3, P. 64–66 (In Russ.).
- Kuchkov D. V., Konyakhin I. A., Usik A. A. [Iterative algorithm for determining the coordinates of point emitters images]. Opticheskiy zhurnal. 2009, Vol. 76, No. 1, P. 43–45 (In Russ.).
- Fisenko M. G., Ezhova K. V., Molev F. V. [Simulation of the image registered by multi-element optical receivers]. Izv. vuzov. Priborostroenie. 2012, Vol. 55, No. 4, P. 73–74 (In Russ.).
- Gritskevich E. V. [Minimization of the measurement error of opto-electronic coordinate sensor]. Datchiki i sistemy. 2012, No. 4, P. 18–20 (In Russ.).
- Gritskevich E. V., Zvyagintseva P. A. ISCOL [ISCOL]. Patent RF, No. 2011610964, 2011.
- Gritskevich E., Zvyagintseva P., Sidorov L. Virtual Testing of Electro-optical Systems for Measuring Angles by Using Computer Simulation Model. Proceedings of the 18th International Conference of Young Specialists on Micro / Nanotechnologies and Electron Devices EDM 2017. Erlagol, Altai Republic 29 June – 3 July, 2017. Р. 353–356. doi:10.1109/EDM.2017.7981772.
- Bezuglov D. A., Yukhnov V. I., Reshetnikova I. V., Belichenko M. A. [Methods for determining the motion parameters of a point source of optical radiation]. Sovremennye problemy nauki i obrazovaniya. 2014, No. 2 (In Russ.). Available at: https://science-education.ru/ru/article/view?id=12712 (accessed 11.02.2019).
- Pashkov V. S. [The effect of blurring images on the accuracy of estimates of its coordinates]. Mekhanika, upravlenie i informatika. 2009, No. 1, P. 225–230 (In Russ.).
- Bogoslovskiy A. V., Zhigulina I. V., Bogoslovskiy E. A. et al. [Algorithm of compensation of linear shift of the image of the moving object]. DSPA: Voprosy primeneniya tsifrovoy obrabotki signalov. 2016, Vol. 6, No. 4, P. 768–772.
