Simulation of the mode of electron-beam welding of a thin-wall structure from AD31 alloy

Author: Kurashkin S.O., Seregin Yu.N., Tynchenko V.S., Murygin A.V., Kotelnikova S.V.
Journal: Siberian Aerospace Journal @vestnik-sibsau-en
Section: Aviation and spacecraft engineering
Article in issue: 2 vol.23, 2022.
Free access
The article contains the results obtained by the authors in the study of the possibility of using electron beam welding (EBW) for thin-walled structures made of AD31 aluminum alloy. Today, EBW of similar de-signs are not used due to the lack of technology. Currently, other technologies for connecting similar struc-tures are used in production, but they have a high cost, the reason for which is due to the high percentage of defects. The method of using EBW proposed by the authors will significantly improve the quality of the joint in thin-walled structures and the reproducibility of the technological mode of welding products. The authors have developed a technological solution to the presented problem, based on many years of experi-ence in the use of models of thermal processes, accompanied by electron beam welding. As a subject of research, modeling of the parameters of electron-beam welding of thin-walled pipes for waveguide paths made of aluminum alloy AD31 is proposed. The article presents the results of mathematical modeling of technological parameters during heating of an aluminum alloy by energy sources equivalent to an electron beam during EBW. The analysis and evaluation of the simulation results was carried out using the optimal-ity criterion developed by the authors. The calculations performed by the authors are based on functional using mathematical models of metal heating by a complex heat source consisting of moving instantaneous point and linear energy sources. The article presents the results of calculations for a plate with a thickness of 0.12 cm, which corresponds to prototypes used in the manufacture of waveguide paths. As a result, by changing such values as: beam current and welding speed, the temperature distribution on the surface of the product during the EBW process was obtained, which showed the applicability of modeling for develop-ing a new technological process.
Electron-beam welding, modelling, technological parameters, software, optimisation, nor-mal distribution law
Short address: https://sciup.org/148329627
IDR: 148329627 | UDC: 621.791.722 | DOI: 10.31772/2712-8970-2022-23-2-296-304
Text of the scientific article Simulation of the mode of electron-beam welding of a thin-wall structure from AD31 alloy
Currently, a variety of technologies are used in the production of waveguide tract structures, carrying large costs due to the low reproducibility of the quality of structural joints [1–3]. The small thickness and low melting temperature of the joined products cast doubt on the feasibility of electron-beam welding in this direction [4–6]. In works [7–9] the authors simulated the electron beam welding (EBW) process for titanium alloy in order to find the optimal mode. The resulting modeling experience led the authors to the idea of investigating the possibility of applying electron-beam welding to thin-walled aluminum structures. Thus, the goal was to simulate the welding process of the investigated material with a given thickness and to compare the simulation results with the capabilities of electron-beam equipment.
The studies were based on the classical theory of thermal processes [10; 11]. The temperature distribution in a thin-layer material under the action of a moving point source on its surface can be calculated using the superposition method (source addition) [12–15]. The actual point source shown in Fig. 1 is assumed to be moving on the surface of a semi-infinite body.
The reflection of the heat flux given by the source Q1 from the boundary II is taken into account by introducing the source Q4, symmetrical to the source Q1 with respect to the boundary II, i.e. at distance 2δ from the source Q1, acting at the boundary I. In turn, the boundary I for source Q4 will be taken into account, if we introduce a fictitious source Q3, remote from the boundary I at distance 2δ. To account for the material thickness δ, a linear moving source Q2 was introduced in the simulation of the thermal process.
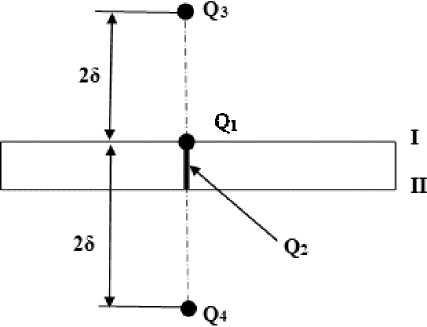
Рис. 1. Схема введения фиктивных источников для расчета температур в плоском слое
Fig. 1. Scheme of introducing fictitious sources for calculating temperatures in a flat layer
Mathematical apparatus
Adopting the selected set of heating sources and applying the superposition method [10], we obtain the final heating temperature model (1):
T^= T + T2 + T3 + T4, where T = TH +--Q==
vx t e 2ajexp
2 2.2
v т x + y
---
4 a
4 a т
dτ is the temperature of heating from an τ3/2
instantaneous point source moving on the surface;
Q 2
‘ 2 = T H + 4nM
vx t e 2ajexp
moving linear source;
Q 3
T 3 = T H + 1----
—
v 2 τ 4 a
2^т ( x 2 + У 2 ) ^ d т . ,
---— is the temperature from the heating of a
- - -
cρδ 4 a τ
τ
vx t e 2ajexp
-
v 2τ 4 a
-
x 2 + y 2 + ( z - 28 ) 2 ^ d т
4 a τ
3/2 τ
is the temperature
of
heating
from a fictitious instantaneous point source moving over the surface;
T 4 = T h + 7 Q 4 3
vx t e 2ajexp
—
v 2 τ 4 a
—
x 2 + y 2 + ( z + 28 ) 2 d т
4 a τ
τ3/2
is the temperature
of
heating
from a fictitious instantaneous point source moving over the surface.
When modeling the thermal process, the authors use a functional developed by them:
J =
A Ё ( T . i — T . J ' , n -1 ft.
T where THi = — ; Tax = max A . Tmax
The choice of parameters in the simulation was carried out according to the minimum of the functional. For example, the speed of movement of the heating source was determined by the coordinate of the position of the extreme point of the functional, as shown in Fig. 2.
Heating temperature calculations (2) were performed at integration time values corresponding to the moment of reaching the boundary of the heat-affected zone of the lower surface of the heated material, an example is shown in Fig. 3.
The maximum temperature value, which corresponds to the reference [11] properties of the studied material ( c , ρ, a , λ), is taken as the boundary of the heat-affected zone.
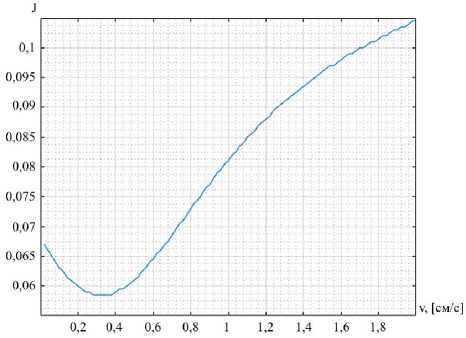
Рис. 2. График изменения функционала от скорости перемещения источника нагрева
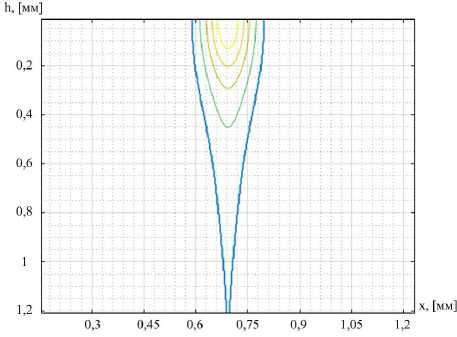
Рис. 3. Моделирование поперечного сечения зоны термического влияния:
h – толщина сварного шва; x – ширина изделия
Fig. 2. Graph of the change in the functional from the speed of movement of the heating source
Fig. 3. Modeling a Cross-Section of a Heat-Affected Zone: h – the thickness of the weld; x – product width
The criterion of optimality is the minimum of the functional under variation of the parameter for which the search for a solution is carried out. The proposed criterion is attractive because its character has a physical semantic orientation, along with this criterion has extremes at characteristic values of the varied parameters. Functional was calculated for a volume bounded by a heat-affected zone, shown in Fig. 3. Normalized numerical values of the functional were used to simulate the process.
From the physical point of view, the assumption was made that the minimum of the proposed function is proportional to the minimum temperature dispersion of heating the metal. If we take into account the volume limitations adopted by the authors of this function, then we can assume the following: in the case of uniform heating of the material, that is, the minimum temperature dispersion in the volume under consideration, the probability of uniform melting of the metal will be the highest. This will entail the formation of the weld with the best quality indicators and minimal residual stresses. The introduction of normalized indicators increases the sensitivity of the criterion, which is especially important for temperatures not exceeding the temperature of phase transitions of the materials being welded.
Results
Based on the results of studies of the behavior of the functional for different energies of the heating source, the authors formed an algorithm for calculating the parameters of the technological process, recommended in the future for the development of electron-beam welding technology.
For clarity of the information obtained in modeling, the results of calculations are summarized in the table.
Results of model calculation (2)
|
1 |
2 |
3 |
4 |
|
Q, [cal] |
J |
v , [cm/s] |
t , [s] |
|
3 |
0,0979 |
0,21 |
1,107 |
|
4 |
0,0958 |
0,27 |
0,869 |
|
5 |
0,0939 |
0,32 |
0,721 |
|
6 |
0,0922 |
0,36 |
0,619 |
|
7 |
0,0907 |
0,40 |
0,545 |
|
8 |
0,0892 |
0,44 |
0,489 |
|
9 |
0,0874 |
0,49 |
0,446 |
|
10 |
0,0865 |
0,52 |
0,409 |
|
11 |
0,0857 |
0,56 |
0,379 |
|
12 |
0,0837 |
0,60 |
0,355 |
|
13 |
0,0835 |
0,64 |
0,333 |
|
14 |
0,0815 |
0,67 |
0,314 |
|
15 |
0,0806 |
0,70 |
0,298 |
|
16 |
0,0809 |
0,74 |
0,284 |
|
17 |
0,0798 |
0,77 |
0,271 |
|
18 |
0,0795 |
0,80 |
0,259 |
|
19 |
0,0787 |
0,84 |
0,249 |
|
20 |
0,0782 |
0,86 |
0,239 |
|
21 |
0,0774 |
0,90 |
0,231 |
|
22 |
0,0770 |
0,93 |
0,223 |
|
23 |
0,0764 |
0,96 |
0,216 |
|
24 |
0,0762 |
0,99 |
0,209 |
|
25 |
0,0755 |
1,02 |
0,203 |
|
26 |
0,0742 |
1,05 |
0,198 |
|
27 |
0,0744 |
1,07 |
0,192 |
|
28 |
0,0743 |
1,11 |
0,187 |
|
29 |
0,0727 |
1,13 |
0,183 |
|
30 |
0,0733 |
1,16 |
0,178 |
|
31 |
0,0725 |
1,18 |
0,174 |
|
32 |
0,0727 |
1,22 |
0,170 |
|
33 |
0,0713 |
1,24 |
0,167 |
|
34 |
0,0718 |
1,27 |
0,163 |
|
35 |
0,0709 |
1,29 |
0,160 |
|
36 |
0,0705 |
1,32 |
0,157 |
|
37 |
0,0704 |
1,35 |
0,154 |
|
38 |
0,0702 |
1,37 |
0,151 |
|
39 |
0,0695 |
1,41 |
0,149 |
|
40 |
0,0693 |
1,42 |
0,146 |
|
41 |
0,0686 |
1,45 |
0,144 |
|
42 |
0,0690 |
1,47 |
0,141 |
|
43 |
0,0685 |
1,50 |
0,139 |
|
44 |
0,0680 |
1,52 |
0,137 |
|
45 |
0,0679 |
1,55 |
0,135 |
|
46 |
0,0676 |
1,57 |
0,133 |
|
47 |
0,0677 |
1,60 |
0,131 |
|
48 |
0,0676 |
1,62 |
0,129 |
|
49 |
0,0678 |
1,64 |
0,127 |
|
50 |
0,0667 |
1,67 |
0,126 |
The table contains the numerical values of the given complex heating source Q, according to equation (1). The numerical values of the velocity of the moving heating source v and the integration time t were chosen by analogy with Figs. 2 and 3, respectively. The calculations were performed using the simplified model (2), that is, the y and z coordinates were varied, and the x coordinate was selected by the maximum area of the heat affected zone. With such choice of modeling parameters according to the results obtained by the authors earlier [8-10], the shape of the heat-affected zone is as close as possible to the shape of the weld cross-section. Numerical values of functional J in the table were determined by equation (2) for the whole volume of material bounded by the heat-affected zone. The authors admitted the existence of correlation between the values of all columns of the table.
Based on the results presented in the table, the authors obtained a graph of the dependence of the functional J on the value of the input energy of the complex heating source, shown in Fig. 4. If we take as a basis the hypothesis about the proportionality between the quality of the weld and the numerical value of the functional (2), then according to the obtained dependence shown in Fig. 4, the authors made the following assumption that when welding thin-walled structures, there is no need for equipment that provides a highly stable very small welding current.
Thus, using a modern development tool, the authors will develop a new approach to the search for welding modes in order to obtain a stable weld quality and repeatability.
Based on the tabulated results, the authors obtained a graph of the dependence of the energy of the heating source and the speed of its movement, shown in Fig. 5. This graph is an important addition to Fig. 4. It explains how in practice it is possible to implement the hypothesis, suggested by the authors, of improving weld quality due to a proper combination of the heating source energy and its velocity.
It should be taken into account that the simulation was performed for an ideal heating source. For real welding equipment, the simulation results do not match. That is why the authors suggest determining the scale factor of a particular equipment. For this purpose it is necessary to carry out a test welding on the sample, followed by measuring of penetration depth. On the diagram in Fig. 5, it is necessary to find a point corresponding to the speed at which the welding was carried out, determine the energy Q corresponding to this point.
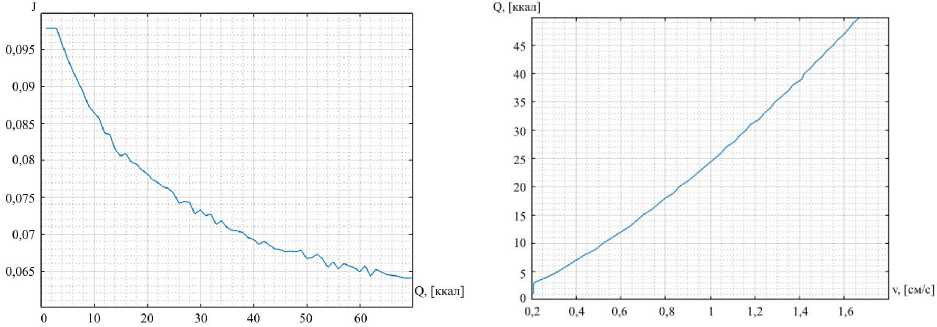
Рис. 4. График зависимости функционала от энергии источника нагрева
Fig. 4. Graph of the dependence of the functional on the energy of the heating source
Рис. 5. График зависимости энергии источника нагрева от скорости его движения
Fig. 5. Graph of the dependence of the energy of the heating source on the speed of its movement
By comparing the energy from the graph with the energy entered during welding, we obtain a scaling factor. Thus, we adapt the simulation graphs with the real heating source. The graphs obtained by the authors present the value of the functional corresponding to the real weld. Also on the basis of the received dependence diagrams it is possible to estimate a possibility to decrease the value of the functional by changing the energy of the source and the corresponding adjustment of the welding speed.
Conclusion
The article developed a new approach to the search for technological regimes in electron-beam welding. In the course of the study, the authors simulated a thin-walled plate of aluminum alloy AD31
with a thickness of 0.12 cm. As a result, by changing such values as: beam current and welding speed, the temperature distribution on the product surface during electron-beam welding was obtained, which showed that it was possible to work out a new technological process by means of simulation.
The proposed approach can be applied to electron-beam welding of elements of waveguide ducts to improve their reliability by increasing the corrosion resistance at the joints.
References Simulation of the mode of electron-beam welding of a thin-wall structure from AD31 alloy
- Hosseinib S. A., Abdollah-Zadeh A., Naffakh-Moosavy H., Mehri A. Elimination of hot crack-ing in the electron beam welding of AA2024-T351 by controlling the welding speed and heat input. Journal of Manufacturing Processes. 2019, Vol. 46, P. 147–158.
- Starkov I. N., Rozhkov K. A., Olshanskaya T. V., Zubko I. A. Expansion of technological capa-bilities of the electron beam welding installation. Journal of Physics: Conference Series. IOP Publish-ing. 2021. Vol. 2077, No. 1, P. 012021.
- Kornilov S. Y., Rempe N. G. Formation and focusing of electron beams in an electron-optical system with a plasma emitter in a magnetic field. Technical Physics Journal. 2012, Vol. 82, No. 3, P. 7984.
- Tyunkov A. V., Burdovitsin V. A., Oks E. M., Yushkov Yu. G. An experimental test-stand for investigation of electron-beam synthesis of dielectric coatings in medium vacuum pressure range. Vacuum. 2019, Vol. 163, P. 31–36.
- Oltean S. E. Strategies for monitoring and control with seam tracking in electron beam welding. Procedia Manufacturing. 2018, Vol. 22, P. 605–612.
- Dávid L., György K., Galaczi L. A. Survey of optimal Control and model prediCtive Control with State eStimation and a real time application. Műszaki Tudományos Közlemények. 2020, Vol. 13, No. 1, P. 19–30.
- Zhang Q., Liu J., Bai L., Feng L., Guo Z. Numerical simulation on electron beam welding of ti-tanium alloy based on ANSYS. Electric Welding Machine. 2015, Vol. 11, P. 1–10.
- Kurashkin S., Rogova D., Tynchenko V., Petrenko V., Milov A. Modeling of Product Heating at the Stage of Beam Input in the Process of Electron Beam Welding Using the COMSOL Multiphysics System. Proceedings of the Computational Methods in Systems and Software. Springer, Cham. 2020. P. 905–912.
- Tynchenko V. S., Kurashkin S. O., Murygin A. V., Tynchenko Y. A. Energy distribution model-ling in the weld zone for various electron beam current values in COMSOL Multiphysics. Journal of Physics: Conference Series. IOP Publishing. 2021, Vol. 1889, No. 4, P. 042058.
- Kurashkin S. O., Seregin Y. N., Tynchenko V. S., Petrenko V. E., Murygin A. V. Mathemati-cal functional for thermal distribution calculating during the electron-beam welding process. Journal of Physics: Conference Series. IOP Publishing. 2020, Vol. 1515, No. 5, P. 052049.
- Konovalov A. V. Teoriya svarochnykh protsessov [Theory of welding processes]. Moscow, Izd-vo MGTU im. N.E. Bauman Publ., 2007, 752 p. (In Russ.).
- Gilmutdinov R. Z. [Analytical description of surfaces by the superposition method]. Science today: theoretical and practical aspects. 2015, P. 132–138. (In Russ.).
- Otarov A., Utepbergenova G., Artykbaev M. [Solving linear boundary value problems for or-dinary differential equations by the superposition method]. Bulletin of Berdakh Karakalpak State University. 2017,. Vol. 35, No. 4, P. 3–6. (In Russ.).
- Delnov V. N., Levchenko Yu. D., Shepelev S. F. [Superposition method for modeling the tem-perature field in heat exchange devices by the tracer concentration field]. News of higher educational institutions. Nuclear energy. 2009, No. 3, P. 152–160 (In Russ.).
- Kaniyazov S. K., Muratov A. S. Research of complex differential conductivity of multi- layer heterostructures. Radioelectronics and Communications Systems. 2011, Vol. 54, No. 11, P. 619–624.
