Slow steaming as competitive advantage of contemporary liner company

Author: Yazev M.V., Korolev S.A.
Journal: Форум молодых ученых @forum-nauka
Article in issue: 7 (23), 2018.
Free access
This article is devoted to investigation of limits of efficiency of slow steaming. The goal of our research was to define bunker price level at which the transition to slow steaming becomes efficient for liner companies. We have developed a methodology allowing us to determine the critical bunker prices based on the fuel consumption dependence on cruising speed and effective demand for carriage on delivery time. The obtained results show that the current price level allows to speak about the efficiency of slow steaming only on particular voyages for certain classes of vessels.
Slow steaming, green logistic, bunker prices, liner company, fuel economy
Short address: https://sciup.org/140283812
IDR: 140283812
Text of the scientific article Slow steaming as competitive advantage of contemporary liner company
Slow steaming means deliberate reduction of vessel cruising speed in order to cut fuel costs.
It originally started around 2007 to 2008 for container shipping by Maersk Lines, the period when the market experienced an oversupply of shipping tonnage, declining freight rates, and increasing bunker prices [1].
Now prices of crude oil are growing after reduction in 2015-2016 and bunker prices growing contemporaneously with them [2], so slow steaming becomes actual again.
Fuel market research and growth predictions
Global Bunker Fuel Market was valued at $97 203 million in 2016, and is expected to reach $142 489 million by 2023, registering a CAGR of 9,6% from 2017 to 2023. Bunker fuel is the fuel oil/gas delivered to ships of all states that are engaged in international navigation. The international navigation may take place via sea, on inland lakes & waterways, and in coastal waters. The two major bunker fuel classifications in the marine industry are distillates and residual fuel oils. Marine distillates are divided into marine gas oil (MGO) and marine diesel oil (MDO). Marine gas oils are used in small, highly rated diesel engines, which are found in many types of ships. Residual fuel oil, also known as heavy fuel oil (HFO), is the highest viscosity oil fuel. The most commonly used heavy fuel oil at sea are the Intermediate Fuel Oils, IFO180, and IFO380 [3].
Second global trend of recent years is – the growth of average bunker price. During last year, it has grown from 325 to 475 dollars per tonne [2]. Moreover, according to the available forecasts of Goldman Sachs Bank, the price of crude oil, which determinate bunker price, will continue to remain at the level not lower than the current one [4].
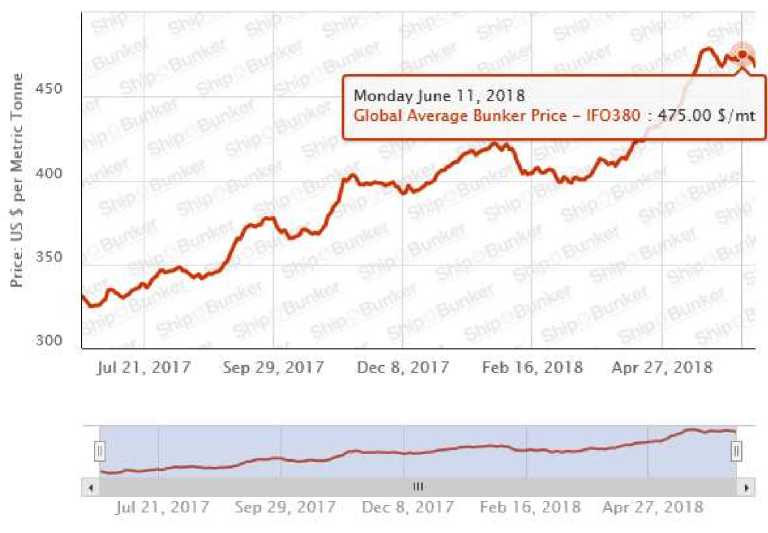
Figure 1 – Global average bunker prices
Nowadays sea transportation become the most widely used method of global logistics all around the world including Russia [5]. So it is crucial to cover costs in every stage of this process. Together above-described facts lead to increased interest in such way of operation as slow steaming.
Dependence of freight on the speed of the carriage
There is one most important determinant, which limits the implementation of slow steaming – it causes the increase of transportation time. Consumers of sea transportation will choose the fastest alternative if other characteristics are similar. Moreover, for perishable goods time of transportation is the most critical aspect of delivering [6].
So, if liner company decides to use slow steaming it will be forced to reduce freight rates. Our aim is to set functional dependency between cruising vessel speed, and freight rate.
For analyses, we used data from open source1. We took several Europe-Asia voyages: Rotterdam – Tokyo, Barcelona – Hong Kong, Valencia – Shanghai and looked for cost of transportation of one 20 ft. container.
For further computing, we assumed that liner company uses Post-Panamax class vessel, with capacity 12000 TEU2, and it will go through Suez Canal. Also we assumed that it takes about four days to load and unload vessels of this class and about two days for cargo processing in the terminals at the ports [7].
To calculate unit price we used the following formula:
С * Сар * кРи = (d-6) *1000
Where, Ри - unit price of transportation of all containers in thousands dollars per traveling day;
-
C – price of delivering one 20 ft. container in euros;
Сар - capacity of vessel, we assumed it 12000 TEU;
-
k – currency exchange rate EUR to USD, we assumed it 1,1564 According to 12:00 21 June 20183;
-
d – duration of delivery in days.
In order to calculate average speed we used the following formula:
D
*..
Where, AVG – average speed on the whole distance in knots;
D – distance between ports of departure and arrival in nautical miles; d – duration of delivery in days.
During evaluation of fuel costs it is important to take into account that average speed of ship is usually approximately 25-35% lower than its cruising speed [8], which fuel consumption depends on.
To calculate cruising speed we used the following formula:
cs =
AVG
0,7
Where, CS – cruising speed
AVG – average speed on the whole distance in knots.
As for Post-Panamax class, correlation between ship size, speed and fuel consumption looks the way it is represented in the following figure (10 000+
TEU) [9, p.5].
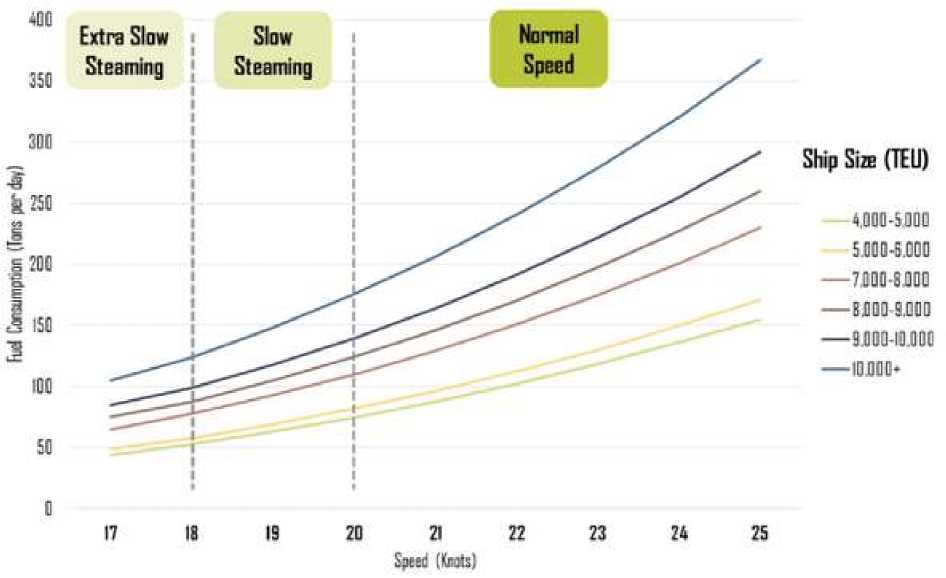
Figure 2 – Correlation between ship size, speed and fuel consumption
Table 1. Dependence of the unit price and fuel consumption on the cruising speed of the vessel.
|
Trip |
Distance, nautical miles4 |
|||||
|
Rotterdam – Tokyo |
Duration, days |
48 |
45 |
38 |
35 |
11192 |
|
Price, € |
411,09 |
541,72 |
653,53 |
701,83 |
||
|
Unit price, thousands $ per day |
135,8 |
192,8 |
283,4 |
335,8 |
||
|
Avg. speed, knots |
11,1 |
12,0 |
14,6 |
16,1 |
||
|
Cr. speed, knots |
15,9 |
17,1 |
20,8 |
23,0 |
||
|
Fuel consumption, t/day |
95 |
110 |
200 |
275 |
||
|
Trip |
Distance, nautical miles |
|||||
|
Barcelona – Hong Kong |
Duration, days |
37 |
33 |
29 |
28 |
8062 |
|
Price, € |
149,75 |
242,95 |
274,55 |
281,85 |
||
|
Unit price, thousands $ per day |
67,0 |
124,9 |
165,6 |
177,8 |
||
|
Avg. speed, knots |
10,8 |
12,4 |
14,6 |
15,3 |
||
|
Cr. speed, knots |
15,5 |
17,8 |
20,9 |
21,8 |
||
|
Fuel consumption, t/day |
90 |
120 |
200 |
235 |
||
|
Valencia – Shanghai |
Duration, days |
40 |
33 |
30 |
29 |
8920 |
|
Price, € |
149,75 |
201,59 |
242,95 |
288,08 |
||
|
Unit price, thousands $ per day |
61,1 |
103,6 |
140,5 |
173,8 |
||
|
Avg. speed, knots |
10,9 |
13,8 |
15,5 |
16,2 |
||
|
Cr. speed, knots |
15,6 |
19,7 |
22,1 |
23,1 |
||
|
Fuel consumption, t/day |
90 |
170 |
240 |
275 |
||
Aiming at setting functional dependence between unit price and fuel consumption on the cruising speed of the vessel, we used an assumption, that both dependences have an exponential character [9, 10].
For the analysis, we used the Microsoft Excel exponential trend line function. Obtained results are shown in figure 4.
400,0
■ S 350,0
CD
300,0 ru
■ § 250,0
ъ
"О 200,0
ru cn
О 150,0
y = 8,4772e0,1514x
8 100,0
О_
‘Е 50,0
Z>
0,0
0,0
5,0
10,0 15,0
y = 14,336e0,1195x
ru "О
250 Q_
C
О
С о
150 Е
100 °
20,0
0 25,0
Cruising speed, knots
-
• Unit price • Fuel consumption
-
Figure 3 – Dependences of fuel consumption and unit price of carriage on ship speed
In result, we got the following dependences:
Ри = 14,336e0,1195CS
Where, Ри - unit price of transportation of all containers in thousands dollars per traveling day;
CS – cruising speed in knots.
FC = 8,4772е0Д514С5
Where, FC – fuel consumption in tons per day;
CS – cruising speed in knots.
Traditionally, the cruising speed lower than 21 knots is related to slow steaming [9, 11]. In order to determine the price of fuel at which it will be profitable to transport at a speed lower than that, we have elaborated the following model.
It is obvious that if in case of growth of the speed, fuel costs will increase faster than price of transportation, then increase of the speed is not economically feasible.
Using constant multiple rule [12] and following relation:
Cf = FC * Рв
Where, C f - fuel costs in dollars per day
FC – fuel consumption in tons per day;
Рв - bunker price in dollars per tonne;
we have derived the final formula.
ВРС =
Р«(21) * 1000 FC'(21)
Where, ВРС - critical bunker price - price at which the transition to slow steaming becomes efficient
Р ^ - derivative of unit price of transportation of all containers;
FC' - derivative of cruising speed.
By calculating the derivatives we have obtained:
Р^(21) = 14,336 * 0,1195 * e0,1195*21 = 21,0697FC'(21) = 8,4772 * 0,1514 * e0,1514*21 = 30,8443
Final critical price:
ВРС =
21,0697 * 100030,8443
= 683,1 $/t
It should be noted that bunker prices reached this level only on the cusps in 2008 and 20135. However, there are some important factors, which cause a lower actual critical price.
Firstly, the availability of getting discounts for large orders. For instance, iContainer offer up to 7% discount. Thus, the actual rate of ВРС for Post-Panamax class vessels may be within the limits of 630-700 dollars per tonne.
The second factor is more significant. It consists in the fact that nowadays there is a trend resulting in increase of the size of container ships. Large vessels give a much greater effect from the speed reduction, since they have worse streamlining, and they have to overcome significant resistance of the environment [13].
According to some estimates, the efficiency of the slow steaming logarithmically depends on the size of the vessel [14].
In order to calculate potential efficiency of applying slow steaming we used the following formula:
r r p ss
Where, rp - potential reduction of fuel consumption after transition to slow steaming in percent;
r – general reduction of fuel consumption in whole group in percent;
ss – percentage of vessels in whole group, which used slow steaming.
Table 2. Impact of slow steaming on fuel consumption and CO2
emissions by trade (2008, 2010)
|
Vessel size (TEU) |
Mean size (TEU) |
% in slow steaming |
% reduction |
% reduction, potential |
|
1,000-2,000 |
1481 |
19,4 |
2,6 |
13,4 |
|
2,000-3,000 |
2542 |
22,6 |
4,8 |
21,2 |
|
3,000-5,000 |
4087 |
37,2 |
7,7 |
20,7 |
|
5,000-8,000 |
5948 |
65,7 |
14,0 |
21,3 |
|
8,000+ |
9175 |
75,5 |
17,0 |
22,5 |
By using the Microsoft Excel logarithmic trend line function, we get the following predictions.
30,0
25,0
y = 4,2247ln(x) - 15,039
20,0
15,0
10,0
о
5,0
0>
□с
0,0
0 5000 10000 15000 20000 25000
Vessel size, TEU
-
Figure 4 – Dependence of the reduction of fuel consumption on vessel size
гр = 4,2247 * ln VS — 15,039
Where, rp - potential reduction of fuel consumption after transition to slow steaming in percent;
r – vessel size in TEU.
Therefore, for modern vessels of the Triple E-Class (more than 18200 TEU) and Post-Triple E-Class (more than 21000 TEU) potential reduction of fuel consumption after transition to slow steaming can reach
rp = 4,2247 * In 23000 - 15,039 = 27,4% while Post-Panamax vessels can reach only
rp = 4,2247 * In 12000 - 15,039 = 24,6%
This determines the range of critical bunker price from 565 to 630 dollars per tonne for this class of vessels.
Third consideration – different demand on sea transportations on different voyages. For example, if we take into account only Spain – Chania trips, then the critical bunker price level will be much lower.
250,0
200,0
y = 8,4772e0,1514x
150,0
100,0
50,0
0,0
0,0
5,0
y = 9,2688e0,1302x
10,0 15,0 20,0
га"
. Q-
С О
о
Е
100 о
25,0
Cruising speed, knots
Unit price Fuel consumption
-
Figure 5 – Dependences of fuel consumption and unit price of carriage on the speed of the ship
We got the following dependence:
Ри = 9,2688e°,1302CS
Where, PU - unit price of transportation of all containers in thousands dollars per traveling day;
CS – cruising speed.
By calculating the derivative we have obtained:
PU(21) = 9,2688 * 0,1302 * e°,1302*21 = 18,5816
Final critical price:
BPC =
18,5816* 100030,8443
= 602,4 $/t
Moreover, if we also take into account the possible discounts for a large volume we will get a range of critical prices 560-610 dollars per tonne.
The last reason for using slow steaming even with lower level of bunker prices is an environmental impact. Such organizations like Marine Environment Protection Committee require carriers to continuously reduce harmful emissions, what can be easily achieved by using slow steaming.
Conclusions
We have found that at the current bunker price level, the use of slow steaming is mostly inefficient, with the exception of certain voyages and PostTriple E-Class vessels. However, if the trend of increasing of crude oil and bunker fuel prices continues, this way of operation will soon be able to become profitable again for a large number of liner companies.
In the meantime, slow steaming pursues ecological objectives and helps companies to meet emissions requirements, and thus achieve competitive advantages in the field of green reputation.
References Slow steaming as competitive advantage of contemporary liner company
- Slow Steaming. [Electronic resource]. Access from the site https://en.wikipedia.org/wiki/Slow_steaming
- Global Average Bunker Price. [Electronic resource]. Access from the site: https://shipandbunker.com/prices/av/global/av-glb-global-average-bunker-price
- Dwivedi D. Global Bunker Fuel Market. Opportunities and Forecasts, 2015-2023 // Allied Market Research, 2017, 300 p.
- Oil market. Forecast. Goldman Sachs supported oil prices. [Electronic resource]. Access from the site: https://bcs-express.ru/novosti-i-analitika/rynok-nefti-prognoz-goldman-sachs-podderzhal-neftianye-tseny
- Cрerenkov N. I. Rusanovskij S. A. The Fleet And The Marine Container Transportation In Russia // Infrastructural Sectors Of The Economy: Problems And Prospects Of Development, 2014, no. 6, pp. 78-85
- Garaeva M. L. The main aspects of development of industry of marine container transportation in the international logistics by example of the Maersk Line. // Young Scientist, 2016, no. 11, pp. 650-654.
- Ducruet C., Itoh H., Merk O. Time Efficiency at World Container Ports // International Transport Forum. Discussion Paper, 2014, no. 8, 30 p.
- Drusinsky D. Monitoring Temporal Rules Combined with Time Series // Computer Aided Verification: 15th International Conference, 2003, pp. 114-117
- Dagkinis I., Nikitakos N. Slow Steaming Options Investigation Using Multi Criteria Decision Analysis Method // ECONSHIP2015, 2015, 14 p.
- Kuznetsov S. B. Analytical Representation of The Curves of Aggregate Supply and Demand // Siberian Financial School, 2005, no. 2, pp. 60-64
- The economics of slow steaming [Electronic resource]. Access from the site http://www.seatrade-maritime.com/news/americas/the-economics-of-slow-steaming.html
- Constant multiple rule [Electronic resource]. Access from the site https://en.wikipedia.org/wiki/Constant_multiple_rule
- Tezdogan T., Incecik A., Turan O., Kellett P. Assessing the Impact of a Slow Steaming Approach on Reducing the Fuel Consumption of a Containership Advancing in Head Seas // Transportation Research Procedia, 2016, vol. 14, pp. 1659-1668
- DOI: 10.1016/j.trpro.2016.05.131
- Cariou P. Is slow steaming a sustainable means of reducing CO2 emissions from container shipping? // Working Paper, September 2014, 14 p.
