“Smart” benchmarking as a basis for strategic planning in regional development

Author: Dubrovskaya Yuliya V., Kudryavtseva Maria R., Kozonogova Elena V.
Journal: Economic and Social Changes: Facts, Trends, Forecast @volnc-esc-en
Section: Regional economy
Article in issue: 3 (57) т.11, 2018.
Free access
Addressing the problem of scientific substantiation of the region’s development priorities is an urgent issue for both regional researchers and territorial managers. At the same time, when determining the areas of development, the emphasis is often put on successful experience of the leading territories. This method of transplantation of best practices in order to improve the performance of the object under analysis is called benchmarking. In classical understanding, the key stages of regional benchmarking are: selection of the leading region for comparison, identifying the differences between the leading region and the region under analysis, analysis of key success factors of the leading region, and implementing successful experience in the economic practice of the research area. At the same time, the absence of preliminary analysis of reasons and prerequisites for achieving leadership by best regions, comparison of territories with objectively different characteristics of socio-economic development, leads to non-compliance with the most important principle of regional development planning - the principle of goal-setting...
"smart" benchmarking, regional development, strategic planning, distance matrix, benchmarking procedure, identical regions
Short address: https://sciup.org/147224049
IDR: 147224049 | UDC: 332.1 | DOI: 10.15838/esc.2018.3.57.7
Text of the scientific article “Smart” benchmarking as a basis for strategic planning in regional development
Solving the problem of effective functioning of socio-economic systems at any level is always associated with the search and identification of strategic development priorities. At the same time, special attention of both theorists and practitioners is focused on territorial units at the meso-level – regions due to the fact that the most important elements of the innovation process are, as a rule, geographically localized, resulting in competitive advantages being formed at the regional, rather than the national level [1, pp. 24–25].
According to the results of analyzing the current state of research on regional development, most of the problems of strategic management are concentrated in internal management functions, in particular, in organization and planning. Thus, Russian researchers consider the most problematic issues in formation of effective regions’ development strategies the following: lack of coordination of interests and development goals of economic actors [2, p. 49], difficulties in achieving the objectives of the innovative development strategy [3, pp. 250–255], uncertainty in approaches to managing socioeconomic development of the region [4, p. 2393], copying of strategic documents on regional development [5, p. 7, 12].
Thus, addressing the issue of effective management of functioning and development of Russia’s constituent entity is closely connected with the search for a universal, transparent approach to planning activities to identify effective investment patterns and objects of priority budget financing. Therefore, we can make a fairly objective conclusion that the defining stage of the procedure for strategizing is the process of determining the priorities of region’s development. Academic papers on this problem can be divided into three areas.
The first area of identifying regional development priorities includes research where the researchers are guided by industry parameters to improve the region’s economy when defining the promising areas. Thus, V. Rokhchin and A. Dalgatova note that priority development should be given to economic activities and production with certain advantages over the rest [6, p. 100]. The work of A. Avezov and M. Azimova focuses on identifying the most promising areas and parameters of region’s economic development, ensuring its sustainable growth [7, p. 32]. According to S. Lipina, priority should be given to the sectors that are able to generate positive changes in the territory’s economy, and ensure further competitiveness and economic stability [8, p. 18].
The second area includes works by researchers promoting the research approach to identifying regional development priorities. Within the framework of this approach, innovative, breakthrough areas of regional economic development based on the results of scientific research and development are determined as the main ones. Thus, S. Tikhomirov in his work considers strategic priorities for region’s development as the main areas of research and development, implementing which should provide a significant contribution to the social, scientific, technological, and industrial development of the country and help achieve national socioeconomic goals [9, p. 33]. G. Manicad argues that the process of establishing priorities is a choice between alternatives to regional scientific research [10, p. 13]. W. Janssen, A. Kassam and A. Janvry define regional priorities as a hierarchical series of research projects arranged in order of importance of their implementation results, which will improve the region’s performance [11, p. 75].
The third area of identifying regional development priorities includes research works, which in determining future areas of development of the region’s economy are focused on the experience of the leading territories. The representatives of this area in Russia are A. Bykova [12], M. Islamova, R. Bakhitova, R. Kireeva [13], V. Moskovkina, I. Krymskii [14], P. Rastvortseva, M. Larionova [15], S. Chervyakova [16], and D. Krasnosel’skaya [17]. The representatives of this area in Western contries are N. Groenendijk [18], L. Iurcovich [19], S. Koellreuter [20].
All these authors use a method based on the choice of “best examples” by comparing individual criteria of socio-economic and innovative development of a territory (its size, population density, economic structure, innovation level, geographical location and other specific features). This method is called benchmarking and the method of the benchmarking procedure was initially developed to improve business processes in various areas of commercial activity: marketing, product portfolio policy, HR management, logistics, pricing policy, etc. Later this tool became widely used in relation to the objects at the meso-level –territorial units. The term “regional benchmarking” refers to “interregional comparisons of activities, processes, practices, policies and use of this information to promote regional development” [20, p. 14].
It is important to note that the majority of domestic research in regional benchmarking compare Russia’s constituent entities under analysis with those showing the best indicators of social and economic development, regardless of whether they have similar characteristics or not.
At the same time, recent developments of foreign regional researchers have identified objective shortcomings of this approach which they call “simplified benchmarking” [21, 22, 23]. They consist in lack of preliminary analysis of causes and prerequisites for achieving leadership by best regions. Indeed, the initial conditions for territories’ development are determined by formal and informal institutions that have developed historically and are essential for innovation [24]. Simply put, for objective reasons not all development indicators of leading regions can be practically achieved by outsider regions in the near future. Therefore, the results of “simplified benchmarking” are nothing but regional rankings and therefore cannot be an acceptable basis for the development of an effective strategy for territories’ development.
We note that the advantages of using another type of benchmarking called “smart/system benchmarking” were described in detail in 2001
[25]. The point of applying this type of benchmarking is based on preliminary analysis of initial conditions for the development of subjects to compare. Thus, “smart” benchmarking of regional systems involves the elaboration of the development strategy based on comparison with territories with similar institutional conditions and development indicators.
The need to correctly adapt benchmarking tools to regional socio-economic systems, as well as insufficient information on the possibilities and prospects of using the results of the benchmarking technology by domestic researchers mainstream the methodological issues of its development and testing in Russia’s constituent entities in order to determine the effective system of priorities for territories’ development.
Research methods
The methodological framework of the benchmarking procedure is the methodology developed by the Basque Institute of Competitiveness [26] and adapted to Russian conditions taking into account the features of spatial planning of the domestic economy. The elaboration of the regional development strategy based on “smart” benchmarking is expected to be carried out in two successive stages. The first stage is preparatory and consists of collection, systematization and processing of statistics. The second stage involves analysis and identification of priorities for the development of a particular region chosen for the study. Let us focus on the content of these stages.
Stage 1. Construction of a global distance matrix by region.
The importance of this stage is due to the conceptual feature of “smart” benchmarking which implies the need to compare areas with similar institutional conditions. The comparison is based on the correlation of regional development indicators reflected in the distance matrix. To build a global distance matrix by region preliminary selection and normalization of quantitative data is carried out first (step 1) and , second, structural distance indices are calculated (step 2).
Step 1. Collection and normalization of quantitative data.
Statistics database for determining the similarity of territories includes, first, criteria for comparative analysis; second, the factors detailing them; and third, quantitative statistical indicators. During the process of criteria selection the following conditions are met: informational value (i.e., they should characterize the mapping objects), quantitative evaluation (for objective comparison), incorrelability (independence). Each criterion includes factors that detail it. The detailing factors for comparing regions are, firstly, those that best reveal the strengths and weaknesses of a territory, and second, do not tend to change in the short term. Further, for each factor appropriate statistical indicators are selected.
During the first step, asymmetry of indicator distribution is evaluated and, if necessary, their transformation (formula 1) is carried out, the values are levelled to a single scale (formula 2).
The asymmetry value characterizes the degree of distribution dissymmetry of a statistical indicator relative to the average indicator value in the country. If the asymmetry value is over 0.5, each indicator value is transformed according to formula (1) in order to fit the outlying data (extreme values):
Xij = V^ 7_° , (1)
where Xij transformed value of j-index of the i-th ерregion;
Xij_° — initial value of j -index of i-th region;
k – degree of asymmetry (takes values from 2 to 4 depending on the value of asymmetry coefficient ).
Indicators expressed in percentage remain unchanged, the rest are converted to percentage terms relative to the sum of values of variable of the corresponding indicator (2):
^ = _^L_ . 100% , (2)
мхч where – the normalized value of the j-index of the i-region.
Step 2. Calculation of structural distance indices.
The importance of this step is that it determines the regions’ similarity characterized by the values of structural distance indices. Regions with the structural distance index less than the threshold value are considered identical . To determine the threshold value of the structural distance index we carried out preliminary analysis based on the assumption that the optimal number of regions for comparison ranges from 7 to 10. This number of regions is formed when the structural distance index is less than 1. Therefore, the threshold value of the index is 1.
The structural distance index which constructs the distance matrix is calculated according to formula (3):
dU, i ) = 2 5=1 m j^-^ ) 2 , (3)
where d (i, i’) — structural distance index of the i-th region;
– value of j -index of i -initial region;
x^'j — value ofj-index of i -“another” region; mj — weighting factor.
Weighting factor is calculated according to formula (4):
m j = ^ /j, (4)
where a – number of criteria for comparing regions;
j – number of statistical indicators haracterizing the criterion.
Formula 3 indicates that each criteria for comparing regions is assigned an equal weight equally distributed between its constituent variables. This decision is based on the research results [22], which proved that the use of different weights does not produce significant changes in final results and significantly increases the subjectivity of the method as a whole.
The result of the first stage is the construction of the distance matrix with its elements being structural distance indices. In turn, the distance matrix serves as the basis for implementing the second elaboration stage of the regional development strategy based on “smart” benchmarking.
Stage 2. Identification of regional development priorities.
The importance of this stage lies in that it identifies priority development areas of a region under analysis. According to the methodology of “smart” benchmarking developed by the Basque Institute of Competitiveness, development priorities are determined by identifying the weaknesses of the analyzed region in the process of its comparison with identical regions. The indicators of the analyzed region, which have low values compared to average indicators of identical regions, are selected as the primary areas of development.
At the same time, this methodology should be supplemented by comparison of indicators of a region under analysis with the national average. The choice of average values for analysis is associated with inefficient comparison of indicators of the region under analysis with maximum values of the leading regions due to specific features of Russia’s constituent entities due to their high differentiation. At the same time, comparison with the average values will help identify the weaknesses of the region under study. The efficiency of such analysis is confirmed by a number of similar studies where the average value was used as the minimum acceptable value of the estimated index [12, 27].
In addition, the novelty if the author’s approach lies in the hypothetical assumption that comparing the analyzed region with only identical ones can lead to the loss of important development priorities. For example, if the indicator is low in both region under analysis and in all regions identical to it, it will not be identified in analysis according to the Basque Institute of Competitiveness. As a result, measures to improve it will not be taken.
Thus, the methodology of “smart” benchmarking developed by the Basque Institute of Competitiveness has been improved by the authors in terms of adding the procedure of comparing the indicators of the analyzed region with the national average.
Research results
The procedure of “smart” benchmarking was tested within the main stages of the regional development strategy implementation based on statistical data of Russian regions for 2015 published by the Federal State Statistics Service. The Republic of Crimea and the city of Sevastopol were not engaged in regional benchmarking due to lack of data for comparison. We have built a complete distance matrix for the rest of Russian regions. The resulting matrix is symmetrical to the main diagonal.
We have chose Perm Krai as the region to analyze. The region leads in terms of innovative development and implementation of the cluster policy. It is in Perm Krai where, in addition to two innovative territorial clusters, operate two industrial and one strategically important inter-regional cluster uniting enterprises and research institutions from different Russian regions (Perm Krai, the Sverdlovsk Oblast and
Udmurt Republic) – the “Photonics” cluster of fiber-optic technology.
At the same time, the proposed benchmarking procedure is universal and can be applied to any territorial unit at both regional and municipal level.
Stage 1. Construction of a global distance matrix by region.
Because of the need to select data that do not tend to change in the short term, and taking into account the availability of information from the sources of the Federal State Statistics Service of Russia, we have identified seven criteria for regional development: geodemography, education, innovation, sectoral structure, investment climate, transparency, and social values. The criteria we have selected include 12 detailed factors and 34 statistical quantitative indicators ( Tab. 1 ).
Let us look closer at the reasons for the selection of criteria of primary importance when identifying similar regions. The first criterion is geodemographic. The basic indicators are the region’s territory size and population . The population directly affects the processes of production concentration. In turn, the population of the working age determines efficient functioning of regional economies. To identify the settlement structure of the region it is necessary to determine the degree of urbanization . Thus, regions with a high degree of urbanization have a smaller share of agricultural and a greater share of industrial functions. At the same time, the number of service institutions is increasing, as well as the diversity of occupations and the population’s territorial mobility. Therefore, a special role in the formation of economic and social space belongs to the territory’s transport availability . The developed transport infrastructure provides and simplifies commercial activities, leads to increased housing costs, and is a key factor in the integration of regional markets.
The second criterion is education . In recent years, the structure of factors determining territories’ competitiveness has undergone certain changes. For example, the importance factors such as affordable raw materials and cheap labor has decreased, and the educational factor has become more significant. Since the level of education is one of the most important factors determining the formation and development of intellectual capital and its rational use [28, p. 58], this criterion is important to consider when identifying similar regions. At the same time, the high level of education does not guarantee a high level of innovation in the region. Therefore, when contrasting the level of innovative development of the compared regions it is necessary to take into account separately components such as the amount of patent research and the share of innovative goods, works and services in the total volume of region’s shipped goods, works and services.
The next aspect determining the difference between the regions is the sectoral structure of the region characterized by the distribution of the average annual number of employed population by economic activity. Relying on the employment rate when studying economic activities and industries in the domestic environment is the most reasonable since it helps avoid the possible inaccuracies when using other indicators related to insufficient or imperfect information, in particular – the inconsistency between the income center and the center of economic activity. It is obvious that when developing the regional economic policy it is irrational to compare regions with different sectoral specialization.
The favorability of the regional policy for business development is characterized by the number of enterprises and organizations in the region. This indicator determines the investment climate of the territory – the
Table 1. System of criteria determining regions’ similarity*
|
Criterion |
Factor |
Statistical indicator |
Unit of measurement |
|
|
Geodemography |
Size of the region |
x1 x2 |
|
thousand km2 thousand people |
|
Population age structure |
x3 x4 |
|
% of the total population |
|
|
Urbanization |
x5 x6 |
|
% |
|
|
Transport availability |
x7 x8 x9 |
|
units mln people km of roadway per 1000 km2 of territory |
|
|
Education |
Level of education |
x10 |
- people with above-average education aged 15 and over per 1,000 people who specified their level of education |
people |
|
Innovation |
Patent research |
x11 x12 |
|
units |
|
Share of innovative goods, works, services |
x13 |
- share of innovative goods, works, services in the total volume of goods shipped, works performed, service provided |
% |
|
|
Sectoral structure |
Distribution of average annual number of employees by economic activity |
x14 x26 |
- agriculture, hunting and forestry, fisheries and fish farming; mining; manufacturing; production and distribution of electricity, gas, water; constructions; wholesale and retail trade; repair of motor vehicles, motorcycles, household and personal goods; hotels and restaurants; transport and communications; real estate, renting and business services; education; healthcare and social services; other community, social and personal services; other activities |
% of the total number of the employed |
|
Investment climate |
Enterprises and organizations |
x27 |
- number of enterprises and organizations per 1,000 people |
units |
|
Transparency |
Foreign economic activity |
x28 x29 |
|
mln U.S. dollars |
|
Social values |
Culture and tourism |
x30 x31 x32 x33 |
|
people |
|
Crime rate |
x34 |
- number of reported crimes per 100,000 people |
units |
|
* Compiled from: Russian regions. Socio-economic indicators. 2016: statistics book. Rosstat. Moscow, 2016.
efficiency of the entrepreneurship support and regulation system operating in the region.
Moreover, it is important to take into account the degree of openness of the region’s economy expressed through its export potential. Active export activity helps solve problems such as inefficient natural resource use, high unemployment rate, non-competitiveness of agricultural industries, low level of investment inflow, balance of payments deficit, which improves the population’s quality of life [29, p. 42].
In conclusion, an important criterion from the point of view of identifying similar regions is social values . The main indicators of this criterion are culture and tourism and crime rate. Combining such incompatible indicators is based on the well-known “circle of backwardness” in territory’s development (the term by D.S. L’vov). It implies a distorted system of population’s preferences and values leading to an increased amount of social diseases and a rise in crime rate. In the future, all this leads to labor outflow and the stagnation of the territory.
Further, according to the previously described research methodology, all indicators are tested for distribution asymmetry and are transformed. Note that 25 out of 34 statistical indicators were transformed, which is explained by high differentiation of regional development. Then all the indicators are brought to a single scale. Finally, a global distance matrix is constructed based on the calculated structural distance indices.
Stage 2. Identification of regional development priorities.
As mentioned above, Perm Krai was chosen as a region for analysis. Therefore, in the framework of the second stage of the regional development strategy elaboration based on “smart” benchmarking we have consistently compared the indicators of Perm Krai with the values of identical regions and with the national average values.
On order to determine the regions identical to Perm Krai we used the values of the global distance matrix for Russian regions. Table 2 presents a fragment of the matrix sorted structural distance index ascending order, where Perm Krai acts as a region under analysis (see column 2 of the matrix). As can be seen, 8 regions are identical to Perm Krai.
According to the table, the Kaluga Oblast has the lowest index of structural distance along with the Perm region.
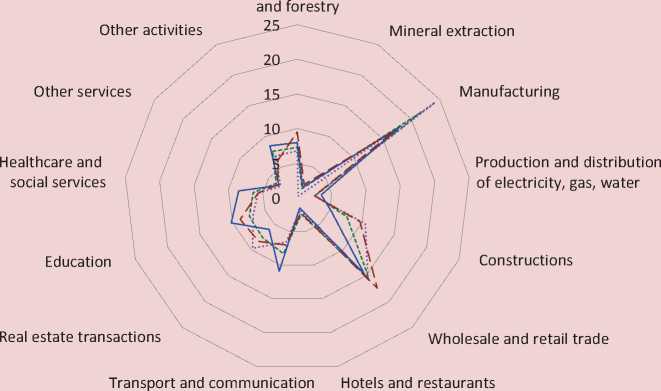
However, all regions identical to Perm Krai have a number of similar characteristics. Firstly, it is a high level of urbanization – the share of urban population in the total population is about 74%. Secondly – a highly pronounced specialization in manufacturing, as well as in wholesale and retail trade ( Fig. 1 ).
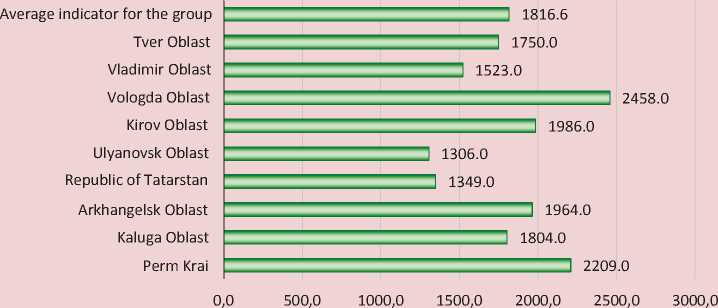
Then we determine the characteristics of Perm Krai development, which have low values compared to the average values of identical regions. First, this is the indicator of transport availability of the region. The low value of this indicator demonstrates the density of hard-surface public roads ( Fig. 2 ).
Second, the indicator of the level of education in Perm Krai ( Fig. 3 ).
The low number of educated people in Perm Krai is largely due to the outflow of intellectual capital to more attractive regions and abroad. Thus, according to the research conducted by Perm State National Research University
Table 2. Distance matrix of regions identical to Perm Krai
|
Region |
Perm Krai |
Kaluga Oblast |
Arkhangelsk Oblast |
Republic of Tatarstan |
Ulyanovsk Oblast |
Kirov Oblast |
Vologda Oblast |
Vladimir Oblast |
Tver Oblast |
|
Perm Krai |
0.436 |
0.480 |
0.582 |
0.634 |
0.713 |
0.832 |
0.868 |
0.944 |
|
|
Kaluga Oblast |
0.436 |
0.657 |
1.504 |
0.597 |
0.658 |
1.444 |
0.312 |
0.852 |
|
|
Arkhangelsk Oblast |
0.480 |
0.657 |
0.837 |
0.999 |
0.517 |
1.470 |
1.210 |
0.630 |
|
|
Republic of Tatarstan |
0.582 |
1.504 |
0.837 |
1.134 |
0.853 |
0.911 |
1.874 |
0.993 |
|
|
Ulyanovsk Oblast |
0.634 |
0.597 |
0.999 |
1.134 |
0.621 |
0.669 |
0.775 |
0.688 |
|
|
Kirov Oblast |
0.713 |
0.658 |
0.517 |
0.853 |
0.621 |
1.022 |
1.205 |
0.076 |
|
|
Vologda Oblast |
0.832 |
1.444 |
1.470 |
0.911 |
0.669 |
1.022 |
2.152 |
1.017 |
|
|
Vladimir Oblast |
0.868 |
0.312 |
1.210 |
1.874 |
0.775 |
1.205 |
2.152 |
1.503 |
|
|
Tver Oblast |
0.944 |
0.852 |
0.630 |
0.993 |
0.688 |
0.076 |
1.017 |
1.503 |
|
|
Calculations are based on the method developed by the authors. |
|||||||||
Figure 1. Distribution of average annual number of the employed by economic activity, 2015 as % of the total number of the employed
Agriculture, hunting
Perm Krai Kaluga Oblast
Arkhangelsk Republic of Tatarstan
Source: compiled by the authors based on: Russian regions. Socio-economic indicators. 2016: statistics book. Rosstat. Moscow, 2016. Pp. 140–167.
Figure 2. Indicators of transport availability of identical regions, 2015
|
Average indicaor in group |
_______________________________,___________________1 216.4 133.4 98.4 |
|
Tver Oblast |
__________________________________________________1 248.0 1 52.9 -------------1 64.0 |
|
Vladimir Oblast |
--------------------1 336.0 --------------1 74.0 105.7 |
|
Vologda Oblast |
_____1 118.0 --------------,-J 94.0 79.0 ------------------------1 114.0 |
|
Kirov Oblast |
1 93.0116.5 |
|
Ulyanovsk Oblast |
П 85.5 1 237.0 . 223.0 |
|
Republic of Tatarstan |
--------------------------------------------------------------1 423.0 1 72.0 311.3 . 21.0 |
|
Arkhangelsk Oblast |
88.2 68.0 |
|
Kaluga Oblast |
________ 428------------------------------------------1 321.0 42.8 118.0 ----------------------------1 130.0 |
|
Perm Krai |
________!_________________________________________। 303.8 --------------------1 95.0 |
|
0 |
50 100 150 200 250 300 350 400 450 |
-
□ Density of general-purpose hard-surface highways, km of roadway per 1000 km2 of territory
-
□ Bus passenger transportations, mln people, 2015
-
□ Number of public buses per 100,000 people, units
Source: compiled by the authors based on: Russian regions. Socio-economic indicators. 2016: statistics. Rosstat. Moscow, 2016. Pp. 849–856.
Figure 3. Number of people with above-average education aged 15 and over (per 1,000 people who specified their level of education), 2014
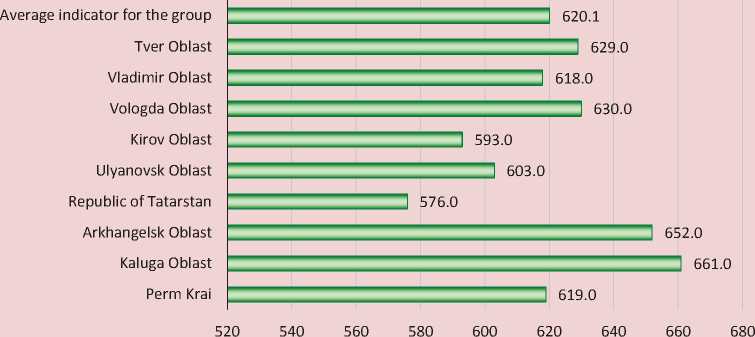
Source: compiled by the authors based on: Education in Russia: 2014: statistics book. Higher School of Economics. Moscow, 2014. Pp. 34–35.
[30], more than 70% of young people plan to leave the territory of Perm Krai. The reasons for possible migration of respondents are: low salaries, lack of employment opportunities, expensive housing and poorly developed social and transport infrastructure.
Third is the volume of innovative products, works and services in Perm Krai. This figure is 2% lower than the average for a group of identical regions ( Fig. 4 ), and almost 3 times lower than the maximum indicator of the group (Vologda Oblast).
Figure 4. Volume of innovative goods, works and services, 2015
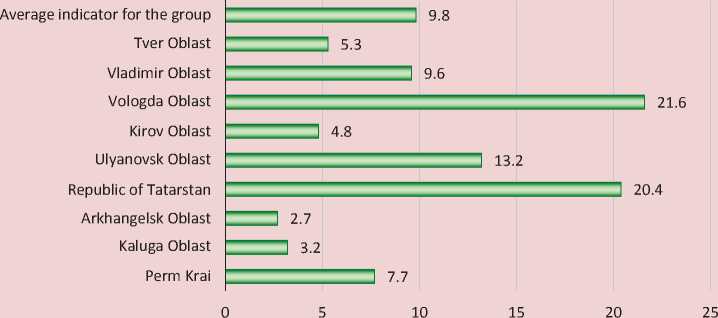
□ percentage of total volume of shipped goods, works performed, and services provided
Source: compiled by the authors based on: Russian regions. Socio-economic indicators. 2016: statistics book. Rosstat. Moscow, 2016. Pp. 1048–1049.
Figure 5. Number of reported crimes per 100,000 people in identical regions, 2015
Source: compiled by the authors based on: Russian regions. Socio-economic indicators. 2016: statistics book. Rosstat. Moscow, 2016. Pp. 511–514.
Fourth is high crime rate in Perm Krai. Thus, the crime rate exceeds the average value for identical regions by 22%, or by 393 reported crimes per 100,000 people ( Fig. 5 ).
Fifth, the development indicators in culture, where Perm Krai remains an outsider ( Fig. 6 ).
Thus, the weak points of Perm Krai revealed in comparative analysis help determine five priorities of its development: increasing transport availability, level of education, volume of innovative goods, works and services, reducing crime rate, improving the level of culture and leisure variety.
Figure 6. Indicators of cultural progress in identical regions, 2015
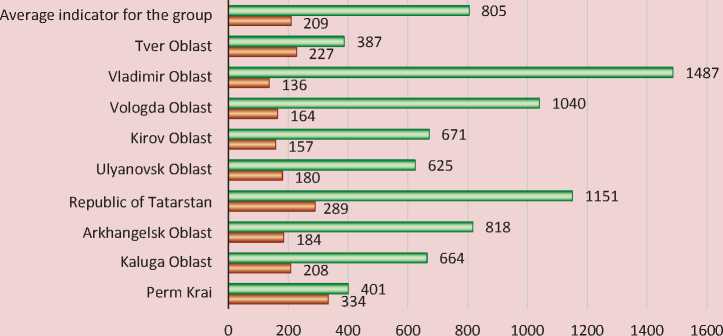
□ number of visits to museums per 1,000 people
□ number of theatregoers per 1,000 people
Source: compiled by the authors based on: Russian regions. Socio-economic indicators. 2016: statistics book. Rosstat. Moscow, 2016. Pp. 472–473.
Then the authors compared statistical indicators of Perm Krai development with the national average values. Analysis identified the weak points of Perm Krai. Some of the identified indicators coincided with those identified in the course of comparison with identical regions ( low level of transport availability, low level of education, high crime rate ); the second part united the weaknesses that were not manifested when comparing with identical regions ( age structure, urbanization, exports with CIS countries ). The emergence of the second group of indicators is due to the fact that in most regions identical to Perm Krai they have values below the average or close to the national average. This conclusion serves as empirical evidence that comparative analysis of the region under study only with identical ones, as provided by the Basque Institute methodology, would not help identify them.
Moreover, we also note an indicator such as “the volume of innovative goods and services”. The value of this indicator in Perm Krai is higher than the average Russian level, but much lower than in most identical regions. Therefore, the second conclusion states that that comparative analysis of the studied region only with the country’s leading regions, as in most studies of domestic authors, would not help identify the indicator “the volume of innovative goods, works and services” as a priority area of Perm Krai development.
Based on the above, we can say that the hypothesis about the need to identify priority areas of territory’s development by means of consistent double comparison of the average national indicators and indicators of identical regions has been confirmed.
During the systematization of priorities of Perm Krai development we selected six most promising ones from the point of view of success and achievability of optimization areas: all five priorities identified through comparing with the indicators of identical regions, and one priority out of three identified during analysis of the average national indicator values – the indicator of “urbanization” expressed in the share of urban and rural population in the total population of the region.
The settlement system is important for economic and social development. The most important problem of the settlement system in Perm Krai is the high population concentration in the City of Perm. The dominant type of distribution reflects the index of primacy of the largest city, equaling 5.8 for Perm (to compare: Moscow – 2.2) [31, p. 52]. This phenomenon is primarily the result of unemployment in the periphery, which occurs against the background of a constant decrease in the number of penitentiary facilities, aggravating environmental problems in rural areas, as well as the decline in profitability in a number of sectors of the regional economy in recent years. Therefore, in order to solve the problem of settlement optimization resulting from the high level of urbanization in Perm Krai it is necessary to take certain government measures and implement programs.
The systematization of development priorities in Perm Krai is presented in Table 3.
According to Table 3, the Republic of Tatarstan is the leader in transport development. There, the density of hard-surface public roads is 423 km per 1,000 km2. The Kaluga Oblast ranks first in the level of education. Here, 661 people per 1,000 people aged 15 and over who specified their level of education have education above average. Innovative goods and services in the Vologda Oblast make up 21.6% of the total volume of shipped goods, works and services
Table 3. Development priorities of Perm Krai*
|
Development priorities |
Development benchmarks, units of measurement |
Statistical indicators |
Leading regions among identical ones |
|||
|
Е |
1 5 ” |
51 |
о S |
|||
|
1. Increasing transport availability |
Density of general-purpose hard-surface highways, km of roadway per 1,000 km2 of territory |
130.0 |
216.4 |
423.0 |
274.6 |
Republic of Tatarstan, Vladimir Oblast |
|
2. Increasing level of education |
People with above-average education aged 15 and over per 1000 people who specified their level of education, people |
619.0 |
620.1 |
661.0 |
624.6 |
Kaluga Oblast, Arkhangelsk Oblast |
|
3. Increasing the volume of innovative goods and services |
Share of innovative goods, works, services in the total volume of goods shipped, works performed, service provided, % |
7.7 |
9.8 |
21.6 |
6.0 |
Vologda Oblast, Republic of Tatarstan |
|
4. Increasing the culture level |
Number of visits to museums per 1,000 people, people |
401.0 |
804.9 |
1487.0 |
601.3 |
Republic of Tatarstan, Vladimir Oblast |
|
5. Reducing crime rate |
Number of reported crimes per 100,000 people, units |
2209.0 |
1816.6 |
1019.0 |
1673.7 |
Kaluga Oblast, Tver Oblast |
|
6. Optimizing the settlement system |
Share of rural population in the total population, % |
24.4 |
24.3 |
28.0 |
29.8 |
Vologda Oblast, Ulyanovsk Oblast |
* Compiled from: Russian regions. Socio-economic indicators. 2016: statistics book. Rosstat. Moscow, 2016.
between it and the region under analysis, and analyzing the key success factors in the leading region.
Second, it has been found that the most efficient type of benchmarking, taking into account the prerequisites and reasons for achieving leadership by best economic actors, is “smart” benchmarking. “Smart” benchmarking of regional systems involves the elaboration of a development strategy based on comparing with territories with similar institutional conditions and development indicators. This aspect is the most important condition for achieving target indicators of any state development programs.
Third, it has been empirically proved that identifying territorial development priorities should be carried out through consistent double comparison of the region under analysis with the average national indicators and indicators
of identical regions. This conclusion has been confirmed by the results obtained during the development of development priorities for Perm Krai.
The presented method of the benchmarking procedure can make a significant contribution to the process of development, implementation and monitoring of innovative strategies for territories’ development through identifying the weak points and competitive advantages of the region.
We believe that the development and improvement of the regional benchmarking procedure in relation to Russia’s constituent entities requires further research and is of scientific interest in terms of creating an interactive tool that would combine regions’ statistical data and identify structurally similar Russian regions in order to develop an innovative national economy.
References “Smart” benchmarking as a basis for strategic planning in regional development
- Enright M.J. Why Clusters are the Way to Win the Game? Word Link, 1992, no. 5, July/August, pp. 24-25.
- Belomestnov V.G. Aktual’nye problemy sovremennoi ekonomiki: monografiya . Ulan-Ude: Izd-vo VSGUTU, 2015. P. 49.
- Rodionov P.V. Possibilities and limitations of modernization of Russian economy. Nauka i biznes: puti razvitiya=Science and business: ways of development, 2011, no. 6, pp. 250-255..
- Aslanova S.Kh., Topsakhalova F.M.-G. Strategic management of socio-economic development at the regional level. Fundamental’nye issledovaniya=Fundamental research, 2015, no. 2-11, p. 2393..
- Lapygin D.Yu. Problems of strategic management by region. Region: gosudarstvennoe i munitsipal’noe upravlenie=Region: public and municipal administration, 2015, no. 2 (2), pp. 7, 12..
- Rokhchin V.E., Dalgatova A.E. Strategicheskoe upravlenie razvitiem ekonomiki v predelakh federal’nykh okrugov Rossiiskoi Federatsii. Teoreticheskie i metodologicheskie aspekty . Saint Petersburg: SPbGEU, 2013. P. 100.
- Avezov A. Kh., Azimova M. Strategic management of sustainable economic development in a region. Vestnik Tadzhikskogo gosudarstvennogo universiteta prava, biznesa i politiki=Bulletin of Tajik State University of Law, Business and Politics. Series: Social Studies, 2015, no.1 (1), pp. 32..
- Lipina S.A. Development priorities in the North Caucasian republics. Regional’naya ekonomika: teoriya i praktika=Regional economics: theory and practice, 2008, no. 16 (73), pp. 18..
- Tikhomirov S.A. Innovative area of regional development. Innovatsii=Innovations, 2005, no. 7, pp. 33..
- Manicad G. Priority Setting in Agricultural Research: A brief conceptual background. Biotechnology and development monitor, 1997, no. 31, p. 13.
- Janssen W. Regional approach to setting research priorities and implementation: towards satisfying national, regional and global concerns. Journal of agricultural & food information, 2004, vol. 5, no. 2, p. 75.
- Bykova A.A. Issledovanie uslovii formirovaniya i funktsionirovaniya regional’nykh innovatsionno-promyshlennykh klasterov. Upravlenie klasterami v regional’noi ekonomike . Novocherkassk: UPTs «Nabla» YuRGTU (NPI), 2010, pp. 148-168..
- Islamov M.A., Bakhitova R.Kh., Kireeva R.A. Cluster analysis as a basis for benchmarking in Russia’s constituent entities. Naukovedenie=Science studies, 2014, issue 3. Available at: http://naukovedenie.ru/PDF/79EVN314.pdf (accessed: 15.11.2017)..
- Moskovkin V.M., Krymskii I.A. Regional benchmarking in Russia’s innovation structure. Innovatsii=Innovations, 2008, no.5, pp. 76-83..
- Rastvortseva S.N., Larionova M.V. Benchmarking of the regional innovation infrastructure. Natsional’nye interesy: prioritety i bezopasnost’=National interests: priorities and security, 2015, no. 22 (307), pp. 13-27..
- Chervyakov S.S. Strategicheskoe razvitie regionov na osnove benchmarkinga i upravleniya konfliktom interesov tselevykh auditorii: avtoref. dis.. kand. ekon. nauk . Vladimir: ANO VPO "Vladimirskii institut biznesa", 2012. 24 p.
- Krasnosel’skaya D.Kh. Upravlenie nakopleniem kapitala regiona na osnove primeneniya instrumentariya prostranstvennogo benchmarkinga: dis. … d-ra ekon. nauk . Ufa: Institut sotsial’no-ekonomicheskikh issledovanii, 2015. 162 p.
- Groenendijk N. EU and OECD Benchmarking and Peer Review Compared. The EU and Federalism: Polities and Policies Compared. Ashgate, 2010, pp. 181-202.
- Iurcovich L., Komninos N., Reid A., Heydebreck P., Pierrakis Y. Mutual Learning Platform: Regional Benchmarking Report: Blueprint for Regional Innovation Benchmarking. Brussels: European Commission, 2006. 36 p.
- Koellreuter S. Regional Benchmarking as a tool to improve regional foresight. European Commission-Research DG -Directorate K, April 2002, p. 14.
- Navarro J., Smart J.P. Specialisation benchmarking and assessment: pilot study on wind energy. Available at: http://publications.jrc.ec.europa.eu/repository/bitstream/JRC106035/2017_03_09_wind_pilot_regions_final.pdf
- Navarro M., Gibaja J.J., Franco S., Murciego A., Gianelle C., Hegyi F.M., Kleibrink A. Regional benchmarking in the smart specialisation process: Identification of reference regions based on structural similarity. S3 Working Paper Series, 2014, no. 03, pp. 9-10.
- Navarro M., Gibaja J.J., Franco S., Murciego A. Territorial benchmarking methodology: The need to identify reference regions. Available at: http://www.academia.edu/26363206/Territorial_benchmarking_methodology_The_need_to_identify_reference_regions
- Nauwelaers C., Veugelers R., Van Looy B. Benchmarking National R&D policies in Europe: Lessons from Belgium. Available at: http://www.stis.belspo.be/docs/papers/pdf/Nauwelaers.pdf
- Tomlinson M., Lundvall B.-A. Policy learning through benchmarking national systems of competence building and innovation -learning by comparing. Available at: http://www.academia.edu/24150494/Policy_learning_through_benchmarking_national_systems_of_competence_building_and_innovation-learning_by_comparing
- Smart Specialisation Platform. Finding reference regions based on structural similarities. Available at: http://s3platform.jrc.ec.europa.eu/regional-benchmarking
- Pozdeev D. Benchmarking of financial indicators. Finansovyi director=Chief financial officer, 2005. Available at: https://fd.ru/articles/13660-benchmarking-finansovyh-pokazateley (accessed: 15.11.2017)..
- Al’khimenko O.N. Investment in intellectual capital: the role of education. Ekonomika obrazovaniya=Economics of education, 2015, no.1, p. 58..
- Vasyutchenko I.N. The system of the region export potential estimation index. Regional’naya ekonomika: teoriya i praktika=Regional economics: theory and practice, 2010, no.21, p. 42..
- Young people in Perm are willing to immigrate to Canada and South Korea. Perm State University. Available at: http://www.psu.ru/news/permskaya-molodezh-gotova-emigrirovat-v-kanadu-i-yuzhnuyu-koreyu (Accessed: 10.11.2017)..
- Lyadova A.A. System of population settlement in Perm Krai: regional and logistics analysis. Geograficheskii Vestnik=Geographical bulletin, 2007, no. 1-2, p. 52..
