Social aspects of modernization in Russia's regions

Author: Lastochkina Mariya Aleksandrovna, Shabunova Aleksandra Anatolevna
Journal: Economic and Social Changes: Facts, Trends, Forecast @volnc-esc-en
Section: Social development
Article in issue: 6 (36) т.7, 2014.
Free access
Modernization is a long process that is going on unevenly in the world and in every country, and especially in Russia taking into account its vast territory and national diversity. Moreover, very acute issues that our country has to face include its lagging behind developed countries by 2-4 times in terms of the standard of living, and profound interregional differences. Each subject of the Russian Federation has its own degree of socio-economic development and, consequently, its own level of modernization. This article aims to outline some important social aspects of territories' development on the background of modernization change. The authors try to show the specifics of change in the trends in health, education, and financial situation on the basis of a comprehensive analysis of statistical and sociological data. The authors conclude that modernization in Russia's regions should be considered not only as an achievement of the highest international standard in economic and technological fields, but also as an updating of the society in thesocio-cultural and spiritual perspective.
Modernization, quality of life, population health, mortality, inequality
Short address: https://sciup.org/147223663
IDR: 147223663 | UDC: 316.42 | DOI: 10.15838/esc/2014.6.36.9
Text of the scientific article Social aspects of modernization in Russia's regions
Development of Russia’s regions and their involvement in modernization processes is increasingly becoming one of the leading aspects of contemporary social cognition of the society. At that, scientists study not only the changes of socioeconomic indicators, but also innovation, investment potential, quality of life, civic engagement, and specifics of sociocultural modernization of the territory. Modernization is global in nature and it is a priority for those regions and countries that seek to accelerate economic development, because improvement, progressiveness and innovation are important driving forces of growth.
Experts identify three components of modernization process: industrial, information-cognitive and socio-cultural [4].
The industrial component involves industrial development as the new basis of the economy (where a large part of the country’s GDP is produced); it forms the first stage of modernization as a comprehensive civilizational process. The informational-cognitive component represents the transition to information society based on knowledge (that is the main source of GDP growth), and forms the second stage of modernization, which is qualitatively new. The socio-cultural component is an integral part of each stage of modernization, aimed at personal development, which is facilitated by the functioning of social institutions and structures.
Promoting the country’s international competitiveness and improving the quality of life are the main criteria that ensure modernization success in the country. Naturally, these tasks are interrelated and implemented currently with the help of effective socio-economic administration, and innovation development in all spheres of society.
Russia faces especially acute issues such as the 2–4-fold gap in the standard of living compared to developed countries, and also profound interregional differences. Each region has its own degree of socio-economic development and, accordingly, its own degree of modernization.
The comparison of Russia’s regions by the degree of their modernization is important and meaningful. Such research is carried out according to the methodology developed at the China Center for Modernization Research (He Chuanqi [9]) and adapted to the Russian regional statistics (Center for the Study of Social and Cultural Change at the Institute of Philosophy, the Russian Academy of Sciences, N.I. Lapin).
Modernization can be primary and secondary according to the theory of division of global modernization. Primary modernization is associated with the industrial era of civilizational process, and secondary modernization – with the information era, or the era of knowledge. Integrated modernization represents the coordinated development of primary and secondary modernization.
A scoring model has been designed for each stage of modernization; the model includes a specific set of indicators and their standard values. Evaluation results are final indices and values of each stage of modernization. We have assessed the indices using the specialized information-analytical system “Modernization” developed at ISEDT RAS (http://mod. .
Russia’s regions can be arranged into three groups according to the index level of secondary modernization (SM) (tab. 1) . The highest level of modernization is observed in the largest cities – Moscow and Saint Petersburg, in several regions of Siberia with developed mining and manufacturing industries, and in the regions that have major cities or are adjacent to them. The lowest level of modernization is typical of mainly agricultural regions and territories belonging to the Southern and North-Caucasian federal districts.
The period under review is characterized by positive dynamics of the secondary modernization index: for example, its level was low in 45 regions in 2000, and in 2012 it was low in only two regions – the Republic of Ingushetia and the Chechen Republic. More and more areas (92% in 2012) are shifting to the median level of secondary modernization; the group with the high level of development has increased over the 12 years from one region to three. It should be noted that the process of regional modernization in the country is uneven, and we can observe the apparent asynchrony in the development of geographically close areas. A telling example is Saint Petersburg that has outstripped the Leningrad Oblast by 31 percentage points according to the SM index, and Moscow that is ahead of the Moscow Oblast (by 26 percentage points).
Among the four groups of the SM index the situation is less favorable concerning the sub-index of economy quality and knowledge innovation (the average subindices for the Russian Federation are 52%, tab. 2 ). The sub-indices of the quality of life and knowledge dissemination lack 7–9 percentage points to reach the level of developed countries.
In the framework of the objectives set out in the article, let us examine in more detail the sub-index of the quality of life, the value of which has increased by 9 percentage points for 2000–2012. Analyzing its composition, we note that the calculation of the level of modernization takes into account socio-demographic characteristics. The indicator “life expectancy” (LE) has the lowest value, it is 70.2 years on average for Russia, which is 10 years lower than that in developed countries. The increase in the average life expectancy observed in the country since 2003 has raised the bar for more than 5 years. We think that it is connected to a great extent with the successful implementation of the national project “Health” and the “Concept for demographic development...”. The total funding of healthcare has increased almost six times for more than ten years. Considerable investments in this area have produced important results: Russia managed to increase life expectancy and birth rate, and to reduce mortality and infant mortality.
Life expectancy is a complex indicator that characterizes the health status and quality of life of the population. Mortality in early age and mortality in working-age population is crucial in the calculation of LE. The most common causes of death are cardiovascular diseases (53.5% of all deaths in 2013), the state of affairs in this respect in the Russian Federation can be considered as catastrophic; neoplasms (15.6%) and external causes (9.9%).
The WHO points out that according to the level of premature (i.e. before the age of 64 years) mortality from the circulatory system pathologies (206.9 cases per 100 thousand population) Russia is among
Table 1. Dynamics of the constituent entities of the Russian Federation according to the level of the secondary modernization index, 2000–2012
|
Level (SM index) |
RF constituent entities |
|
|
2000 |
2012 |
|
|
Low (31–51) |
Republic of Adygea, Republic of Bashkortostan Republic of Buryatia, Altai Republic, Republic of Dagestan, Republic of Ingushetia, Kabardino-Balkar Republic, Republic of Kalmykia, Karachay-Cherkess Republic, Republic of Karelia, Republic of Mordovia, Republic of Tuva, Udmurt Republic, Republic of Khakassia, Chechen Republic, Chuvash Republic, Altai Krai, Krasnodar Krai, Stavropol Krai, Khabarovsk Krai, Amur Oblast, Arkhangelsk Oblast, Astrakhan Oblast, Belgorod Oblast, Bryansk Oblast, Volgograd Oblast, Vologda Oblast, Ivanovo Oblast, Kemerovo Oblast, Kirov Oblast, Kostroma Oblast, Kurgan Oblast, Kursk Oblast, Lipetsk Oblast, Novgorod Oblast, Orenburg Oblast, Orel Oblast, Pskov Oblast, Ryazan Oblast, Sakhalin Oblast, Smolensk Oblast, Tambov Oblast, Zabaykalsky Krai, Jewish Autonomous Oblast, Chukotka Autonomous Okrug, Southern Federal District, North-Caucasian Federal District, Far-Eastern Federal District |
Republic of Ingushetia, Chechen Republic |
|
Median (52–80) |
Komi Republic, Mari El Republic, Republic of Sakha (Yakutia), Republic of North Ossetia-Alania, Republic of Tatarstan, Krasnoyarsk Krai, Primorsky Krai, Vladimir Oblast, Voronezh Oblast, Irkutsk Oblast, Kaliningrad Oblast, Kaluga Oblast, Kamchatka Krai, Leningrad Oblast, Magadan Oblast, Moscow Oblast, Murmansk Oblast, Nizhny Novgorod Oblast, Novosibirsk Oblast, Omsk Oblast, Penza Oblast, Perm Krai, Rostov Oblast, Samara Oblast, Saratov Oblast, Sverdlovsk Oblast, Tver Oblast, Tomsk Oblast, Tula Oblast, Tyumen Oblast, Ulyanovsk Oblast, Chelyabinsk Oblast, Yaroslavl Oblast, Saint Petersburg, Nenets Autonomous Okrug, Khanty-Mansi Autonomous Okrug – Yugra, Yamalo-Nenets Autonomous Okrug, Central Federal District, Northwestern Federal District, Volga Federal District, Siberian Federal District, Urals Federal District, Russia |
Republic of Adygea, Republic of Bashkortostan Republic of Buryatia, Altai Republic, Republic of Dagestan, Kabardino-Balkar Republic, Republic of Kalmykia, Karachay-Cherkess Republic, Republic of Karelia, Komi Republic, Mari El Republic, Republic of Mordovia, Republic of Sakha (Yakutia), Republic of North Ossetia-Alania, Republic of Tatarstan, Republic of Tuva, Udmurt Republic, Republic of Khakassia, Chuvash Republic, Altai Krai, Krasnodar Krai, Krasnoyarsk Krai, Primorsky Krai, Stavropol Krai, Khabarovsk Krai, Amur Oblast, Arkhangelsk Oblast, Astrakhan Oblast, Belgorod Oblast, Bryansk Oblast, Vladimir Oblast, Volgograd Oblast, Vologda Oblast, Voronezh Oblast, Ivanovo Oblast, Irkutsk Oblast, Kaliningrad Oblast, Kaluga Oblast, Kamchatka Krai, Kemerovo Oblast, Kirov Oblast, Kostroma Oblast, Kurgan Oblast, Kursk Oblast, Leningrad Oblast, Lipetsk Oblast, Magadan Oblast, Murmansk Oblast, Novgorod Oblast, Novosibirsk Oblast, Omsk Oblast, Orenburg Oblast, Orel Oblast, Penza Oblast, Perm Krai, Pskov Oblast, Rostov Oblast, Ryazan Oblast, Samara Oblast, Saratov Oblast, Sakhalin Oblast, Sverdlovsk Oblast, Smolensk Oblast, Tambov Oblast, Tver Oblast, Tomsk Oblast, Tula Oblast, Tyumen Oblast, Ulyanovsk Oblast, Chelyabinsk Oblast, Zabaykalsky Krai, Yaroslavl Oblast, Jewish Autonomous Oblast, Nenets Autonomous Okrug, Khanty-Mansi Autonomous Okrug – Yugra, Chukotka Autonomous Okrug, Yamalo-Nenets Autonomous Okrug, Southern Federal District, North-Caucasian Federal District, Volga Federal District, Siberian Federal District, Urals Federal District, Far-Eastern Federal District, Russia |
|
High (81–120) |
Moscow |
Moscow Oblast, Moscow, Saint Petersburg, Central Federal District |
|
Sources: the table was compiled with the use of the Information-analytical system for monitoring the parameters of modernization of Russia’s regions (IS “Modernization”, patent No. 2012661285, 2012), in accordance with the methodological developments of the Center for the Study of Social and Cultural Change at the Institute of Philosophy, the Russian Academy of Sciences. |
||
Table 2. Dynamics of the secondary modernization index (sub-indices) in the Russian Federation, 2000–2012
|
Indicator |
2000 |
2012 |
||||
|
Value |
Standard |
Index |
Value |
Standard |
Index |
|
|
Gross domestic product (GDP) per capita, U.S.dollars |
1660 |
27680 |
6 |
11204.8 |
38811.2 |
28.905 |
|
GDP per capita at purchasing power parity (PPP), U.S.dollars |
8010 |
27770 |
28.8 |
19048.2 |
37322 |
51.0 |
|
Share of value added of financial sector in GDP, % |
38 |
32 |
84.2 |
43.8 |
25.5 |
58.2 |
|
Share of those employed in financial sector in total employment, % |
38 |
30 |
78.9 |
37.5 |
25.9 |
69.1 |
|
Sub-index of the quality of economy |
49.5 |
51.8 |
||||
|
Share of expenditures on R&D in GDP, % |
1.1 |
2.3 |
47.8 |
1 |
2.4 |
41. 7 |
|
Number of scientists and engineers per 10 thousand people |
34 |
33.4 |
101.8 |
30 |
39.8 |
75.4 |
|
Number of residents who filed patent applications, per 1 million people |
138 |
790 |
17.5 |
294 |
745 |
39.5 |
|
Knowledge innovation sub-index |
55.7 |
52.2 |
||||
|
Share of urban population in the total population, % |
73 |
79 |
92,4 |
74 |
80 |
92,5 |
|
Number of doctors per 1000 people |
4.2 |
2.9 |
120 |
4,9 |
2,8 |
120 |
|
Infant mortality (aged under 12 months) per 1,000 live births |
15 |
6 |
40 |
8,6 |
5,1 |
59,3 |
|
Life expectancy, years |
65 |
78 |
83.3 |
70.2 |
80 |
88 |
|
Energy efficiency: GDP per capita / cost of energy consumption per capita, times |
4121 |
5448 |
75.6 |
4943 |
4999.2 |
98.9 |
|
Sub-index of the quality of life |
82.3 |
91.7 |
||||
|
Proportion of students attending higher education establishments among the population aged 18–22, % |
41 |
60 |
68.3 |
76 |
72.1 |
104 |
|
Proportion of students attending secondary vocational education establishments among the population aged 12–17, % |
95 |
100 |
95 |
88.6 |
100 |
84 |
|
Number of TV-sets per 100 households |
124 |
189 |
65.6 |
174 |
160 |
108.7 |
|
Number of personal computers per 100 households |
6 |
85 |
7.1 |
86 |
117 |
73.5 |
|
Knowledge dissemination sub-index |
59.0 |
92.6 |
||||
|
Secondary modernization index |
61.6 |
72.4 |
||||
Note. SM index is the arithmetic average of SM sub-indices. Index values are rounded to 120 (according to the methodology).
Sources: the table was compiled with the use of the Information-analytical system for monitoring the parameters of modernization of Russia’s regions (IS “Modernization”, patent No. 2012661285, 2012), in accordance with the methodological developments of the Center for the Study of Social and Cultural Change at the Institute of Philosophy, the Russian Academy of Sciences.
the most disadvantaged countries along with Kazakhstan (208.8), Belarus (191.3) and Ukraine (176.8). The lowest values of mortality from cardiovascular diseases are observed in developed countries: Finland – 44.5, Germany – 35.7, the UK – 35.6, the Netherlands – 26; this is 4–8 times less than in Russia [11].
Infant mortality is another important indicator involved in the calculation of the SM index; despite the fact that infant mortality has reduced almost twice in recent years, its level is still significantly higher than in developed countries (in 1.7 times). The Russian Federation ranks 160th, next to Chile and Kuwait in the list of 224 countries by this indicator in 2014 (7.08 deaths in those aged under 12 months per one thousand live births). Positive trends in the health of children aged under 12 months began after 2006 as a result of implementation of the priority national project “Health”.
However, the achieved results are still worse than those achieved in 1990: for instance, 34% of children in 2012 (2 times more than in 1990) were born ill or fell ill in the first week of their life. According to the research [2] carried out in different regions of Russia, children’s health is complex in nature and includes many factors (social environment, maternal health, nutrition, housing conditions and so on) that can be changed and require immediate intervention on the part of the society and the state.
Their effectiveness largely determines the health and lives of the younger generation, and, consequently, the future of Russia. In addition, children’s health is especially important if we take into account significant population decline.
Demographic trends in the European region (depopulation, population ageing, the increase of dependency ratio) and in Russia are somewhat similar, but in our country the situation is complicated by the lag in economic and social development. We emphasize that contemporary modernization is possible only when people recognize the importance of demographic issues and the necessity to preserve human capital (number of population and its health, education, the ratio of age and employment categories).
The advance of modernization under these conditions is a rather difficult task; its implementation requires labor resources, which in Russia, according to forecasts, will be limited over the next 20 years (and, most likely, afterwards). Therefore, the country needs a science-intensive high-tech development model, the necessary condition for which is the high level of human capital, education and sociocultural development.
The vectors of innovation development of the world economy reduce to the fact that the highly qualified and educated personnel is playing an increasingly significant role. Russia should have a smoothly functioning model of social mobility; and education is one of its important mechanisms. Due to the presence of state-funded places in higher education institutions, gifted children can obtain good education; but then, in practice, those who have “connections” or money get a privileged position and a prestigious job. With the establishment of fee-based higher education those young people that have a low level of knowledge are not flunked out, and the means of social mobility have become chargeable; consequently, almost
Table 3. Intensity of social mobility in the NWFD population depending on financial situation (for the last 5 years; in % of the number of respondents)
|
Mobility indicator |
Population groups |
||
|
The prosperous and the rich |
The well-off |
The poor and the extremely poor |
|
|
General mobility coefficient |
46.7 |
35.4 |
36.9 |
|
Upward mobility indicator |
43.8 |
26.0 |
16.2 |
|
Downward mobility indicator |
2.9 |
9.4 |
56.1 |
|
Exchange mobility indicator |
5.7 |
-5.6 |
76.8 |
Source: Data of the sociological survey carried out by ISEDT RAS in 2013 in the NWFD regions.
anyone can pay money and enroll in a university and, as a result, the effectiveness of this social channel has decreased significantly.
This is evidenced by the data of sociological studies conducted in 2013 in the NWFD regions1. The intensity of the mobility of the rich and the prosperous is much higher than in other population groups (tab. 3) . The intensive upward social mobility takes place mainly in the group of the most well-off (44%). The upward social mobility coefficient is the lowest in the group of the poor and the extremely poor (16%). The coefficients of downward social mobility have the opposite trend – the higher the income of the population, the lower the rate of downward mobility [7].
Downward mobility in the group of the poor is 56%. The exchange mobility indicator demonstrates the degree of openness of the group – the indicator is lower if the group is more closed and the access to this group is difficult [1].
This indicator in the groups of the most well-off is minimal, which indicates the difficulty of access to these groups. The high exchange mobility of the group of the poor (77%) indicates its openness. The research results show that the population with low incomes and a low social status has virtually no opportunities to raise their social status, because even the level of education does not promote the means of social mobility, given the fact that its role is performed by “connections” and money.
The analysis carried out in the study reveals the relationship between social mobility and the level of modernization in the territories. Social mobility is higher in those regions where the level of modernization is higher, which, in our opinion, can accelerate the process of modernization. In turn, there also exists the opposite effect.
The comparison of the data on the level of modernization and the level of socioeconomic inequality allow us to argue that at present Russia is characterized by the upward trend in the development of both of these processes. Following the Kuznets law [10] and analyzing the dynamics of the observed trends, we can conclude that the regions of the Russian Federation are moving along the path that brings them to the point A (fig. 1).
The Kuznets curve has been a subject of many arguments on the part of the scientific community, which attempted to verify or refute it. Although S. Kuznets described the processes of “capitalist modernization”, this law is implemented at present as well, in the era of neo-industrialization. This is proved by the comparison of data on the indices of modernization degree in the territories and on the extent of socioeconomic inequality (fig. 2). The regions that have a high level of modernization also have higher R/P 10% ratio (the ratio of the average income of the richest 10% to the
Figure 1. Kuznets curve
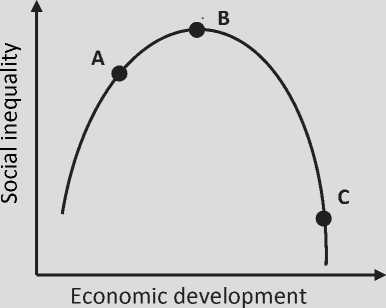
Figure 2. Dynamics of the secondary modernization index (SMI) and R/P 10% ratio in the regions of the Russian Federation for 2000–2012
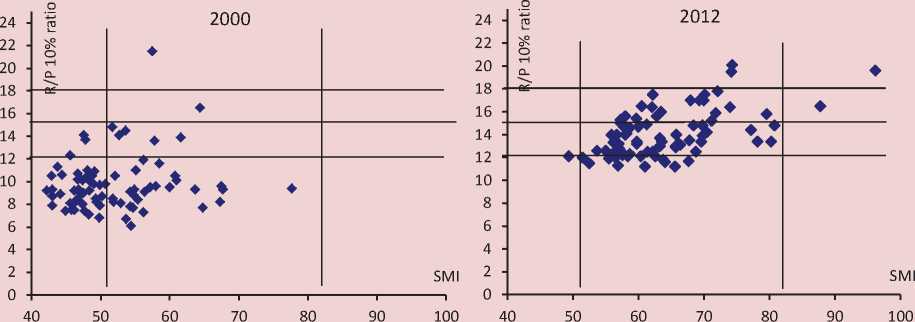
poorest 10%) characterizing the income inequality of the population. For the analyzed period there has been a thickening of the dispersion area of territories, so the zone has become more concentrated.
The RF constituent entities such as Krasnodar Krai, the Republic of Buryatia, the Sverdlovsk Oblast, Krasnoyarsk Krai, the Komi Republic, the Irkutsk Oblast, and the Republic of Bashkortostan are characterized by the most pronounced mismatch between the level of modernization and the degree of inequality.
In these regions the increase in welfare and, accordingly, the increase in the degree of inequality is going on more actively than in other regions. The opposite trends such as the gap between the growth of people’s welfare and the activity of modernization processes is most pronounced in the Tula, Tomsk, Murmansk, Nizhny Novgorod and Magadan oblasts.
The highest indicators of the level of modernization and population differentiation are typical of the central regions that have a developed financial sector, and of the territories with efficient mining industry (Moscow and Saint Petersburg, the Moscow, Leningrad, Tyumen, Sverdlovsk and some other oblasts). The groups with the high level of modernization and the low or median level of socioeconomic inequality are not numerous (five regions) [6].
According to the Kuznets law, the increase in social inequality in the RF regions along with the further growth of socio-economic development should be followed by a decrease (the curve after point B; see fig. 1). In 1997, when forecasting the dynamics of the differentiation coefficient, A.E. Faerman and A.M. Terent’ev [8]
concluded that the ratio would be 9.89 in 2000, 10.94 in 2010, 11.67 in 2015, and 12.03 in 2020. The trend of increasing the level of inequality stated in the forecast is correct; however, it happened faster than expected: in 2012 the ratio of differentiation was already 16.4. The forecast estimates of the time of occurrence of the reduction in inequality provide a basis for double conclusions.
On the one hand, at the current rate of inequality growth, such a transition is to occur by 2030–2035, but taking into account the financial crises which affect the economy, there can be a substantial progress.
On the other hand, when making forecast estimates, it is necessary to take into account that it will not occur spontaneously. Both the state and the civil society must make maximum efforts to reduce (eliminate completely) the corrupt business strategies.
Positive shifts are possible if the growth of labor incomes is based on the increase of economic activity of the population, as well as modernization and productivity increase in the most labor-intensive industries (that are less profitable, as a consequence).
The implementation of these steps, as well as the movement toward modernization, requires political will and efficient public administration. The government (national, regional, municipal) that admits the necessity to carry out modernization should carry out a forward-looking policy and implement institutional reforms aimed not only to develop innovations and a new technological structure, but also to improve the quality of life and the standard of living, and to reduce disparities that will allow people to implement their potential to the fullest extent.
However, it is necessary to emphasize that this is a very difficult task, taking into account that the unity of Russian society is weakened almost to the point of antagonism in the relationship between the authorities and the society, and alienation of social layers from each other, which contact neither on the social level, nor on the level of everyday interaction [5].
At the same time, social solidarity is the main force that unites the society and that is able to create a new quality of social environment.
Therefore, modernization in Russia’s regions should be considered not only as an achievement of the highest international standard in economic and technological fields, but also as an upgrading of the society in the socio-cultural and spiritual perspective.
References Social aspects of modernization in Russia's regions
- Bulanova M.A. Sotsial'naya mobil'nost' rabotayushchei molodezhi regiona: sotsiologicheskii analiz . Vlast' i upravlenie na Vostoke Rossii , 2011, no. 3, pp. 205-212.
- Kislitsyna O.A. Zdorov'e detei -bogatstvo natsii: tendentsii, faktory riska, strategii sberezheniya . Moscow: MAKS Press, 2011. 268 p.
- Kondakova N.A. Zdorov'e i usloviya zhizni podrastayushchego pokoleniya . Ekonomicheskie i sotsial'nye peremeny: fakty, tendentsii, prognoz , 2013, no. 1, pp. 151-161.
- Lapin N.I. Izmerenie modernizatsii rossiiskikh regionov i sotsikul'turnye faktory ee strategii . Sotsiologicheskie issledovaniya , 2012, no. 9, pp. 4-24.
- Problemy sotsiokul'turnoi modernizatsii regionov Rossii . Compiled and edited by N.I. Lapin, L.A. Belyaeva. Moscow: Academia, 2013. P. 45.
- Rossoshanskii A.I., Belekhova G.V. Blagosostoyanie naseleniya kak pokazatel' modernizatsionnogo razvitiya potentsiala territorii . Ekonomicheskie i sotsial'nye peremeny: fakty, tendentsii, prognoz , 2014, no. 5 (35), pp. 260-275.
- Solov'eva T.S., Shabunova A.A. Srednii klass v regionakh SZFO: vozmozhnosti rasshirennogo vosproizvodstva . Ekonomicheskie i sotsial'nye peremeny: fakty, tendentsii, prognoz , 2014, no. 4 (34), pp. 113-129.
- Faerman E.Yu., Terent'ev A.M., Vasil'ev I.A. Differentsiatsiya dokhodov, sberezhenii, neproizvodstvennogo potrebleniya v perekhodnom periode . Moscow: TsEMI RAN, 1997.
- He Chuanqi. Obzornyi doklad o modernizatsii v mire i Kitae (2001-2010) . Translated from English under general editorship of N.I. Lapin; foreword by N.I. Lapin, G.A. Tosunyan. Moscow: Ves' Mir, 2011. 256 p.
- Kuznets S. Economic Growth of Nations: Total Output and Production Structure, 1971.
- World Health Statistics. World Health Organization, 2014. 180 p.
