Social demand of Russians for innovation (according to a sample survey)
")
Author: Arkhipova Marina Yu., Kuchmaeva Oksana V.
Journal: Economic and Social Changes: Facts, Trends, Forecast @volnc-esc-en
Section: Innovation development
Article in issue: 2 (56) т.11, 2018.
Free access
This article was supported by the Russian Foundation for the Humanities under the grant “Innovations in modern Russia: development trends and impact on the standard of living of the population” (project 16-02-00561).The population’s choice of values in the use of digital technologies depends on a whole range of factors, including economic, political, social, cultural, and psychological ones. Is the attitude of the respondents to the innovation-driven changes in their lives the same? If it is so, then what factors determine the choice of a particular behavioral pattern in terms of using innovative products and services? This article provides the data of a survey designed to analyze the social characteristics of respondents depending on their attitude to innovative products. The results of a sample survey carried out by the authors in the spring of 2017 in Moscow and the Moscow Oblast were used as an information basis. The surveyed sample comprised 1,115 individuals aged 15 to 86 years, including 55.5% of women and 44.5% of men, which generally corresponds to the age and gender structure of the population in the regions surveyed...
Innovation, society development, social demand, population survey, classification tree, innovative behavior
Short address: https://sciup.org/147224046
IDR: 147224046 | UDC: 311.3/.4, | DOI: 10.15838/esc.2018.2.56.5
Text of the scientific article Social demand of Russians for innovation (according to a sample survey)
The rapid growth of modern technology and the resulting development of digital economy open up new opportunities for individuals, nations, corporations and the business environment as a whole; they also contribute to economic growth, improve the quality of life of large groups of the population, and accelerate information flows, which dramatically affects the way of life, etc. Nevertheless, there emerge new challenges and threats to the development of society. The usual living environment of people is changing, the labor market is transforming and social relations are changing. Information becomes not just a means of production, but also influences people’s worldview and becomes a powerful tool of political influence. The ongoing changes affect not only the foundations of society; they also have an impact on each individual. Innovation, on the one hand, increases people’s capabilities and raises their standard of living; on the other hand, inequality is aggravating, which results in asymmetric access to modern information technology for different strata of the population.
Differentiation by the number and quality of innovative services available to people grows into an imbalance in the opportunities for the realization of professional and personal potential.
Despite the presence of a large number of publications devoted to the role of innovation in modern society, there are not enough works devoted to the quantitative assessment of the extent of dissemination of innovation technology in society and its impact on the quality and way of life. The ongoing changes in society have not been sufficiently studied and require timely analysis using adequate tools, and the development of new statistical tools, as well.
Our study aims to eliminate the lack of quantitative data that allow us to confirm the hypotheses about the impact of innovation on the way and quality of life of Russians, to identify the factors that determine the need for innovation, and to determine the most promising areas in which innovation can be used, from the point of view of the population.
The results obtained in the course of the study will help understand innovation-based transformation in Russia and assess the needs and the degree of satisfaction of Russians with regard to innovative goods and services.
The results of the study will help determine the prospects for innovation development in Russia in connection with the development of the needs of society and the demand from its population for innovative products and services.
The impact of innovation technology on the standard of living as reflected in modern research
Innovation is the subject of a wide range of studies, but in most cases they deal only with the economic efficiency of dissemination of innovations and their role in economic development of countries. It should be noted that innovation radically changes the image of everyday life; this phenomenon is the subject of discourse in many cultural studies.
Giovany Cajaiba-Santana [1, pp. 42-51] considers social innovation as “social change that it generates”. The paper argues that the first distinctive feature of this type of innovation is novelty and the second one is targeted social result. Dawson and Daniel study social innovation in the context of improving collective well-being [2]. The concept of quality of life is an integral part of social innovation. The social impact of social innovation refers to meeting the needs at the micro-level, enhancing human capacities and improving the standard of living of individuals together with sustainable development of society as a whole.
The impact of innovation and various kinds of technology on the way of life and standard of living is possible only with the adoption of new technologies and innovations by consumers. There are many theories of public dissemination and adoption of innovation by people. Modeling and forecasting the spread of innovation has become popular since the 1960s, when the first works on this topic were published.
A number of works are devoted to the relationship between science, technology and innovation, identifying its role as an engine of economic development and social welfare. Quite a few works are devoted to the study of the impact of ICT on global development and development in individual countries [3; 4, pp. 117-129; 5, pp. 27-35; 6, pp. 1271-1282]. R.D. Atkinson and D.D. Castro in their monograph [7, pp. 1-14] give arguments about how IT-technology affects the development of the world population. The paper also describes the basic principles that public policy should follow in order to stimulate the “digital” standard of living. The analytical reviews and articles consider some aspects of the development of new forms of employment under the influence of information and communication technology and ICT competence as a driver of socioeconomic development in Russia (for example, [8]). A separate area of research is related to identifying the specifics of innovative behavior of Russian enterprises [9].
Abby Joseph Cohen in the article “Innovation and economic growth” [10] uses statistics to prove the impact of innovation on the standard of living and the economy of the U.S. It is also confirmed that scientific and technological achievements stimulate the emergence of new products and inventions. From the point of view of the author, the main tasks for improving the standard of living are as follows: increase in expenditures on the development of innovation technology, increase in the number of people with higher education, and the development of industrial parks.
Among Russian researchers who study the quality of life we can name S.A. Ayvazyan, N.M. Rimashevskaya V. Kossova, T. Yakovets and others. S.A. Ayvazyan [11] proposes an integral indicator, which is a modified first component of the various categories of this indicator that are in turn formed by convolution of statistically-recorded indicators using principal components method. This technique helps make inter-regional comparisons of the standard of living and quality of life, explore the possibilities of regional growth and assess the change in the indicator over time. V. Kossov [12] developed a methodology for assessing the quality of life in the regions of the Russian Federation over time. Thus, according to this methodology, the resulting indicators for negative and positive processes in the region are formed, and their dynamics (growth rates) allow us to judge about the dynamics of the quality of life. The works of N.M. Rimashevskaya [see, for example, 13, 14], T.Yu. Yakovets [15], and others made a significant contribution to the study of the problems of quality of life and social orientation of the economy and a significant impact thereon.
In [16], its authors describe twelve facts of innovation development, which, in their opinion, affect different spheres of life in the U.S. For example, innovation increases life expectancy, makes technology more accessible, and allows people to spend more time with their family and on hobbies.
A special place in the research belongs to the problem of the impact of innovation on demographic processes, in particular on mortality, morbidity and life expectancy [17; 18, pp. 2388-98; 19, pp. 1-34; 20, pp. 871904]. The relationship between innovation and social development, the indicators which were measured on the basis of the Global Innovation
Index (GII) and Human Development Index (HDI) for 108 countries, was explained with the help of a logistic curve in the work of M. Arkhipova and V. Sirotin [21]. So far, there are not enough empirical studies of the relationship of these areas for Russia. However, it was found that the assessments of the standard of living in the country, both objective (based on HDI) and subjective, largely depend on the main indicators of scientific and innovative activity [22, pp. 45-53].
Since 2009, the Institute for Statistical Studies and Economics of Knowledge of the National Research University – Higher School of Economics has been conducting surveys related to innovation climate and innovation behavior 1 . The monitoring of people’s innovation behavior touches upon some issues of how Russian society perceives innovation, and the issues of dissemination of innovative practices in households. The research suggests that the development of tools to stimulate user innovation promotes people’s involvement in innovation processes, significantly raises the quality of products and services and expands new and traditional markets [23, pp. 16-32]. On the one hand, people’s consumer behavior remains quite stable, despite the increase in the prevalence of various technologies in everyday life [24, pp. 32-37]. However, along with this, there is one peculiar feature in the behavior of Russians: some users that create an innovation and use it in their households do not seek to commercialize their innovations, which is why their ideas remain virtually untouched [25, pp. 392-402].
The ongoing social monitoring studies, when analyzing the quality of life and respect for the rights, touch upon the necessity of taking into account the accessibility of modern information technology [26, pp. 38-52]. This aspect is paid attention particularly in the monitoring of the situation of children in countries around the world and in respecting the rights set forth in the Convention on the Rights of the Child [27, pp. 507-520].
We should also note the report “Mismeasuring Our Lives: Why GDP Doesn’t Add Up” by J. Stiglitz and others [28], which makes recommendations on measuring some economic indicators. The work continues the discourse that it is incorrect to measure the standard of living and quality of life on the basis of general economic indicators. In particular, it is recommended that the material well-being of people be measured by income and consumption indicators rather than by GDP and other production indicators. It also gives preference to the approach to statistical analysis from the viewpoint of population and households rather than producers of goods and services. The report recommends measuring the quality of life on the basis of objective conditions and abilities of people, and it expresses dissatisfaction with the current system of indicators that are used for assessing the security of society, the density of social ties and the political sphere of life of the country. In addition, the extent of social inequality should be taken into account as fully as possible.
A review of the research allows us to make a conclusion that innovation and various kinds of new technology will not impact the way and quality of life if new technologies and innovations are not adopted by consumers themselves. A more objective assessment can be made if the socio-economic and socio-psychological characteristics are taken into account in the course of the analysis.
Formation of the sample and its descriptive analysis
In May–June 2017, a sample survey was conducted among households of Moscow and the Moscow Oblast within the framework of the grant entitled “Innovation activity in modern Russia: development trends and impact on the standard of living” (Project 16-02-00561) and supported by the Russian Foundation for Basic Research. The aim of the study was to analyze the prevalence of the use of innovative goods and services in the daily life of households and the impact of these processes on the quality of life. The sample consisted of 1,115 persons 15–86 years of age, among them women comprised 55.5% and men – 44.5%, which generally corresponded to the sex and age composition of those regions. The limiting sampling error by sex was 2.7%. The structure of the respondents is represented by residents of different settlements. The share of respondents permanently residing in the Moscow region amounted to 51.9%, 17.8% of respondents permanently live in a large city (over one million inhabitants), 22.7% are residents of a medium-sized city (from one hundred to one million inhabitants), 5.5% live in a small town, and 1.0% live in a village. The limiting sampling error by settlement type does not exceed 3.5%.
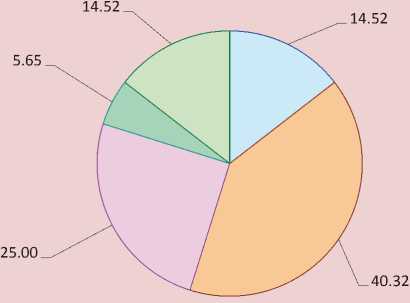
Distribution of respondents by age (Fig. 1) indicates the prevalence of youth aged 21–39. It is followed by respondents aged 31–40. Respondents aged 41–59 were the smallest group represented in the sample.
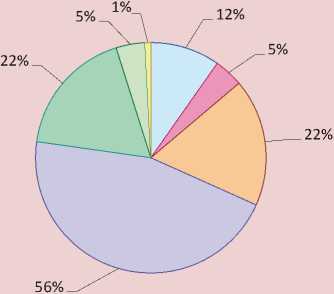
Various socio-demographic groups are represented among the respondents. Most of the respondents have higher education (specialty), a master’s or bachelor’s degree (Fig. 2) .
-
Figure 1. Distribution of respondents by age, %
-
□ under 20
-
□ 21-30
-
□ 31-40
-
□ 41-50
-
□ 51 and older
-
Source: our own compilation based on the survey data.
-
Figure 2. Distribution of respondents by level of education, %
-
1- general secondary
-
2- secondary vocational
-
3- higher - bachelor's degree
-
4- higher - specialty
-
5- higher - master's degree
-
6- academic degree (candidate of sciences)
-
7- academic degree (doctor of sciences)
Source: our own compilation based on the survey data.
Having studied the distribution of respondents by areas of employment, we see that most of them work in industry, energy, transport and construction, about 25% of respondents are engaged in trade and in the housing and utilities sector, i.e. in the areas in which new information technologies and services are actively introduced. The smallest proportion of respondents work in agriculture, the army, and law enforcement agencies (Fig. 3).
Among the respondents, 52.9% earn their living and 40.9% are dependent on the family and relatives (to a large extent, these are minors and students), the rest are pensioners and recipients of social benefits.
-
Figure 3. Distribution of respondents by areas of employment, %
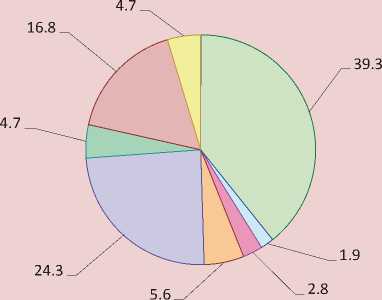
□ indusrty, energy, transport, construction,
□ agriculture
■ army, lawenforcementagencies
□ state or municipal administration
□ wholesaleand retail trade, housingand utilities
□ education, healthcare, science, culture
□ finance, credit, insurance, marketing, advisory services
□ other
Source: our own compilation based on the survey data.
The fact that among the respondents there are mainly people with higher education affects their financial situation (Tab. 1) . Thus, most respondents rated the financial position of their family as “good” or “average” (78.9%).
Among the characteristics that reflect the lifestyle of modern Russians, it is worth noting the fact that Russians are quite mobile. Only 38% of respondents never changed their place of residence, and 5.2% move to a new place of residence every 2–3 years.
Among the respondents, 68.8% are positive about innovations and try to use them in everyday life. Only 5.5% described their attitude to innovation as negative, saying that “I try to use the old proven products and services” (the rest described their attitude to innovation with the words “with caution”). Almost half (49.7%) of respondents monitor the emergence and development of new products or services.
The results of the survey indicate that the majority of respondents have experience in the use of innovative products and services. Although the prevalence of various innovations in their daily life is significantly different. Most often Russians noted the experience of using different gadgets (more than 3/4 of respondents). Quite often the respondents use various “smart” devices and energy-saving
Table 1. Distribution of answers to the question: “How would you assess the current financial (economic) situation of your family?”, percentage of respondents
|
Answer |
Proportion of respondents, % |
|
Very good |
10.7 |
|
Good |
30.5 |
|
Average |
48.4 |
|
Poor |
7.5 |
|
Very poor |
1.0 |
|
It’s difficult to answer |
1.9 |
|
Source: our own compilation based on the survey data. |
|
Table 2. Experience in the use of innovative products, percentage of respondents
The absolute leadership among innovative services belongs to the Internet, primarily as a way to find the necessary information (76.9%). Social media rank second in popularity and importance (69.2%); they are followed by various mobile applications, including public services website, e-ticketing, online educational services, online tour booking, and distance employment. All these innovations are connected with the global Internet network. The situation is somewhat different concerning vending machines and medical services. It is interesting to note that 17.5% of Russians used the possibilities of distance employment (Tab. 3).
At the same time, 53.8% answered positively to the question: “Has any innovative product had a significant impact on your life or lifestyle?”. Answering the question in free form, Russians pointed out primarily the Internet, home computer, various gadgets and mobile communication.
The answers to the question “What spheres of life in society, in your opinion, need innovations most of all?” show that society is most interested in the dissemination of innovations in education and healthcare (Tab. 4) . Russians also consider it necessary to
Table 3. Experience in the use of innovative services, percentage of respondents
|
Innovative service |
Percentage of respondents who used the services |
|
Internet – to find the necessary information |
76.9 |
|
Social media |
69.2 |
|
Mobile applications |
61.0 |
|
Public services website |
60.1 |
|
E-ticketing |
56.2 |
|
Vending machines |
40.3 |
|
Online educational services |
31.8 |
|
Online tour booking |
29.5 |
|
Medical services |
19.5 |
|
Distance employment |
17.5 |
|
Other |
0.6 |
|
Source: our own compilation based on the survey data. |
|
Table 4. Distribution of answers to the question: “What spheres of life in society, in your opinion, need innovations most of all?”, percentage of respondents
The answers to the questions in free form allowed us to make a certain rating of the most significant innovations of the last decades. They include 3D printer, GPS-navigator, pay-pass, Wi-Fi, Wikipedia, nuclear power, drones, gadgets, pocket computers, Ipad, electric vehicles, remote employment, immunotherapy in oncology, online stores, social media, medical devices for complex operations, online services, e-books, and electronic payments. The choice of items for this list was influenced by the experience of using certain technologies in everyday life, their prevalence and the desire to solve existing problems through the use of modern technologies.
Respondents also answered a question about what innovations or innovative services they would like to see in the near future. Among them: a magnet with only one magnetic pole; a miniature heart that would not be rejected by the body; 3D printing of organs; automation of public services; a car that could be filled with water; proximity bank cards; unmanned vehicles; silent transport; more active use of secondary raw materials; the ability to remotely receive treatment via the Internet; cultivation and transplantation of organs; a new high-speed mode of transport; remedy for incurable diseases; time machine; instant delivery of goods; mobile applications for improving pronunciation in the study of foreign languages; nano-cleaners; robothelpers at home; alternative fuels in addition to existing ones; teleporter; a universal remedy; environmentally friendly means of public transport.
It is obvious that the vast majority of innovations on this list that can be used in the life of an ordinary person, and improve the quality of life.
Identifying the factors that influence innovative activity of respondents
When segmenting the market of innovative products and services, it is of great interest to identify groups of respondents who are most open to innovative practices. It can be done with the help of classification trees.
When creating decision trees, we used the variable “What is your attitude toward innovation?” as the target one (69.1% of respondents are positive about innovations and strive to use them in everyday life).
Initially, we selected several variables as predictors that, according to our views, have an impact on the attitude of respondents to innovation and will allow us to form separate socio-demographic groups of respondents. The variables are as follows: sex, age, level of education, field of activity, experience in the use of various innovative products and services (presented in Tab. 2, 3), attention to innovation (“Do you pay attention to the emergence and development of new products or services?”; “What field of activity, in your opinion, lacks innovation?”– presented in Tab. 4). However, the final models included only the following independent variables: age, the use of educational online services, and attention to innovation. Thus, the hypothesis of the influence of a number of factors on the attitude toward innovation has not been confirmed.
Table 5 presents a description of the variables used to create a classification tree
After the analysis, we chose the models obtained with the help of the CHAID method. Among all the possible variants of constructing decision trees we chose two that describe the available data most accurately. The best predictor for the target variable “What is your attitude toward innovation?” included variables such as “the use of online education services” and “the attitude toward the emergence of new products or services”.
Both of the trees we created consist of three levels and contain three terminal nodes. The root node includes 307 observations, of which 212 observations correspond to respondents who are positive about innovation, 78 observations – to those who treat them “with caution”, and 17 – to those whose attitude is “negative”.
We should note that the non-numerical nature of the information obtained as a result of the sociological survey imposed certain restrictions on the tools we used. However, the analysis of the results led to the conclusion that the selected models could be used to answer the questions. So, by using cross-validation to assess the application of the classification tree
Table 5. Predictors selected to create a classification tree
Figure 4 presents the first of the trees that we created, which is the best among the models built.
Risk assessment is 0.167 (with a 5% significance level, the model error ranges from
15 to 17%). The acceptable quality of the model is evidenced by a fairly high percentage of respondents classified correctly. Thus, according to our model, 83.3% of respondents were assigned to one of the selected groups correctly.
The first group included respondents with experience in the use of educational online services, among them the share of positive attitude toward innovation is 86.7%. Among those who have not used online education in the recent past, we highlight two groups depending on age. Among those under 30 years of age, 73.3% of respondents were positive about innovation, and among those aged over 30, this figure is 45.2%.
Figure 4. Classification tree designed to identify attitudes toward innovation taking into account the experience of using educational online services
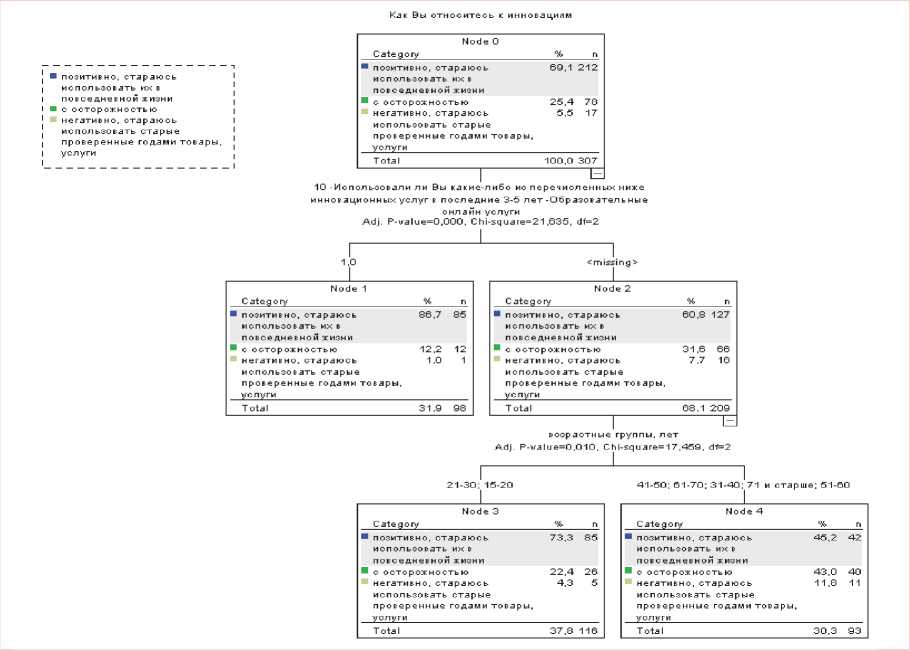
Source: our own compilation based on the survey data.
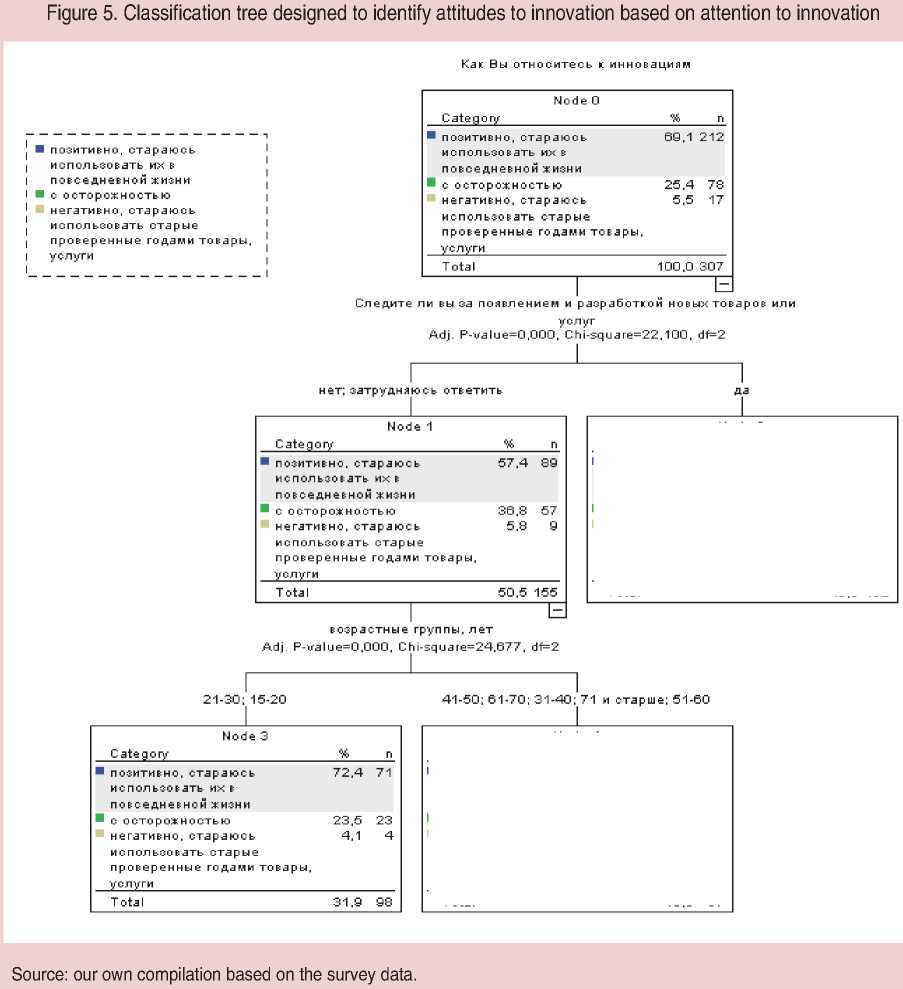
Risk assessment for the second classification tree is higher – 0.257, i.e. 74.3% of observations were classified correctly (Fig. 5). If we do not take into account the experience of using online education services, the main predictor for identifying respondents’ attitude toward innovation is their interest in the use of innovation and their awareness of new types of innovative products and services. That is, those respondents who actively monitor the spread of innovations, have a positive attitude toward them (among them the share of those whose attitude toward innovations is positive and who seek to use them in everyday life is 80.9%).
Among those who are not interested in innovation (do not pay attention to the emergence of new goods or services) the attitude to innovation depends on the age:
|
Node 2 |
||
|
Category |
% |
п |
|
■ позитивно, стараюсь |
80,9 |
123 |
|
ИСПОЛЬЗОВаТЬ их в |
||
|
повседневной жизни |
||
|
■ о осторожностью |
13,8 |
21 |
|
■ негативно, стараюсь |
5.3 |
8 |
|
и с п о л ьзо в ать ста р ы е |
||
|
проверенные годами товары, |
||
|
■услуги |
||
|
Total |
49,5 |
152 |
|
N о d е 4 С ate g о гу |
% |
Pi |
|
|
■ |
п о з и т и в н о, с т а р а ю о ь использовать их в п о в с е д н е в н о й ж изн и |
31,5 |
■18 |
|
■ |
с осторожностью |
59,6 |
34 |
|
н е гати в н о, ста р а ю с ь и о п о л ьзо в ать от а р ы е проверенные годами товары, услуги |
8,8 |
5 |
|
|
Total |
18,5 |
57 |
among younger respondents (under 30 years of age) the share of positive attitudes toward innovation is 72.4%; among persons older than 30 years – 31.6%. Among adults who are not interested in innovation there are many more of those who treat innovation with caution (59.6%).
The results suggest that among the variety of social and economic characteristics it is difficult to distinguish those that clearly affect the attitude of Russians toward innovation.
It can be said that a generally positive attitude toward innovations and the willingness to use them in everyday life is determined by a person’s age, availability of experience in the use of modern technologies in educational process and attention to innovations, which depends on many social, psychological and cultural factors. Attempts to build classification trees, taking into account such parameters as the sphere of activity, level of education, place of residence, standard of living, and human mobility as predictors of attitude toward innovations (often considered among the set of factors forming the attitude toward innovations) were unsuccessful. In modern Russian conditions, there is a situation when the attitude toward innovation is determined largely by psychological features of respondents, and their willingness to accept innovation. Age as an important predictor begins to play its role if a person is not too receptive to innovation: among the respondents who are quite indifferent to innovation, the young age begins to play a role.
We cannot but note the role of education in shaping attitudes toward innovation. The distribution of educational online services at various levels of education, from pre-school to lifelong learning, and the presence of experience of their use creates a positive attitude toward innovation in general, and assures people of their usefulness in everyday life.
Conclusion
In general, the results of the study have shown that modern Russians are very receptive to innovation, which is accompanied by a sufficiently high level of mobility. Two third of respondents are positive about innovations and try to use them in everyday life, about the same number of respondents have repeatedly changed their place of residence during their lives.
The vast majority of respondents already have significant experience of using innovations in their daily life, they show interest toward emerging innovations, which allows them to determine the desired (according to the respondents) prospects for the development of innovative technologies that can affect their way and quality of life.
The study has shown that young respondents are interested in obtaining the work related to the use of modern ICT technologies and development of innovative technologies, even if it is not related to the improvement of their financial situation. This emphasizes the role that innovation plays in shaping not only the standard of living, but also the way of life of Russians.
Russians clearly understand the extent to which various innovative goods and services are already represented in their lives; here we mean various gadgets and “smart appliances” in everyday life, the role of the Internet in providing remote employment and education, various types of services, and electric cars. At the same time, respondents identify a wide range of innovative products and services, the appearance of which (or their dissemination) they would like to see and use in practice in the near future. In most cases, these innovations are associated with the spread of Internet technologies and medicine, as well as the development of means of transport, and environmental protection. To a large extent, Russians hope that innovations can help solve existing everyday problems, including those related to health, lack of time, and communication.
In order to highlight the factors that have a decisive impact on respondents’ use of innovation and new technologies we used methods based on the construction of classification trees. As a result, we have shown that 86.7% of respondents whose attitude toward innovations is positive are those with positive experience in using online educational services. The next important factor is respondents’ interest in the use of innovations and their awareness of the emergence of new types of innovative goods and services.
Among those who are not interested in innovation the attitude toward innovation depends to a certain extent on a person’s age: in this case, among the younger respondents (under 30 years of age) the share of those whose attitude toward innovation is positive is 72.4%, while among those older than 30 years this share is 31.6%.
Due to the difficulty of identifying the factors that identify unambiguously the attitude toward innovations and toward their dissemination we can say it is necessary to find ways in which modeling can use qualitative variables reflecting socio-psychological and cultural characteristics of respondents; it is also necessary to develop new integrated indicators and use statistical modeling techniques and dimensionality reduction in this regard.
The implementation of the state strategy aimed to increase the demand for innovative technologies among various socio-demographic groups should take into account the role of the education sector and the specifics of the attitude of the older people toward innovative goods and services. This will require the development of special techniques, training programs, and social advertising.
References Social demand of Russians for innovation (according to a sample survey)
- Cajaiba-Santana G. Social innovation: moving the field forward. A conceptual framework. Technological Forecasting and Social Change, 2014, vol. 82, pr. 42-51.
- Dawson P., Daniel L. Understanding social innovation: a provisional framework. International Journal of Technology Management, 2010, no 51 (1), pp. 9-12. Available at: http://www.inderscience.com/info/inarticle.php?artid=33125.
- Abdrakhmanova G.I., Kovaleva G.G., Kotsemir M.N. Russia in the ICT development rating. Informatsionnyi byulleten’=Newsletter, 2016, no. 2 (7)..
- Arkhipova M.Yu., Khavanskov V.A. Informational-statistical monitoring of inventive activity of RAS on the basis of patent information resources. Ekonomicheskaya nauka sovremennoi Rossii=Economics of Contemporary Russia, 2012, no. 2 (57), pp. 117-129..
- Minochkin A.L. Digital divide in the modern political system: the nature and essence. Vestnik Saratovskogo gosudarstvennogo sotsial’no-ekonomicheskogo universiteta=Vestnik of Saratov State Socio-Economic University, 2013, no. 3, pp. 27-35..
- Mačiulytė-Šniukienė A., Gaile-Sarkane E. Impact of information and telecommunication technologies development on labour productivity. Social and Behavioral Sciences, 2013, vol. 110, pp. 1271-1282.
- Atkinson R.D., Castro D.D. Digital Quality of Life: Understanding the Personal and Social Benefits of the Information Technology Revolution. 2008.
- Shaposhnik S.B. Human capital as a factor of the information society development in the CIS countries. Informatsionnoe obshchestvo=Information Society, 2016, no. 4-5, pp. 72-80..
- Gokhberg L.M. (Ed.). Gracheva G.A., Kuznetsova T.E., Rud’ V.A., Suslov A.B. Innovatsionnoe povedenie rossiiskikh predpriyatii . Moscow: NIU VShE, 2012.
- Cohen A.J. Innovation and economic growth. Available at: http://www.progressivepolicy.org/.
- Aivazyan S.A. Analiz kachestva i obraza zhizni naseleniya. Ekonometricheskii podkhod . Moscow: Nauka, 2012. 432 p.
- Kossov V.V. Dynamics of the quality of life in constituent entities of the Russian Federation and the focus of social policy. Mir Rossii=Universe of Russia, 2001, no. 2..
- Rimashevskaya N.M. Health of the Russian population in the conditions of socio-economic modernization. Narodonaselenie=Population, 2015, no. 4, pp. 33-42..
- Rimashevskaya N.M. Gendernye stereotipy v menyayushchemsya obshchestve: opyt kompleksnogo sotsial’nogo issledovaniya . Moscow: Nauka, 2009. 273 p.
- Yakovets T.Yu. Demographic problems of forecasting and modeling of global sustainable development. Partnerstvo tsivilizatsi=Partnership of Civilizations, 2013, no. 3, pp. 220-225..
- Greenstone M., Looney A. A Dozen Economic Facts about Innovation. POLICY MEMO. 2011. Available at:: https://www.brookings.edu/wp-content/uploads/2016/06/08_innovation_greenstone_looney.pdf
- Lichtenberg F.R. Pharmaceutical Innovation and Longevity Growth in 30 Developing and High-income Countries, 2000-2009. NBER Working Papers 18235, National Bureau of Economic Research, Inc. 2012.
- Ford E.S. et al. Explaining the decrease in U.S. Deaths from coronary disease, 1980-2000. New England Journal of Medicine, 2007, vol. 356 (23), pp. 2388-2398.
- Lichtenberg F.R. The quality of medical care, behavioral risk factors, and longevity growth. International Journal of Health Care Finance and Economics, 2011, vol. 11 (1), pp. 1-34.
- Murphy K.M, Topel R.H. The value of health and longevity. Journal of Political Economy, 2006, vol. 114 (4), pp. 871-904.
- Arkhipova M., Sirotin V. Innovative Development and Quality of Life Interaction. Science, Technology and Innovation in the Emerging Markets Economy Proceedings of the 22th International Conference on Management of Technology (IAMOT 2013), Brazil, Porto Alegre, 2013.
- Arkhipova M.Yu. Innovation and the standard of living: a study of their relationship and main development trends. Voprosy statistiki=Statistics Issues, 2013, no. 4, pp. 45-53..
- Zaitseva A.S., Shuvalova O.R. Changing emphases in innovation activity: user innovation. Forsait=Foresight, 2011, no. 2, pp. 16-32..
- Chernovich E., Miles I.D., Polyakova V. Household technology and the sustainability of consumer behavior in Moscow. Sustainability, 2015, vol. 8 (1), pp. 32-37.
- Fursov K., Thurner T. Make it work! -A study of user-innovation in Russia. Science and Public Policy, 2017, vol. 44 (3), pp. 392-402.
- Shuvalova O.R. Indicators of innovation climate in Russia (results of mass population surveys). Forsait=Foresight, 2010, no. 1, pp. 38-52..
- Kalabikhina I.E., Kuchmaeva O.V. The challenges and future prospects for monitoring children’s participation within the context of the "National strategy for action in the interests of children 2012-2017". Zhurnal issledovanii sotsial’noi politiki=The Journal of Social Policy Studies, 2016, no. 4, pp. 507-520..
- Stiglitz J., Sen A. Fitoussi J.-P. Neverno otsenivaya nashu zhizn’. Pochemu VVP ne imeet smysla? Doklad Komissii po izmereniyu effektivnosti ekonomiki i sotsial’nogo progressa . Moscow: Institut Gaidara, 2016.
