Social well-being of the Belarusian youth: a sociological analysis

Author: Gilevskaya Ludmila Petrovna
Journal: Economic and Social Changes: Facts, Trends, Forecast @volnc-esc-en
Section: Social development
Article in issue: 2 (10) т.3, 2010.
Free access
The article considers the concept «social wellbeing» from the point of view of the theory and a technique of its sociological studying. Results of empirical research of social state of health of the Belarusyouth in comparison with other age groups are given. Conclusions concerning the social wellbeing of modern youth in the conditions of world financial and economic crisis are made.
Social well-being, youth, world economic crisis
Short address: https://sciup.org/147223182
IDR: 147223182 | UDC: 316.346.32-053.6(476)
Text of the scientific article Social well-being of the Belarusian youth: a sociological analysis
Year 2009 was the most difficult for the Vologda region in terms of bringing the regional budgets to the changing macroeconomic conditions. Against the background of other subjects of the North-West the region is one of the regions that reduced their budgets most of all. Income from revenue sources have decreased by 21% compared with 2008, including tax and non-tax payments – in 2 times. The level of budget deficit both as in 2009 and as projected to 2010 is the highest among the other regional budgets (tab. 1) . In response to falling revenue, the Government of the Russian Federation listed the Vologda region among the 17 most crisis regions.
A conservative forecast of basic macroeconomic indicators of regional economy, which underlies the formation of the regional budget for 2010 indicates that the budgetary problems of the region will grow (tab. 2) .
According to the Department of Economics of the Vologda region in 2010 it is projected a slight increase in GRP of 1.5% compared to 2009. Basic budget-forming figure – enterprises’ profit – will decline by 8%, and this will have a significant impact on fiscal performance. The dynamics of the main parameters of the regional budget approved for 2010, compared with their condition in 2009, is characterized by prolonged reduction of both income and expenditure in relation to pre-crisis period (tab. 3) .
Table 1. Revenues and deficit of the NWFD subjects’ regional budgets, %
|
Region |
Actual execution |
2010, plan |
|||
|
Revenues of 2008 to 2007 |
2009 |
Revenues by 2009 |
Deficit to own revenues |
||
|
Revenues by 2008 |
Deficit to own revenues |
||||
|
Vologda Region |
125.5 |
79.0 |
34.1 |
83.6 |
28.65 |
|
Murmansk Region |
113.2 |
97.0 |
7.9 |
81.6 |
24.3 |
|
Pskov Region |
125.4 |
113.4 |
8.9 |
95.6 |
22.3 |
|
Arkhangelsk Region |
134.0 |
94.8 |
28.7 |
86.6 |
16.0 |
|
Kaliningrad Region |
140.0 |
125.1 |
22.6 (surplus) |
67.9 |
14.7 |
|
Novgorod Region |
144.4 |
113.8 |
9.4 |
87.4 |
14.6 |
|
Republic of Karelia |
137.4 |
93.0 |
25.3 |
93.5 |
11.2 |
|
Republic of Komi |
130.0 |
103.4 |
5.5 |
84.7 |
7.7 |
|
St. Petersburg |
122.0 |
93.1 |
2.7 |
100.9 |
7.5 |
|
Leningrad Region |
125.2 |
97.1 |
9.8 |
89.2 |
3.7 |
|
NWFD |
123.8 |
95.9 |
6.45 |
93.5 |
10.3 |
Table 2. Main macroeconomic indicators for the draft of regional budget of the Vologda region (in% to previous year)
|
Indicators |
2008, fact |
2009, estimate |
Forecast to 2012 |
||
|
2010 |
2011 |
2012 |
|||
|
Gross regional product * |
96.1 |
86.0 |
101.5 |
102.6 |
103.3 |
|
Index of industrial production |
95.8 |
84.0 |
102.5 |
103.0 |
104.0 |
|
Profit of profitable enterprises |
122.7 |
22.7 |
92.0 |
150.0 |
126.0 |
|
including steel industry |
93.2 |
12.7 |
110.0 |
206.9 |
134.5 |
|
Investment in fixed assets |
91.2 |
70.5 |
92.7 |
104.4 |
109.3 |
|
Wage fund |
124.5 |
100.8 |
104.0 |
105.7 |
105.4 |
|
Real wages |
108.3 |
94.1 |
95.2 |
97.6 |
98.5 |
|
Consumer price index, annual average |
115.2 |
112.4 |
110.7 |
108.7 |
107.5 |
|
* In comparable prices. |
|||||
Table 3. Main parameters of the regional budget for the period 2005 – 2010
|
Indicators |
Factual figures |
Plan |
||||
|
2005 |
2006 |
2007 |
2008 |
2009 |
2010 |
|
|
Income, bil. roub. |
17.7 |
24.1 |
31.5 |
39.5 |
31.2 |
26.1 |
|
Costs, bil. roub. |
19.1 |
23.8 |
32.3 |
39.1 |
37.7 |
32.1 |
|
Deficit-, surplus + bil. roub. |
-1.4 |
+0.3 |
-0.8 |
+0.4 |
-6.5 |
-6.0 |
|
As % of revenue excluding grants income |
-9.0 |
+1.5 |
-2.9 |
+1.3 |
-34.0 |
-28.6 |
The table data again confirms that 2009 was a turning point of major trends in fiscal indicators – this year there was a cessation of longterm dynamics of revenues and expenditures growth of the regional budget. The deficit of the budget system reached a record level – 34% in ratio of tax and nontax revenues.
In 2010, the total resources of the regional budget, as compared with the 2009 contracted in nominal increase of 5 billion roubles. At the same time, the cost will have a tendency to limit, but remain at a fairly high level.
As a result, a substantial reduction in revenues while maintaining the planned scope of the state commitments the budget will be executed with a deficit with a slight fall compared with 2009, but it will be very significant – nearly 30% of own revenues.
The main reason for the significant deficit growth in 2009 – 2010 is a sharp decrease in
Figure 1. Dynamics of average annual export prices for ferrous metals (rub. per tonne), profits of metallurgy enterprises (bil. roub.), income tax (bil. roub.) in 2005 – 2010
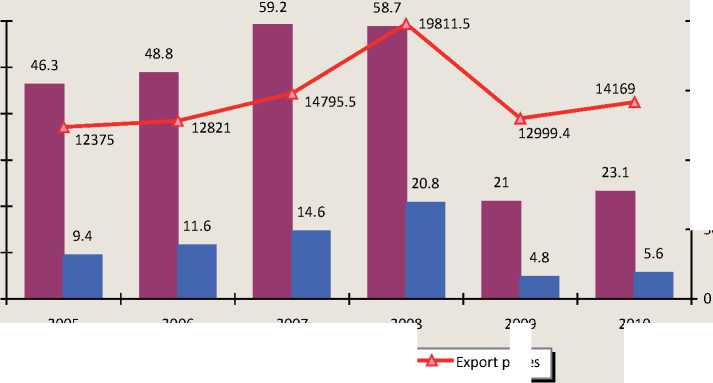
^™ Metallurgy profit ^™ Profit tax
Table 4. Tax revenues and duties of the regional budget in 2008 – 2010
In line with the forecast of the Ministry of Economic Development of Russia profit increase of the Vologda region’s metallurgy enterprises of 10% is expected in 2010 compared to 2009 [8]. Export prices in the market of ferrous metals, according to the financial group BCS analysts’ estimate will exceed level of quarter IV of 2009 by 4-5% [9]. However, one can hardly expect a substantial increase in fees for income tax since the overcoming of the economic crisis will still continue for some time and, hence, broadening the tax base for that particular payment will occur in the coming years too slowly.
Overall in 2010 the growth of almost all components of tax revenue, including income taxes by almost 17% is forecasted. At the same time the share of this payment in the total fiscal revenue will decline from 53% in 2008 to 21.5 in 2010% (tab. 4) .
Against the background of the loss of the tax revenue dominating role in the profit structure the burden of tax base formation will shift from businesses to individuals. Collecting income tax in 2010 would amount to one third of the regional treasury income. It should be noted that the funds of income tax on individuals in 2009 were more stable compared to the tax on profits and decreased only by 6%.
With regard to the indexation of excise charges on alcohol products excise tax revenues will increase by 18%, their share of income in the regional budget will increase significantly.
Despite the abolition of benefits for property of organizations engaged in investments in their own production facilities in 2010, in general, this set of measures will have no significant effect on the collection of property taxes from organizations – income tax on property and vehicle tax will rise by 6%. At the same time the shortfall in income from the regional budget conditioned by providing benefits for transportation tax is assessed in the amount of 38.7 million roubles.
Non-tax revenues are approved in the amount of 600 million rubles that is 72% of the 2009 level. Analysis of the structure of non-tax payments shows that in 2010, significant reduction of all their sources, except for income from regional property will take place (tab. 5) .
The sharp decline in regional budget’s own revenues, with the growth of social obligations and lack of opportunity for debt financing of the deficit, put the regional budget in terms of high dependence on transfers from the federal budget. In 2009 inter-budget transfers amount-
Table 5. Non-tax revenues of the regional budget in 2008 – 2010
|
Indicators |
Execution in 2008 mln. roub. |
Execution in 2009 |
Plan for 2010 |
||
|
mln. roub. |
2009 to 2008, % |
mln. roub. |
2010 to 2009, % |
||
|
Non-tax revenues, total |
811.1 |
740.0 |
91.2 |
600.0 |
81.1 |
|
Including: income from the use of property in state property |
206.1 |
140.4 |
68.1 |
251.1 |
178.8 |
|
payments for the use of natural resources |
320.6 |
292.3 |
91.2 |
181.3 |
62.0 |
|
income from services provision |
52.5 |
59.8 |
114.0 |
58.3 |
97.5 |
|
income from sale of assets |
33.6 |
66.8 |
198.5 |
54.4 |
81.4 |
|
fines, penalties |
11.3 |
14.2 |
125.4 |
7.6 |
53.5 |
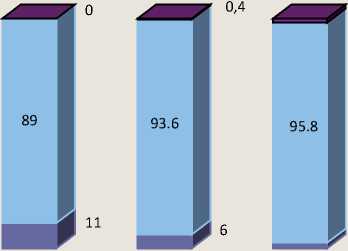
Figure 2. The share of inter-budget transfers and own revenues in the profitable part of the regional budget in 2005 – 2010, %
87 89.5 84.4 87.1
7.7 7.1 11 12.5 35.860.815.680
-
■ Inter-budget transfers ■ Regional budget’s own revenue
ed to almost 36% in the amount of income of the regional budget. In 2010, they will generate the revenue base of more than 15% (fig. 2) .
The current draft of the law on the regional budget, the inter-budget transfers are cut down almost 3 times compared to their amount in 2009. It is associated with the termination of co-financing from the federal budget of almost all subjects’ social powers. However, given that at the time of the federal budget approval a part of the transfer was not allocated by the regions, we can hope for their additional funding in the current fiscal year.
Formation of the regional budget’s items of expense was based on the following approaches.
Firstli, unconditional fulfillment of social obligations to citizens while increasing targeting of social assistance.
Secondly, provision of social budgetary subsidies to the municipalities, creation of conditions to maintain the efficiency of economic entities of the regional economy.
Thirdly, concentration of resources on the most significant events, costs optimization of the executive power bodies and budgetary institutions functioning, denial of low priority expenditures.
Turning to the expenditure side of the regional budget, it should be noted that a favorable external environment in recent years allowed the regional authorities to pursue a policy of increasing public expenditure and initiating an additional commitment to social support. As a result, the dynamics of cost increases outpaced the growth of GRP. In 2009 the value of the regional budget expenditures reached a record value for the recent years – 17.5% of GRP (tab. 6) .
In 2010, the volume of budget expenditures will decline by 3.7 percentage points with respect to the GRP. In nominal terms, expenditure of the budget is commensurate with its size in 2007. Dynamics of limitations of capacity costs budgeted for 2010, is reflecting as stated in the Budget Address of the President of Russia the policy of containment of public spending in times of crisis. Total cost reduction of the regional budget in 2010 compared to 2009 will make 5.6 billion roubles.
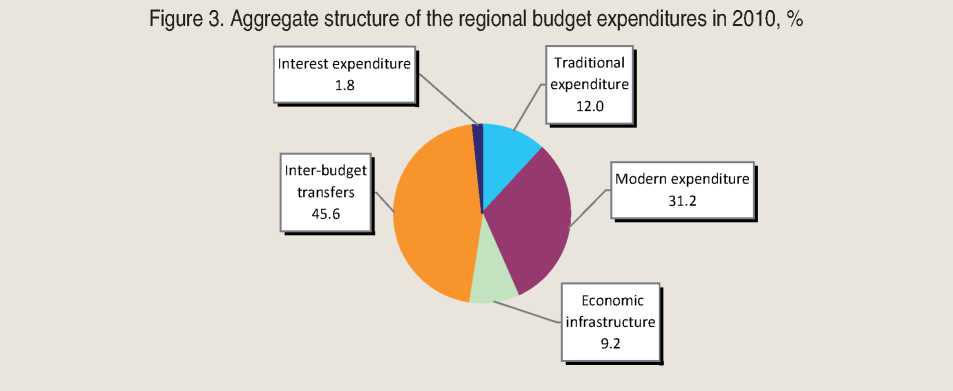
The main priorities of fiscal policy in 2010 are illustrated in figure 3 which shows the aggregate structure of the regional budget expenditure part.
In terms of spending budgetary allocations for inter-budget transfers to municipalities and state extra-budgetary funds take the first place accounting for more than 45% of the total. In this case the vast majority of inter-budget transfers have a social orientation.
The second priority area is the so-called modern expenditure, in other words the maintenance of the social sphere, the various forms of social support, constituting a third of budget expenditure.
A considerable share of 12% is given to the traditional costs of providing public functions (the maintenance of government bodies, the judiciary, security and law bodies).
Slightly more than 9% of funding is expected to extend to state support for economic infrastructure – the individual sectors of the economy, housing and communal services and environmental protection.
Almost 2% of the expenditure part of the regional budget will be used to service debt obligations.
Thus, two thirds of the approved budget allocations for 2010 are clearly social in nature.
Table 6. Dynamics of the regional budget expenditures for 2005 – 2010
|
Indicators |
Actual execution |
Plan |
||||
|
2005 |
2006 |
2007 |
2008 |
2009 |
2010 |
|
|
Expenditures, bil. roub. |
19.1 |
23.8 |
32.3 |
39.1 |
37.7 |
32.1 |
|
As % of GDP |
9.8 |
11.4 |
13.2 |
13.2 |
17.5 |
13.8 |
|
As % to previous year |
117.9 |
124.8 |
135.7 |
121.1 |
96.5 |
85.0 |
|
GRP, % to previous year |
101.3 |
107.2 |
117.4 |
121.8 |
72.1 |
104.8 |
Table 7. Dynamics of change of the regional budget expenditures structure for 2008 – 2010
|
Sections of budget classification |
Actual execution |
Plan |
||||
|
2008 |
2009 |
2010 |
||||
|
mln. roub. |
share, % |
mln. roub. |
share, % |
mln. roub. |
share, % |
|
|
Expenditures, total |
39086.5 |
100.0 |
37743.3 |
100.0 |
32074.5 |
100.0 |
|
Including: General government issues |
1912.3 |
4.9 |
1984.4 |
5.3 |
1698.0 |
5.3 |
|
Including national debt service |
0 |
0 |
161.1 |
0.4 |
581.4 |
1.8 |
|
National security and law enforcement |
2453.2 |
6.3 |
2198.4 |
5.8 |
2124.0 |
6.6 |
|
National economy |
7232.7 |
18.5 |
6251.7 |
16.5 |
2640.5 |
8.2 |
|
Housing and communal services |
178.0 |
0.5 |
686.0 |
1.8 |
184.4 |
0.6 |
|
Environmental protection |
165.1 |
0.4 |
139.3 |
0.4 |
115.1 |
0.4 |
|
Education |
2330.6 |
6.0 |
2160.3 |
5.7 |
2057.8 |
6.4 |
|
Culture, media |
1018.5 |
2.6 |
655.7 |
1.7 |
682.8 |
2.1 |
|
Health care, physical culture and sports |
2492.6 |
6.4 |
2551.8 |
6.8 |
2210.0 |
6.9 |
|
Social policy |
4101.2 |
10.5 |
5109.2 |
13.5 |
5048.7 |
15.7 |
|
Inter-budget transfers |
17168.9 |
43.9 |
16001.3 |
42.4 |
14622.7 |
45.6 |
To get more information about the main trends in the area of expenditure commitments we consider the composition of the functional structure of the expenditure part of the regional budget in 2010 and compare it with the structure of expenditures in previous years (tab. 7) .
Amid the general expenditures decline the most noticeable changes are associated with reduction in funding of domestic industries, as well as rising costs for social policy and interbudget transfers.
State support of the national economy relative to 2008 – 2009 will decrease 3 and 2.4 times respectively. In the branch-wise perspective there will be reduction of cost of all units of the regional economy financed from the regional budget (tab. 8) .
Spending on agriculture are approved in the amount of 800 million roub., which is twice lower than the 2009 level. Share of costs of this vital industry for the region will amount to just 2.5% of the regional treasury expenditure which is incomparable with any financial year of the last decade (in 2001 – 2003 agriculture was funded by 8% of the financing, in 2004 – 2009 – 4.5%).
Public support for forestry will be cut almost by one-third. Given that this industry was financed by 80 – 90% from federal transfers, it is anticipated that there will be additional subsidies to the exercise of the powers of the Russian Federation in the field of forest relations in the course of budget execution.
Table 8. The regional budget expenditures of the item “National Economy” in 2008 – 2010
|
Name of the subsection |
Actual execution |
Plan for 2010 |
||||||
|
2008 |
2009 |
2010 |
||||||
|
mln. roub. |
share, % |
mln. roub. |
share, % |
as % to 2008 |
mln. roub. |
share, % |
as % to 2009 |
|
|
Agriculture |
2388.5 |
6.0 |
1730.1 |
4.6 |
36.5 |
803.7 |
2.5 |
46.5 |
|
Forestry |
471.7 |
1.2 |
474.7 |
1.3 |
100.6 |
331.7 |
1.0 |
69.9 |
|
Transportation |
77.2 |
0.2 |
68.2 |
0.2 |
88.3 |
53.5 |
0.2 |
78.4 |
|
Traffic management |
3225.8 |
8.2 |
1939.6 |
5.1 |
60.1 |
820.9 |
2.6 |
42.3 |
The most significant reduction in fiscal costs will be on the industry “Traffic Management”. The volume of financial flows to the infrastructure development will reduced 2.4 times in comparison with 2009 and 4 times in comparison with 2008. The main cause for this decline was the need for the regional budget’s priority expenditures provision by reducing more than half the funding for roads maintenance. In addition, some portion of appropriations under the co-financing from the federal budget to implement the federal target program “Development of the Russian transport system” was subjected to reducing. In our view, such a restriction of federal subsidies is not fully justified, since the modernization of the transport system has high social significance for the maintenance of the regions’ territorial and economic space unity. One should also consider that the commitment to implement the major road projects are large enough and cannot be fully funded by regional budgets.
This year 22 billion roubles or 68.6% of regional budget expenditures will be used for the maintenance of the social sphere, including intergovernmental transfers to municipalities. Despite a nominal decrease in costs, their share in total budget expenditures will increase by 7 percentage points (tab. 9) .
Table 9. The regional budget expenditures for the maintenance of social sphere in 2008 – 2010
|
Indicators |
Actual execution |
Plan |
|
|
2008 |
2009 |
2010 |
|
|
Expenditures, bil. roub. |
21.5 |
23.2 |
22.0 |
|
As % to previous year |
103.7 |
108.1 |
94.7 |
|
Share of budget expenditures, % |
55.0 |
61.5 |
68.6 |
Figure 4. The structure of the regional budget expenditures on social services in 2010, %
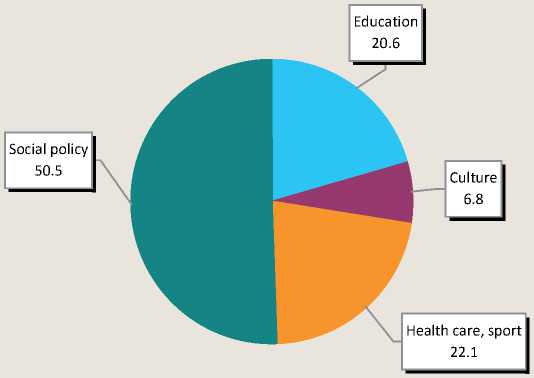
The main part of budgetary allocations for social sector is composed by the costs of activities in the field of social welfare and social services for citizens - for this purpose it is intended to send more than 50% of social costs. The second branchwise priority is the costs for health care and sports – 22%. Slightly less will be used for educational activities – 20.6%. About 7% would amount to expenditure on culture and the media (fig. 4) .
The high proportion of expenditure on social policy is due primarily to the need to increase them during the crisis period to support the most vulnerable population groups. In addition, there is a growing need for funding for the employment program, unemployment benefits payment. Finally, public regulatory obligations, constituting about 40% in the cost structure of the industry should be undoubtedly met.
It should be recognized that funds provided by the regional budget will help keep the entire existing system of social support for veterans, students, orphans, disabled, large families and low income families. Regardless of the economic situation the obligation to pay wages to workers of budgetary sphere will be saved in corpore. At the same time allocations for the maintenance of the existing fiscal network are formed with a view to optimize costs, without which it was impossible to balance the budget for the current year. The total cost reduction, such as payments for telecommunication services, transport services, rent for property use, increase in inventories and other current expenditures for facilities maintenance will amount for about 500 million roubles (tab. 10) .
Analyzing the social costs of the regional budget, we cannot ignore the issues of fiscal policy in respect to wages. When considering the basic macroeconomic parameters for the budgeting it was noted that in 2010 it is projected to increase the wage bill by only 4% which of course excludes indexation of wages of public sector employees. However, if there appear additional incomes the issues of indexing salaries to employees of government-financed organizations may be considered by regional parliamentarians. Meanwhile, the regional authorities propose optimizing the number of state-financed employees as the main direction of increasing wage.
Much attention in the drafting and approval of the regional budget for the next fiscal year was paid to the formation of inter-budgetary relations. 12.2 billion roubles will be allocated to the budgets of municipalities and 2.4 billion roubles to the Territorial fund of obligatory medical insurance out of the total inter-budgetary transfers in 2010.
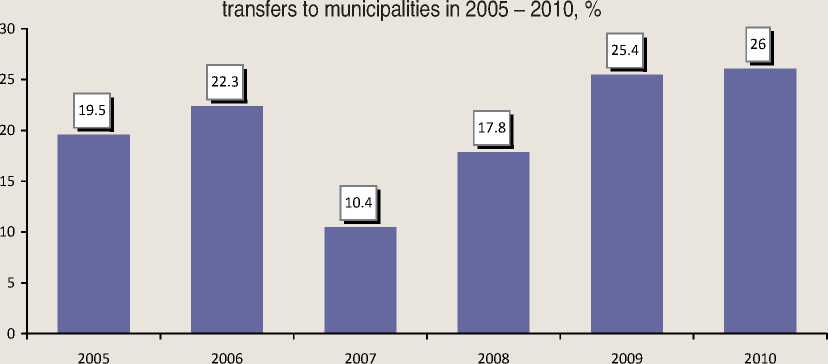
A characteristic feature of the inter-budgetary transfers’ structure to municipalities in 2009 – 2010 is an increase in the share of regional funds support for municipalities, which indicates an increase in the budgetary provision inequality of districts’ and settlements’ local government. The share of equalization subsidies is about a third of the total financial assistance to local budgets, which is higher than the level of 2005 – 2006 when the preparation and implementation of municipal reform took place (fig. 5) .
Table 10. Regional budget expenditures to social sectors in 2008 – 2010*
|
Item of expenses |
2008, mln. roub. |
2009 |
2010, plan |
||||
|
mln. roub. |
changes to 2008 |
mln. roub. |
changes to 2009 |
||||
|
mln. roub. |
% |
mln. roub. |
% |
||||
|
Expenditures, total |
9942.9 |
10477.0 |
+534.1 |
105.4 |
9999.3 |
-477.7 |
95.4 |
|
Including: Education |
2330.6 |
2160.3 |
-170.3 |
92.7 |
2057.8 |
-102.5 |
95.2 |
|
Culture |
1018.5 |
655.7 |
-362.8 |
64.4 |
682.8 |
+27.1 |
104.1 |
|
Health care, sport |
2492.6 |
2551.8 |
+59.2 |
102.4 |
2210.0 |
-341.8 |
86.6 |
|
Social policy |
4101.2 |
5109.2 |
+1008.0 |
124.6 |
5048.7 |
-60.5 |
98.8 |
* Expenditures are given net of inter-budgetary transfers.
Figure 5. The share of subsidies for equalization of budgetary provision in inter-budgetary
The regional budget is, except for social and economic function, aimed at stimulating the development of regional economy. Financial crisis has adjusted the economic structure of the budget expenditure, which was manifested in a hard-limiting nature of the investment cost. The structure of the budget for 2010 allocated to them just over 2%, all other appropriations will be channeled to finance current expenditure (fig. 6) .
Total budgetary investment in capital construction facilities of regional and municipal property in 2010 is approved in a sum of 777 million rubles which is 3 times lower than
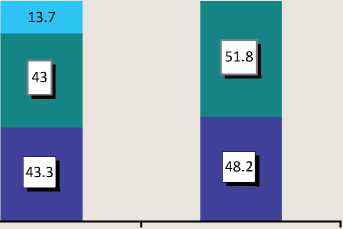
Figure 6. Economic structure of the regional budget expenditure in 2008 – 2010, %
1.8
2.4
2008 2009 2010
■ Сurrent expenditure
■ Сapital expenditure
□ Interest expenditure
the volume of capital investments in 2009, the share of these costs in the expenditure part of the regional budget is reduced from 11% in 2008 to 6% in 2009 and 2.4% in 2010. For the first time in recent years construction of educational, cultural and social purpose has not been scheduled. The volume of capital expenditures allocated to local budgets amount to only 204 million roubles, which is 15 times below the pre-crisis period. Thus, the need for immediate expenses associated with the operation of the population’s life support systems, forcing the regional Government to abandon in coming years from the formation of the development budget.
Among the few positive trends of the regional budget for 2010 should include a slight increase in appropriations for the realization of long-term target programs (LTP) to ensure socio-economic development of the region. The share of program funding in the general budget expenditures grows from 8 to 10%, which is comparable with the level of 2008, and of course, describes the qualitative aspects of the regional budget, as targeted programs for the format of budgeting by results should be viewed as a first step in the transition from functional to targeted budget classification (tab. 11) .
Some of the new programs proposed for funding from the regional budget include target programs to preserve and restore the fertility of agricultural lands, tourism development, the
Table 11. Regional budget expenditures for implementation of long-term target programs in 2008 – 2010
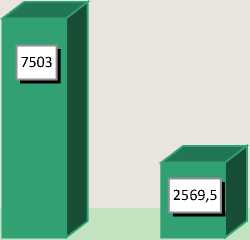
However, out of the 37 approved LTP for 30 of them the volumes of the planned allocations are below the funding levels contained in the Passport program. Total deficit of resource support program activities will amount to nearly 5 billion roubles or one third of the funding required (fig. 7) .
Concluding the analysis of the expenditure part of the regional budget, we must consider the sources of budget deficit in 2010. In the current economic and financial situation it is justifiably, that the main sources of financing the deficit of the regional budget will be borrowed funds (fig. 8) .
As you can see, if in 2009 the deficit, together with borrowings, was also covered by the contingency fund and the balance of fiscal accounts, then in 2010 it is planned to address the problem of deficit by attracting commercial bank loans and credits from the federal budget in the amount of 6 bil. roub. We should note that the Vologda region is resorting to credit for the first time since 2002.
As a result of large-scale domestic borrowings the region’s public debt for 2009 increased by 6.3 times compared with the size of the debt for 2008. In 2010, the debt burden on the regional budget will increase. It is expected that the amount of debt on 1 January 2011 will amount to almost 18 billion rubles or 86% of the tax and non-tax revenues of the regional budget. Thus, the size of the region’s public debt could approach the critical level (100% in the volume of own revenues) and create a clear threat to regional security budget system (tab. 12) .
The significant increase of the region’s debt commitments for the first time since 2004 will lead to the cost of their services, which will generally amount for about 800 million rubles for 2009 – 2010.
-
Figure 7. Long-term target programs resource support, mln. roub.
Figure 8. Funding sources of the regional budget
deficit in 2009 – 2010, %
■ Remaining part of budget
■ Budget loans
■ Bank credits
Calculated financing Approved financing
Table 12. Dynamics of public debt of the Vologda region for 2005 – 2010
|
Indicators |
Fact, on January 1 |
Plan for 01/01/2011 |
||||
|
2006 |
2007 |
2008 |
2009 |
2010 |
||
|
The volume of state debt, mil. roub.* |
1099 |
2129 |
1744 |
1752.5 |
7825.2 |
17935.3 |
|
As % of previous year |
88.2 |
193.7 |
81.9 |
100.5 |
446.5 |
229.2 |
|
As % of the regional budget own revenues |
7.1 |
9.8 |
6.5 |
5.1 |
41.1 |
86.0 |
|
Interest payments, mil. roub. |
0 |
0 |
0 |
0 |
161.1 |
581.4 |
|
* Source: Ministry of RF Finance. |
||||||
Given the severity of the problems with the debt load in some subjects of the Federation, Ministry of Finance of Russia as a federal agency is monitoring the situation with debt. Speaking at the forum “Strategic Planning in Regions and Cities of Russia”, deputy finance minister of RF, A.G. Siluanov ensured that the Ministry of Finance will not allow the regions’ default. This will involve the necessary tools, such as financial assistance, budgetary loans, work with commercial banks to restructure the region’s obligations [10].
Concluding the analysis of the law “On the Regional Budget for 2010”, we can conclude that the main financial document takes into account many realities which exist in the economy and fiscal system of the region for the first year of the crisis and which will determine the budget problems for a long time. The crisis left its mark on many items of income and expenditure of the regional budget. Therefore the main task of fiscal policy in the conceptual plan is limiting the size of budget deficits and creating prerequisites for further sustainable socio-economic development of the region.
The total budget for 2010 is decreasing compared to 2009. However the most important task solved by the regional budget is to carry out social obligations to its citizens, regardless of the state of the budget-forming region’s industry. It should also be borne in mind that the maintenance of approved budgetary allocations is critical to maintaining and expanding domestic consumer demand, which ultimately creates the conditions for positive structural changes in the region’s economy and social sphere.
In the unprecedented deficit of the regional budget system revenue base strength- ening comes to the forefront. In this regard, we consider it possible to formulate a number of reserves to increase the regional budget’s earnings.
-
1. Additional incomes to the budget revenue can be achieved by adopting more effective measures to eliminate existing debt on taxes and levies, which amount to 1.9 billion roubles on 1 March 2010.
-
2. Reserve to increase the regional budget revenue base is a full-scale inventories of benefits providing effectiveness for all compulsory payments, their revision and cancellation in case of poor performance (in 2008 the regional budget lost income as a result of benefits was estimated at about 3 billion roubles).
-
3. As a source of the budget revenues replenishment should be strengthening of the financial, regulatory and law enforcement field, aimed at the legalization of income from commercial activities, bringing the accounting system to order and collecting taxes and other payments.
-
4. Additional revenue growth may provide more effective administration in the sphere of non-tax revenues. In the pre-crisis period the increasing collection of these revenue sources neglected. Now, in terms of the objective reduction of tax revenue the problem of nontax revenue is important. In order to increase non-tax payments it is necessary to improve the management of regional assets, the revitalization of work with tenants, the exclusion of concessional rates of rent, the revision of the fines and sanctions and other measures aimed at improving the efficiency of the regional ownership use.
There is no doubt that the involvement of all the provisions noted above would give some
^™ Sum, mln. roub. Share, % increase of budgetary resources. However, the key potential source of growth in the revenue base continues to be the diversification of the region’s economy. The crisis revealed the vulnerability of the entire budgetary system from the influence of global conditions, so only the persistent implementation of measures aimed at creating a diversified economy, capable to solve the problem of balancing the budget, to ensure a stable filling of regional coffers and to minimize budget risks. These activities may be the development of small business, wooden construction, technological, organizational and managerial innovations.
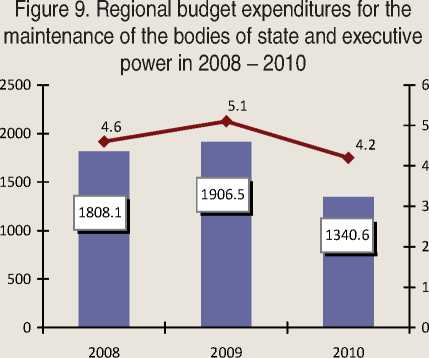
As for the expenditure of the regional budget, then we should not focus on the mechanical costs cut but to reduce the inefficient, wasteful costs by optimizing them. It is a very tough decision in connection with a high proportion in the structure of expenditures of minimum social obligations. In this situation, it is first of all necessary to improve the structure and reduce the number of employees of public administration. Despite the relatively large (30%) reduction in budgetary allocations for the maintenance of the departments’ bodies, committees and other units of government in 2010, the nominal amount and share of management costs in the expenditure part of the regional budget over the appointment, approved by all sectors of the economy, infrastructure, environment, sport and culture (fig. 9).
Effect of optimizing the management costs may be higher because not all state agencies found the opportunity to reduce costs for the operation of their bodies. For example, if the Regional Government slashed spending by 43%, the Department of Construction, Industry and Energy, Department of road facilities, Department of municipalities, housing inspection did it only by 7 – 12%.
The budget reduction also means limiting state involvement in those areas where its place should be taken by market structures. In our view, in the current situation there is need for the Government and local authorities of developing a special system of measures aimed at improving corporate social responsibility.
Undoubtedly, the implementation of the budget in 2010 will not be smooth. This budget is austerity. The complexity of the tasks that lie ahead in the next few years dictate the need for a new system, fiscal relations, the basic principle of which should be effective and prudent use of financial resources, avoiding disruption of the priority social obligations.
