Socio-economic inequality of regions in the Russian Federation: measurement issues and long-term evaluation

Author: Shatalova Olga M., Kasatkina Ekaterina V.
Journal: Economic and Social Changes: Facts, Trends, Forecast @volnc-esc-en
Section: Regional economy
Article in issue: 4 т.15, 2022.
Free access
The article is devoted to the problem of interregional differences in the economic area of the Russian Federation. The research covers a long period (from 1990 to 2020), since this period saw significant changes in the economic, institutional and political structure of the country. The assessment of the level of differences of regions is based on the main socio-economic indicators, data on which are formed in the system of state regional statistics. The Theil index was used as the basic method for measuring inequality. This made it possible to assess the dynamics of the spatial localization of economic activity in terms of the main socio-economic indicators, as well as form the groundwork for continuing the research - assessing its intragroup and intergroup components in the sectoral aspect. For a structural analysis of the problem of regional differences, we propose our own algorithm that allows us to form a discrete variation series and calculate the integral decile coefficient. The numerical implementation of the proposed algorithm made it possible to compile a multidimensional classification of regions according to the level of their economic activity and calculate the decile coefficient on this basis; the decile coefficient integrates the totality of the main socio-economic indicators adopted for the research. The results of the research show the long-term dynamics of the growth of differences and its significant level in comparison with the pre-reform period. A numerical assessment of the measure of differences, measured using the integral decile coefficient for a set of basic economic indicators of the regions, has been compiled. On this basis, it was found that in the long term (1995-2020) the level of economic differences of the regions increased from 2.4 to 5.6 times. A classification of regions according to the level of economic activity has been compiled, which reflects the nature of the differences of the regions of the Russian Federation, as well as the geography of the location of centers of concentration of economic activity.
Regional economy, interregional differences, theil index, integral decile coefficient, spatial localization, economic activity
Short address: https://sciup.org/147238485
IDR: 147238485 | UDC: 332.12:001.84 | DOI: 10.15838/esc.2022.4.82.5
Text of the scientific article Socio-economic inequality of regions in the Russian Federation: measurement issues and long-term evaluation
The relevance of the problem of socio-economic differentiation of regions is due to the fact that the high heterogeneity of regions impedes the establishment of a full-fledged economic space in the country, hampers the promotion of equal opportunities for the development of business and social environment in various RF constituent entities, entails inequality in the availability of public goods, etc. Economic heterogeneity of regions is due to the differences in climatic and geographical conditions, historically established industry specialization and production potential, as well as a number of other objective factors. At the same time, significant changes in the economic, institutional, and political structure of the country have led to the transformation of the spatial organization of the national economy and the strengthening of interregional differences.
Improving the territorial organization of the national economy and reducing interregional socioeconomic imbalances is one of the important functions of state regional policy. The relevant problems and implementation tasks are declared, in particular, in the Spatial Development Strategy of the Russian Federation through to 20251 (hereinafter referred to as the “Strategy ...2025”). This policy document notes that “over the past ten years, as a result of the state regional development policy, there has been a reduction in interregional socio-economic imbalances”.
In assessing interregional differentiation, not only the current state and medium-term trends are important. We should take into account that “in the early 1990s there was a significant increase in <...> differentiation” (Bakhtizin et al., 2017); this period witnessed significant political and socioeconomic transformations, which also influenced the transformation of the country’s economic space. Thus, in order to investigate the existing interregional socio-economic imbalances, we should consider the corresponding thirty-year period from 1990 to 2020 as more representative. Such depth of research will, in our opinion, allow us to make a more thorough description of the national economic space and, in particular, to identify trends in interregional differences in the socioeconomic situation of RF constituent entities and the dynamics of spatial localization (concentration) of economic activity in the country.
Interregional socio-economic differentiation has been addressed in many scientific publications by foreign and Russian economists. At the same time, we should note that though the methodological framework for measuring inequality is elaborated quite well, the question remains open as to the possibility of its application in the multidimensional space of the criteria of economic activity and socio-economic differentiation of the country’s regions.
The purpose of the study is to conduct a longterm multidimensional assessment of economic inequality among Russian regions so as to reveal trends in the changing economic space of the country and identify new centers of concentration of economic activity. To achieve this goal, the following tasks were addressed:
– collecting and preprocessing the data on the chosen indicators of socio-economic situation in the regions;
– assessing the level of differentiation of the regions based on the Theil index calculated for the indicators we use here to assess the socio-economic situation of the regions; identifying long-term trends in the change of the country’s economic space;
– calculating the integral indicator of regions’ economic activity that summarizes all the features of their socio-economic situation; using this indicator to classify the regions by the level of economic activity;
– evaluating average (in the selected groups of regions) values of the economic characteristics under consideration to verify the quality of the classification and meaningful interpretation of the classification results;
– calculating the integral decile coefficient based on the compiled classification of the regions; the decile coefficient in this case represents a multidimensional numerical assessment of interregional differentiation in the totality of indicators of the socio-economic situation in the regions;
– graphical representation of the structure of the country’s economic space based on the compiled multidimensional classification of the regions and displaying the geography of location of the centers of economic activity.
The novelty of our research findings consists in the development of methodological approaches to measuring economic inequality of regions and a long-term retrospective assessment of the structure of the country’s economic space. When implemented, the proposed approaches add to the existing ideas about the nature of regional inequality, which is important for clarifying the policy aimed at the development of national economic space.
Methodological foundations and research methodology
Overview of methodological approaches to measuring interregional inequality
The issues of interregional inequality on the scale of the national economy are of considerable scientific interest to Russian and foreign economic scientists. Among the works most significant for our research, we should note the following.
An article by A.R. Bakhtizin, E.M. Bukhvald, A.V. Kolchugina (Bakhtizin et al., 2017) contains an overview of the norms of legal regulation of state regional policy in addressing the issues of economic levelling-off of RF regions. The paper presents numerical estimates of the scale of regional differentiation for the period from 1995 to 2014; the differentiation was measured on the basis of a decile coefficient calculated by specific economic indicators of the regions: GRP, the volume of investments in fixed assets, the volume of production, and residents’ income level. The article confirms the authors’ hypothesis about the tendency toward strengthening interregional differentiation during economic recovery periods. Conclusions are formulated about the relevance of an integrated approach in the use of tools for the development of territories, selectivity (targeting) in the implementation of measures to equalize the economy of regions based on their classification according to acceptable criteria.
Works of E.A. Kolomak (Kolomak, 2014a; Kolomak, 2014b; Kolomak, 2020) contain estimates of regional differentiation formed on the basis of the Theil index, the coefficient of variation, and the Hirschman – Herfindahl index; differentiation measurements are compiled by volume economic indicators – GRP, population, number of employed – and the specific indicator of GRP per capita; and a study of spatial concentration factors is presented in regression models and by decomposition of the Theil index.
K.P. Glushchenko’s works contain solutions on a methodology for measuring regional differentiation (Glushchenko, 2016; Glushchenko, 2018), and the results of assessing regional inequality in terms of income (Glushchenko, 2010).
Publications by N.V. Zubarevich (Zubarevich, 2014; Zubarevich, Safronov, 2014) are devoted to a wide range of issues of interregional inequality: estimates of regional differentiation in terms of income and employment are compiled; issues of improving the budget policy of economic alignment of regions are presented; the influence of institutional factors in the development of the economic space is described, etc. The author’s empirical estimates are based on such indicators as the Gini index and the decile coefficient.
Publications of foreign researchers on the level and conditions of differentiation of the Russian economic space and proposed solutions on ways to ensure regional leveling-off development2 are of great interest (Benini, Czyzewski, 2007). Our study also finds useful results in the foreign experience in addressing the problem of economic differentiation of regions to ensuring economic growth3 (Obradovic et al, 2016).
Publications of B.L. Lavrovskii and E.A. Shiltsin (Lavrovskii, Shiltsin, 2009; Lavrovskii, Shiltsin, 2016) reflect the essential aspects of interregional differentiation by individual socio-economic indicators: GRP, labor productivity, budget security. Differentiation estimates are based on the use of statistical measures of inequality – the coefficient of variation, the decile coefficient.
Of high methodological importance are the works of M.Yu. Malkina that reveal methodological features regarding the application of the main indicators of economic inequality of regions (Malkina, 2016a), as well as their application in the study of issues of state regional and budgetary policy (Malkina, 2014; Malkina, 2016b;).
The representativeness of modern research on the economic differentiation of regions indicates the high relevance of this scientific problem, as well as the formation of significant scientific experience of relevant measurements based on the general methodology of mathematical statistics in the study of the variation of a set of objects. At that, we should distinguish several groups of methods:
– statistical indicators of variation: the indicators “relative linear deviation”, “coefficient of variation”, etc. are presented. The methods within this group are characterized by high objectivity, but their use does not allow us to make an exhaustive description of the totality;
– structural indicators of distribution : they help to make a graphical interpretation of the distribution of objects in the aggregate and identify its features; as part of this group of methods, the decile coefficient has become widespread in studies of regional inequality;
– concentration indicators : designed to measure the degree of unevenness – the extent of concentration of the feature under consideration among the objects of the aggregate. As part of this group, the Gini index, the Hirschman – Herfindahl index, and the Lorentz coefficient have become the most applicable in modern studies of regional economics;
– indicators of “general entropy” : the corresponding group of measures of inequality of economic objects results from the transformation of C. Shannon’s information entropy formula (entropy in this case is understood as a measure of randomness). The most applicable “entropy” indicators in economic research are the mean log deviation, the Theil index, and the Atkinson index.
The established methods of measuring inequality are used for individual indicators of economic activity such as GRP, population, population income, etc. However, the economic activity of regions is a complex category, and it is characterized by a set of indicators. The question of the composition of the indicators of economic activity of the regions is debatable. At the same time, we agree with the provisions that an important element of the strategy for reducing inequality consists in structural transformations and economic growth that contribute to increasing employment and labor incomes4; at the same time, practical application of this declaration requires using the indicators generated in the system of state statistical observations. Thus, it seems relevant to develop existing approaches to the study of economic inequality of regions based on multidimensional analysis, as well as the use of an appropriate integral measure of interregional differentiation.
In our study, we developed and tested a new algorithm for calculating the decile coefficient. The algorithm includes basic methods of mathematical statistics, provides for multidimensional data processing, analytical structuring of the variation spread according to criteria significant for the study. The space of classification criteria in this case includes a wide range of indicators of the socio-economic situation in regions that are essential for the study. The groups of regions formed in this way are statistically homogeneous, which provides the possibility of their meaningful interpretation and intergroup comparisons, as well as the possibility of using this grouping to calculate the integral decile coefficient.
Own research methodology
Within the framework of the study, we used two measures of inequality – the Theil index as a Generalized Entropy index of the second order (Theil, 1967) and the decile coefficient. We chose these indicators due to the following conditions:
– using the Theil index to assess the level of differentiation of regions, first, allows us to compare the results obtained with the results of previous studies (Bakhtizin et al., 2017; Kolomak, 2014a; Glushchenko, 2015; etc.); second, allows us to detail the estimates obtained, since the Theil index allows for the possibility of decomposition of its value (Theil, 1979; Adelman, Levy, 1984; etc.);
– using the decile coefficient makes it possible to make a structural characteristic of inequality in the economic space of the country; in this case, the category of “inequality” itself is considered in a complex manifestation as a result of the integration of a wide range of indicators of the socio-economic situation in regions.
We calculated the Theil index in two forms – for volumetric indicators of the socio-economic
We calculated the integral decile coefficient (IDC), designed to solve two problems:
situation in regions ( GE (1)) and for specific 1) provide an integrated approach to measuring
indicators ( GET (1)). nx x
GE (1) = - £ In , (1)
n j = 1 x x
the level of inequality by integrating a set of key indicators of economic activity of regions (in specific representation):
where n is the number of objects of the studied population (the number of RF regions); xj is the value of the estimated (main) volumetric indicator in region j ; x is the average value of the estimated (main) volumetric indicator in the studied population.
x j
n
GEt (!) = 2 j In -PX , (2)
J = 1 X p j/
P
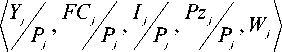
where Yj is the volume of GRP; FCj is the cost of fixed assets; I is the investments in fixed assets; Pz j j is the number of employed population; Pj is the number of population; Wj is the amount of accrued wages of employees of organizations in the region;
where X is the total value of the estimated (main) volumetric indicator for the studied set of regions: X = '/x; pj is the value of the normalizing i =1
volumetric indicator in region j; P is the total value of the normalizing volumetric indicator for the studied set of regions: P = ^p . The normalizing j=1 J indicator is understood as an indicator involved in calculating the specific value yj for the main indicator xj: yj = xj p . The “population” indicator was adopted as a normj alizing indicator.
The decile coefficient characterizing the ratio between the average values of the two extreme deciles in the studied set of objects, when measuring interregional differentiation, is usually calculated by the main indicator of the socio-economic situation of the regions – GRP per capita5 (Bakhtizin et al., 2017; etc.). A methodologically significant issue when using this meter is to set the rule for structuring the scope of variation. When setting such a rule, a number of methods were developed: Sturges’ rule, Scott’s rule, Freedman – Diaconis rule, etc. (Orlov, 2013).
5 Nikolaev I.A., Tochilkina O.S. (2011). Economic Differentiation of Regions: Estimates, Dynamics, Comparisons: Analytical Report. Available at: (accessed: March 1, 2022).
2) provide analytical grounds for dividing the scope of variation of the studied set of regions into significant classification groups.
The research methodology is disclosed by the following provisions.
-
1. Data collection and preprocessing. Our study used Rosstat data on the main socio-economic indicators of the economic activity of the regions. Preprocessing consisted mainly in calculating the specific values of these indicators (per capita).
-
2. Numerical measurement and evaluation of the extent of regional differentiation . The extent of differentiation was measured using the Theil index calculated for each of the socio-economic indicators of regions included in the study. The characteristic of interregional differentiation is formed on the basis of a study of the long-term dynamics of the Theil index.
-
3. Structural analysis of interregional differentiation . Performed using the IDC calculated on the basis of the following algorithm.
Step 1: normalization of specific indicators of economic activity ( i ) of regions ( j ); normalization is implemented by the linear method:
η
yij
y i min
ij
y i max
y i min
where η ij is the normalized value of the indicator y ij .
Step 2 : calculation of the integral coefficient of economic activity of regions (ICEA) KEA is carried out by means of additive convolution according to the indicators η :
ij
KEAj = E П У . (5)
i
Step 3: classification of regions by groups of economic activity:
1) splitting the scope of variation into minimum intervals I k min :
min k
min k-1
+
K
EA max
—
K
EA min
M
k = 1,..., M , (6)
where M is the expert-defined number of groups (the value adopted in the framework of the study M = 17 was determined by the results of a numerical experiment); I 0 min = K EA is the lower bound of the first minimum interval;
-
2) distributing the regions based on the ratio of their calculated values of ICEA with the resulting division into minimum intervals;
-
3) qualitative characteristics of the obtained distribution and combining intervals for small groups (with a frequency of less than five objects), aimed at increasing the statistical stability of the classification being formed;
-
4) checking the stability of the obtained solution using Sturges’ rule (Sturges, 1926).
Step 4: calculation of the integral decile coefficient in the order adopted for the case of unequal intervals:
h
IDC = DV , D = I "" + - - I f , ,
D1 fh V10
k = 1,...,9, where I min is the lower bound of the i interval ik containing the k-th decile; hik is the width of the decile interval; fi is the frequency of the decile ik-1
interval; ^ f is the sum of the accumulated frequencies preceding the decile interval.
The proposed algorithm is intended for the formation of a discrete variation series as the basis for a multidimensional classification of regions by level of economic activity, as well as for calculating the integral decile coefficient.
Results and discussion
The conducted research is based on the data of the state system of regional statistics6. The initial data set contains 13,410 records on the main socioeconomic indicators of RF regions:
/Y , FC ., I ., Pz ., W , P V (8) j , j , j , j , j , j
The data are arranged in the matrix A = (% ;; ) , where i is a socio-economic indicator, i = 1.6 ; j is a region, ; = 1.82 . The matrix A was formed for 1990 and for 1995–2020; since there is no information on the volume of GRP for 1990 in the published data of the state regional statistics, then the matrix A contains five indicators for this period.
The data set was used to calculate and evaluate two measures of interregional differentiation – the Theil index and the integral decile coefficient; also, on the basis of this data set, we compiled a classification of regions by level of their economic activity.
The Theil index as a measure of interregional differentiation.
The calculation of the Theil index was based on the absolute values of economic indicators Y FC I Pz P ; the formula (1) was used. j , j , j , j , j
Interregional inequality was measured with the use YI of specific indicators j , j ; the Theil index in Pj Pj this case was calculated according to the formula (2).
The result of calculations is shown in Figures 1 and 2 . The presented graphs reflect the dynamics of interregional differentiation over the period from 1990 to 2020.
6 Statistics collections “Regions of Russia. SocioEconomic Indicators…” (2003, 2011, 2018, 2021). Available at: ; Section “Data Showcase”. Available at: ru/finder/ (accessed: March 1, 2022).
Figure 1. Dynamics of the Theil index according to the main socio-economic indicators of regions (in absolute terms)
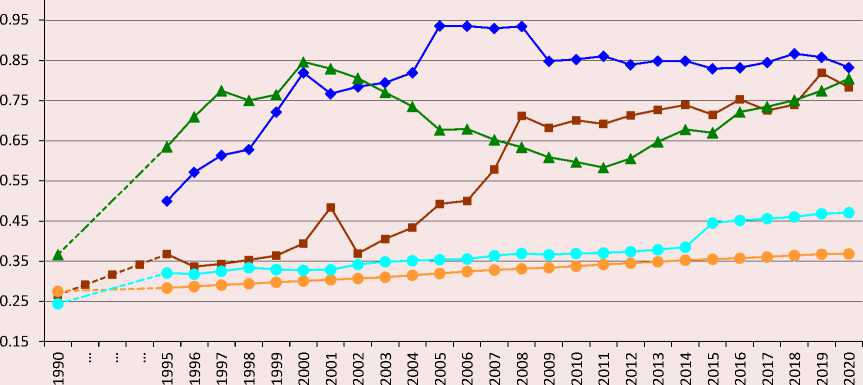
— ♦ — Gross regional product — ■ — Fixed assets value
—*— Investments in fixed assets —•— Population
—•— Number of employed persons in the economy
Source: own calculation.
Figure 2. Dynamics of the Theil index according to the main socio-economic indicators of regions (in specific values)
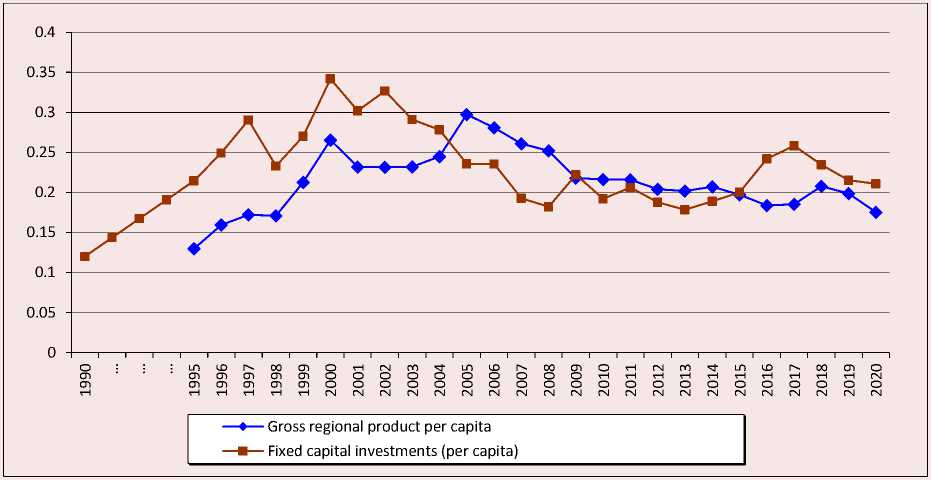
Source: own calculation.
The long-term dynamics of the Theil index according to the main socio-economic indicators presented in Figures 1 and 2 allow us to draw a number of conclusions:
-
1) in the base year 1990, which can be attributed to the pre-reform period, there is a fairly low level of regional differentiation in the economic space of the country;
-
2) in the period up to 2000, there is a significant increase in regional inequality in terms of “investment in fixed assets”, which subsequently (since 2001) is transformed into an increase in interregional differentiation in terms of the “value of fixed assets” indicator;
-
3) in terms of GRP, we can note a pronounced strengthening of interregional differentiation in the period from 1995 to 2008 – the level of the Theil index for this indicator reached 0.95 in 2008; this is 1/5 of the maximum value of this indicator (the maximum value of the Theil index is 4.4 and means such a conditional situation that all economic activity is concentrated in one center);
-
4) differentiation of regions in terms of “population” and “number of the employed” increased not so significantly in the period under consideration; such dynamics may be a consequence of low labor mobility and/or increased economic
influence of economic sectors with low demand for labor resources (Zubarevich, Safronov, 2014; etc.);
-
5) the features of the differentiation calculated by specific indicators are increasing at a slower pace, but also indicate the existence of economic inequality in the regions.
The problem of increasing inequality of regions requires studying the structural characteristics of the country’s economic space, conducting numerical assessment of the structure of inequality, and designing a classification of regions according to the level of economic activity.
Structural analysis in the study of the concentration of economic activity
The study of structural features of the economic inequality of regions was carried out on the basis of the proposed algorithm (4) – (7). Using our own algorithm, we classified the regions and calculated the decile coefficient based on the integral indicator of economic activity ICEA. The evaluation of the ICEA was performed by means of additive convolution (5) of the normalized values of specific indicators, the composition of which is reflected in (3).
The ICEA served as a complex criterion for multidimensional classification of regions, compiled by dividing the population under consideration into seven statistically homogeneous groups of regions;
Figure 3. Values of the integral decile coefficient, a structural feature of economic inequality in Russian regions in 1995–2020
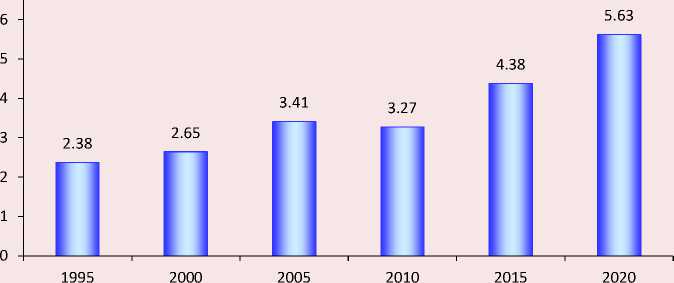
Source: own calculation.
we should note that the analytically determined number of intervals in the studied population corresponds to Sturges’ rule. The compiled classification of regions according to the level of their economic activity served as the basis for calculating the decile coefficient for the years of the period under consideration. The integral decile coefficient calculated in this way represents a complex structural characteristic of the country’s economic space. The result of IDC calculation is presented in the form of a diagram in Figure 3.
The values of the IDC confirm the estimates based on the Theil index about the increase in interregional differentiation. During the period
Parameters of the integral decile coefficient, a structural characteristic of economic inequality in Russian regions in 2020
|
о |
Interval of values of the integral coefficient of economic activity, min max I k - I k |
Parameters of the integral decile coefficient |
Е ^ |
Composition of regions |
|||||||||
|
& Е о |
"о "S ^ CD о О CQ "п_ 2 |
5 §"-§ ° о | 5 s Е |
ё s f. ■ f Ив |
i -5 |
|||||||||
|
yk |
Vk |
yk |
Vk |
yk |
Vk |
yk |
Vk |
yk |
Vk |
||||
|
1 |
0.13–0.38 |
0.23 |
23% |
0.35 |
9% |
0.70 |
31% |
0.06 |
30% |
32.6 |
15% |
9 |
Republic of Adygea, Republic of Dagestan, Republic of Ingushetia, Kabardino-Balkarian Republic, Chechen Republic, Karachay-Cherkess Republic, Republic of North Ossetia – Alania, Republic of Altai, Republic of Tyva |
|
2 |
0.40–0.64 |
0.32 |
10% |
0.41 |
6% |
1.32 |
23% |
0.06 |
38% |
32.9 |
9% |
15 |
Bryansk Oblast, Ivanovo Oblast, Kostroma Oblast, Oryol Oblast, Pskov Oblast, Republic of Kalmykia, city of Sevastopol, Mari El Republic, Chuvash Republic, Kirov Oblast, Saratov Oblast, Ulyanovsk Oblast, Kurgan Oblast, Altai Krai, Republic of Buryatia |
|
3 |
0.66–0.91 |
0.41 |
15% |
0.44 |
5% |
1.64 |
22% |
0.09 |
25% |
36.9 |
12% |
21 |
Vladimir Oblast, Kursk Oblast, Ryazan Oblast, Smolensk Oblast, Tambov Oblast, Tver Oblast, Novgorod Oblast, Republic of Crimea, Volgograd Oblast, Rostov Oblast, Stavropol Krai, Republic of Bashkortostan, Mordovia, Udmurt Republic, Orenburg Oblast, Penza Oblast, Republic of Khakassia, Kemerovo Oblast, Omsk Oblast, Zabaikalsky Krai, Jewish Autonomous Oblast |
|
4 |
0.95–1.12 |
0.52 |
9% |
0.47 |
5% |
1.96 |
12% |
0.10 |
18% |
40.1 |
9% |
16 |
Belgorod Oblast, Voronezh Oblast, Lipetsk Oblast, Tula Oblast, Yaroslavl Oblast, Karelia Republic, Kaliningrad Oblast, Krasnodar Oblast, Astrakhan Oblast, Perm Krai, Nizhny Novgorod Oblast, Samara Oblast, Sverdlovsk Oblast, Chelyabinsk Oblast, Novosibirsk Oblast, Tomsk Oblast |
|
5 |
1.19–1.54 |
0.66 |
17% |
0.46 |
7% |
2.53 |
21% |
0.16 |
25% |
49.5 |
12% |
10 |
Kaluga Oblast, Arkhangelsk Oblast, Vologda Oblast, Leningrad Oblast, Republic of Tatarstan, Irkutsk Oblast, Primorsky Krai, Moscow Oblast, Krasnoyarsk Krai, Khabarovsk Krai |
|
6 |
1.83–2.28 |
0.91 |
24% |
0.51 |
9% |
3.74 |
25% |
0.24 |
44% |
68.4 |
18% |
7 |
Komi Republic, Amur Oblast, Murmansk Oblast, Saint Petersburg, Republic of Sakha (Yakutia), Kamchatka Krai, Tyumen Oblast |
|
7 |
3.01–4.55 |
2.00 |
15% |
0.63 |
8% |
4.65 |
56% |
0.46 |
36% |
96.2 |
21% |
4 |
Moscow, Magadan Oblast, Sakhalin Oblast, Chukotka Autonomous Okrug |
Source: own calculation.
under consideration, the difference between the extreme deciles of the country’s regions increased from 2.4 to 5.6 times. Since the decile coefficient is an integral measure of interregional inequality in the multidimensional space of criteria, it is important to understand its internal content – the composition of the parameters taken into the assessment of the IDC. The table shows data for 2020 on the interval values of the ICEA by classification groups of regions, as well as on the parameters of its constituents – in the form of average estimates y k and the coefficient of variation Vk .
According to the data from the table, the following main conclusions can be made:
– the classification of regions compiled on the basis of our own algorithm made it possible to obtain statistically homogeneous groups; this, first, confirms the validity of the classification obtained, and second, allows for a meaningful interpretation of each group of regions and an assessment of intergroup differences;
– the numerical values of ICEA parameters indicate a really high differentiation of the existing groups of regions: the average estimates of the parameters show an 8-fold difference in the specific volume of investments, 8.6-fold difference in the level of GRP, 6.7-fold difference in the specific volume of fixed assets;
– the groups with the highest concentration of economic activity – (7) and (6) – include regions with single-industry economic specialization in the extractive industry (Shatalova et al., 2022), as well as Saint Petersburg and Moscow. We should note that the high values of specific indicators in terms of GRP, investments, fixed assets (normalized by population) in such regions as the Magadan Oblast, the Sakhalin Oblast and Chukotka Autonomous Okrug are partly due to the small number of people permanently residing in these regions; the combined population of these three regions is 0.5%, at the same time, their “contribution” to the total volume of GRP and investments in the Russian Federation is 1.50% and 1.45%, respectively;
– the regions specializing in the manufacturing sector belong mainly to groups (3) and (4), that is, they do not have pronounced signs of concentration of economic activity; except for the Kaluga Oblast, the Leningrad Oblast and the Republic of Tatarstan, which are included in group (5).
Figure 4. The structure of the country’s economic space according to the level of concentration of economic activity of regions (2020)
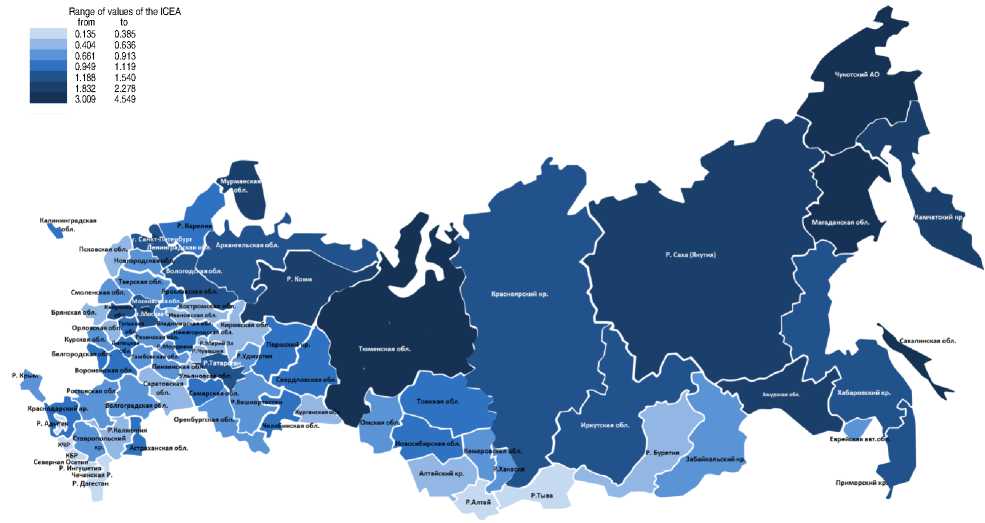
Range of values of the ICEA from 0.135 0.404 0.661 0.949 1.188 1.832 3.009
to 0.385 0.636 0.913 1.119 1.540 2.278 4.549
Thus, according to the results of the study, we conclude that during the thirty-year period under consideration, there has been a tendency toward increasing interregional inequality in the economic space of the country, with the primary sector becoming more important (the “primary sector” is defined in accordance with the theoretical concept of the Fisher – Clark three-sector model (Fisher, 1939)).
In order to provide a visual representation of the compiled classification of regions, we designed a color chart that shows the structure of the country’s economic space according to the level of concentration of economic activity (Fig. 4) .
The color chart clearly shows the nature of the differentiation of RF regions and the geography of the centers of concentration of economic activity.
Conclusion
The research presented in the article is aimed at assessing the inequality of Russian regions in a longterm retrospective. To solve the research task, we used the established statistical methods for measuring inequality, including the calculation of the Theil index and the decile coefficient. To adapt the existing methods of structural analysis of variation to the specifics of the study, we proposed an algorithm for calculating the integral decile coefficient and the formation of a discrete variation series. The numerical implementation of the proposed algorithm made it possible to compile a multidimensional classification of regions according to the level of their economic activity and calculate on this basis a decile coefficient integrating the totality of the main socio-economic indicators.
The main results of the study are summarized as follows:
– based on the calculation of the Theil index for the main socio-economic indicators, we show a long-term trend toward increasing differentiation of regions compared to the pre-reform period; the differentiation of regions is especially significant according to the following indicators: the volume of GRP, the volume of production investments, the cost of fixed assets;
– structural features of regional inequality, measured using the integral decile coefficient, also indicate negative changes in the economic space of the country – the differentiation of the economic condition of the regions included in the extreme deciles increased from 2.4 to 5.6 times the level;
– the classification of regions carried out on the basis of our own algorithm shows that the concentration of economic activity is shifting toward the extractive industry sector (mainly to the regions of Siberia and the Far East), as well as the cities of Moscow and Saint Petersburg. The regions whose economic specialization is focused on high-tech industries usually do not have a pronounced concentration of economic activity.
The results obtained are consistent with the provisions of earlier studies conducted by Russian economists (Bakhtizin et al., 2017; Kolomak, 2014a; Glushchenko, 2015, etc.) on the high importance of the problem of economic inequality in Russian regions and the relevance of an effective state policy of levelling-off development. At the same time, within the framework of the research, we studied a long-term retrospective and revealed an increase in the level of inequality in comparison with the pre-reform period. Our own algorithm for estimating the decile coefficient develops the established methods for measuring regional differentiation: it helps to make an integral assessment of interregional differentiation according to the totality of the main socio-economic indicators and to reveal its structural component.
We see the practical significance of our research findings in the possibility of using them in the implementation of state regional policy, one of the directions of which is defined as “reducing the level of interregional differentiation in the socio-economic development of RF constituent entities and reducing intraregional socio-economic differences”7. The solution of the relevant tasks requires monitoring and control of the results achieved in the implementation of measures for leveling-off the development of territories. However, the set of spatial development targets contained in the current edition of “Strategy ...2025” does not include necessary indicators for measuring economic inequality of the country’s regions. In this regard, it seems necessary to supplement this set of indicators on the basis of modern achievements of economic science and world experience.
Taking into account the urgency of the problem of interregional differentiation in the country and the wide possibilities of the methodological framework for its study, we find it important to continue the study in the following areas: quantitative and qualitative assessment of the impact of the established centers of economic growth on economic convergence within the respective macro-regions; assessment of the nature of interregional differentiation in the context of industry clusters; identification of centers of spatial localization of industry production systems; conducting cross-country comparisons and researching foreign experience in reducing economic inequality of regions in the context of the neo-industrial imperative of economic growth.
References Socio-economic inequality of regions in the Russian Federation: measurement issues and long-term evaluation
- Adelman I., Levy A. (1984). Decomposing Theil’s index of income in equality into between and within component. The Review of Income and Wealth, 30(32), 119–121.
- Bakhtizin A.R., Bukhval'd E.M., Kol'chugina A.V. (2017). Economic differentiation of regions of Russia: New estimates and patterns. ETAP: ekonomicheskaya teoriya, analiz, praktika=ETAP: Economic Theory, Analysis, Practice, 1, 41–56 (in Russian).
- Benini R., Czyzewski A. (2007). Regional disparities and economic growth in Russia: New growth patterns and catching up. Econ Change, 40, 91–135. DOI: 10.1007/s10644-007-9026-0.
- Fisher A.G.B. (1939). Production, primary, secondary and tertiary. Economic Record, 15(1), 24–38. Available at: https://onlinelibrary.wiley.com/doi/epdf/10.1111/j.1475-4932.1939.tb01015.x.
- Gluschenko K. (2018). Measuring regional inequality: To weight or not to weight? Spatial Economic Analysis, 13(1), 36–59.
- Glushchenko K.P. (2010). Income inequality in Russian regions: comparative analysis. Region: Ekonomika i Sotsiologiya=Region: Economics and Sociology, 4, 88–119 (in Russian).
- Glushchenko K.P. (2016). On the issue of application of the Gini coefficient and other inequality indices. Voprosy statistiki, 2, 71–80 (in Russian).
- Kolomak E.A. (2014a). Spatial concentration of economic activity in Russia. Prostranstvennaya ekonomika=Spatial Economics, 4, 82–99 (in Russian).
- Kolomak E.A. (2014b). Evolution of the spatial distribution of economic activities in Russia. Region: Ekonomika i Sotsiologiya=Region: Economics and Sociology, 3(83), 75–93 (in Russian).
- Kolomak E.A. (2020). Transformation of spatial proportions of modern Russia’s development: Directions, rates, factors. Interekspo Geo-Sibir', 3(1), 88–95 (in Russian).
- Lavrovskii B.L., Shil'tsin E.A. (2009). Russian regions: Convergence or stratification? Ekonomika i matematicheskie metody=Economics and Mathematical Methods, 45(2), 31–36 (in Russian).
- Lavrovskii B.L., Shil'tsin E.A. (2016). Gross regional product of Russian regions in last years: Dynamic and spatial configuration. Ekonomika regiona=Economy of Region, 12(2), 383–395 (in Russian).
- Malkina M.Yu. (2014). Study of the relationship between the development level and degree of income inequality in the Russian regions. Ekonomika regiona=Economy of Region, 2, 238 (in Russian)
- Malkina M.Yu. (2016a). On the issue of weighting in interregional studies (in response to K.P. Gluschenko). Prostranstvennaya ekonomika=Spatial Economics, 1, 163–184 (in Russian).
- Malkina M.Yu. (2016b). Evaluation of the factors of Russian regions’ convergence/divergence in the level of budget provision based on the decomposition of the Theil – Bernoulli Index. Prostranstvennaya ekonomika=Spatial Economics, 3, 16–37 (in Russian).
- Obradović S., Lojanica N., Stančić O. (2016). The influence of economic growth on regional disparities: Empirical evidence from OECD countries. Zb. Rad. Ekon. Fak. Rij, 34(1), 161–186. DOI: 10.18045/zbefri.2016.1.161.
- Orlov Yu.N. (2013). Optimal histogram partitioning for estimating the sample density of the distribution function of a nonstationary time series. Preprinty IPM im. M.V. Keldysha=Keldysh Institute Preprints, 14. Available at: http://library.keldysh.ru/preprint.asp?id=2013-14 (accessed: March 1, 2022; in Russian).
- Shatalova O.M., Kasatkina E.V., Livshits V.N. (2022). Cluster analysis and classification of industrially oriented regions of the Russian Federation by economic specialization. Ekonomika i matematicheskie metody=Economics and Mathematical Methods, 58(1), 80–91 (in Russian).
- Sturges H. (1926). The choice of a class-interval. J. Amer. Statist. Assoc., 21, 65–66.
- Theil H. (1967). Economics and Information Theory. Amsterdam: North-Holland.
- Theil H. (1979). The measurement of inequality by components of income. Economics Letters, 2(2), 197–199.
- Zubarevich N.V. (2014). Regional development and regional policy in Russia. EKO=ECO, 4(478), 6–27 (in Russian).
- Zubarevich N.V., Safronov S.G. (2014). Spatial inequality of income in Russia and large post-Soviet countries. Regional'nye issledovaniya, 4(46), 100–110 (in Russian).
