Software development for assessment of the vegetation cover changes using the Earth remote sensing data

Author: Kovalev Anton V., Markov Nikolay G., Tokareva Olga S.
Journal: Журнал Сибирского федерального университета. Серия: Техника и технологии @technologies-sfu
Article in issue: 8 т.11, 2018.
Free access
The article presents the results of software development for predictive maps modeling of the earth’s surface processes based on time-varying satellite data using the probabilistic and spatial characteristics of various types of the earth’s surface in the image. The analysis of existing methods for the assessment and modeling of the state of landscapes of various territories using satellite Earth monitoring data is presented. The review of existing systems of the earth’s surface dynamics analysis and their main advantages and disadvantages is given. The cellular automata method was used to implement the forecast. This method allows complex systems modeling using a simple set of rules and is the most convenient and accurate method for working with a space images. Algorithms and basic modeling parameters for using this method are described. The developed software makes it possible to forecast the state of the surface of the territories under consideration based on a series of time-varying data, and also to specify various modeling parameters in order to improve the accuracy of forecast maps. The results of the developed software testing with MODIS and Landsat data are presented, the accuracy of the forecast and the influence of simulation parameters on the result were estimated.
Earth remote sensing, cellular automata, modeling and forecast of landscape changes, space images
Short address: https://sciup.org/146279559
IDR: 146279559 | UDC: 004.415:581.9:528.8 | DOI: 10.17516/1999-494X-0114
Программное обеспечение для оценки динамики состояния растительного покрова с использованием данных спутникового мониторинга Земли
В статье изложены результаты разработки программного обеспечения для построения прогнозных карт развития процессов на земной поверхности на основе разновременных данных спутникового мониторинга с использованием вероятностных и пространственных характеристик различных типов земной поверхности на изображении. Представлен анализ существующих методов для оценки и моделирования состояния ландшафтов различных территорий с использованием данных спутникового мониторинга Земли. Приведен обзор существующих систем анализа динамики земной поверхности, их основных достоинств и недостатков. Для разработки использован метод клеточных автоматов, который позволяет моделировать сложные системы с помощью простого набора правил и является наиболее удобным и точным методом для работы с аэрокосмоснимками. Описаны алгоритмы и основные параметры моделирования, необходимые для использования данного метода. Разработанное программное обеспечение позволяет производить прогноз состояния поверхности рассматриваемых территорий на основе серии разновременных данных, а также задавать различные параметры моделирования с целью повышения точности прогнозных карт. Приведены результаты тестирования разработанного программного обеспечения на данных MODIS и Landsat, произведена оценка точности прогноза, влияния параметров моделирования на полученный результат.
Text of the scientific article Software development for assessment of the vegetation cover changes using the Earth remote sensing data
The purpose of this work is the development of software for assessing the dynamics of the vegetation cover state using the Earth monitoring data.
There are three main types of models of the earth’s surface representation used in forecasting the state of territories: generalized models, distributed and mosaic models, in which the earth’s surface is represented as a two-dimensional raster matrix, where each pixel carries information in the form of spatially-distributed elements. A number of heuristic methods based on the mosaic model were created. These methods were designed to determine the shapes and state of objects in the image. The most famous among them are the methods of the ant algorithm, the particle swarm, etc [4]. Fuzzy methods (genetic algorithms, simulation annealing, their joint use) are also often used. They assume the use of transitional functions, which are constructed depending on the input variables [4].
Based on the described methods, several modeling systems for the Earth’s surface have been created: LANDSUM, SIMPPLLE, VDDT and IDRISI 32 [1]. LANDSUM and its predecessor CRBSUM have been developed as research tools for the analysis of forest fires, and use stochastic and spatial models. SIMPPLLE simulates vegetative models and surface processes. Allows modeling crops, diseases of woody plants, insects and fires. SIMPPLLE is also a stochastic and spatial simulation system. VDDT is a dynamic tool for assessing of the vegetation development. The modeling processes can include the stages of vegetation growth, harvesting, spread of pests, diseases and fires. A structural classification system is used. The spatial version of VDDT is known as Telsa (a tool for the landscape exploration) [1]. IDRISI32 developed by the University of Clark Labs in the US, has a wide range of modules, including the classification and modeling of vegetation in the area in question. It is worth noting that the described modeling systems do not allow to increase or edit the inherent functionality, which necessitates the development of own software for the development and improvement of the created modeling methods by adding new parameters, as well as improving and evaluating the effectiveness of existing ones.
Methodical issues of forecasting changes in the earth’s surface
The significant spatial heterogeneity of the studied landscapes, their dynamism and large area make it necessary to use flexible methods suitable for complex spatial dependencies modeling, which are an important characteristic of many types of terrestrial surface.
At present, one of the most interesting ways to take spatial correlation into account is the use of cellular automata (CA). A characteristic feature of the CA is the modeling of complex systems using a simple set of local rules. This opportunity attracted researchers from various disciplines, such as physics, biology, social sciences, transport, logistics [5]. CA is a mathematical idealization of physical systems, in which the structure of image is divided into lattices of cells whose states are updated synchronously in discrete time according to some local rules. One of the key factors for the earth’s surface changes modeling is the determination of the rules for the CA operation in each specific case. To solve this problem, a probabilistic approach to the determination of the rules of CA functioning is applied, in which these rules are formed on the basis of two principles. The first principle declares the use of a priori information about the probability of development (degradation) of each type of the earth’s surface in the study territory (represented in the form of accordance probability maps). The second principle declares the use of the probabilistic and spatial characteristics of each type of the – 924 –
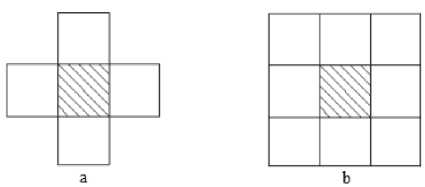
Fig. 1. The neighborhoods of Neumann (a) and Moore (b)
earth’s surface (the dependence on the “neighbors” of the point under consideration and the saturation criterion) when forming the CA functioning rules.
As a result, the method of cellular automata allows to take into account the spatial correlation of data and a number of space-probabilistic features of types (classes) in the investigated territory in order to obtain accurate predictions and dynamics of changes in the earth’s surface [6]. The analysis of dynamics based on the developed models allows to more accurately predict and evaluate the state of the Earth’s surface. A cellular automaton consists of a grid of cells, usually distributed in a matrix form, which has the following main characteristics: states, neighborhood, transition function, rules, iterations. When working with satellite images, it is necessary to consider each pixel of the image as a cell of the cellular automaton, which uses 4, 8 or 24 of its “neighbors” (Fig. 1).
To change the state of the cell, the rules of the transition function are applied iteratively, considering the neighborhood state. Since the pixel always changes its state through different iterations, the cellular automata have an evolutionary process. Normally, the transition rules are the same for all cells and apply immediately to the entire grid [7]. The described CA properties tell us that they are a convenient tool for working with elements of spatial data and modeling the state of the environment.
To obtain forecast maps for the initial space images, a multi-stage approach to the analysis of the dynamics of the earth’s surface was used. The functional diagram of the multi-stage approach is presented in Fig. 2.
At the first stage, the user needs to determine the time interval between space images of the territory. In this case, the main problem is the selection of suitable images, since there is interference in the form of clouds on the images. It is also important to determine the number of classes for classifying an image, which is based on the number of classes needed to unambiguously identify the necessary objects in a satellite image. Classification of images can be performed using specialized image processing software or any GIS that contains functionality for supervised or non-supervised classification of images. At the third stage, the main parameters of modeling are determined. First, it is necessary to calculate the matrix of actual transitions, which contains information on the number of actually transferred elements of one type of terrestrial surface in another for the next time interval.
A stochastic matrix is formed using the expression [6]:
n ij m
P V = m , ^Pij = 1, I = 1, K , m , (1)
Z ny ~
.j = 1
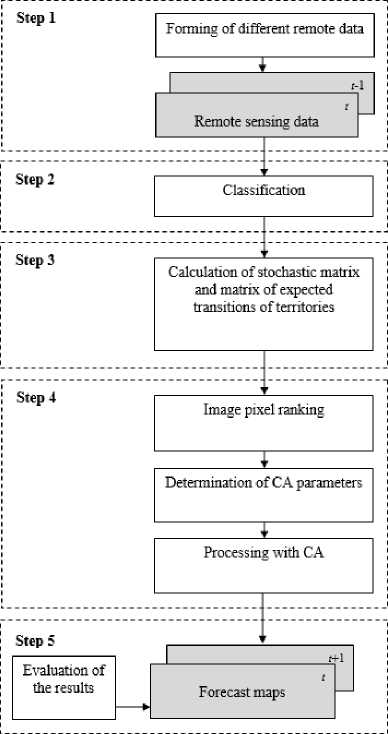
Fig. 2. Functional diagram of a multi-stage approach where nij is the number of elements that have passed from the state Qi into the state Qj, m is the number of possible combinations (classes).
The resulting stochastic matrix is responsible for the probabilistic component of changes in the earth’s surface. The matrix of excected areas M exp (or a matrix of expected transitions) is responsible for the quantitative changes occurring on the earth’s surface. This matrix is calculated as the product of the multiplying of actual transitions matrix to the stochastic matrix:
M = M , , x M . . (2)
exp actual stoch
At the fourth stage, it is necessary to calculate the ranking matrix, which allows us to convert initially the elements of the image with the highest probability of transition to a particular class (the greater the probability of the current pixel transition, the greater the sequential number). After the ranking matrix calculating, for each element of the image in the predetermined above order, a square neighborhood of a given size is formed. Each such neighborhood will be a separate spacecraft. Further, according to the predetermined rules of the spacecraft functioning, each element of the simulated image is formed. The method stops when all the elements according to the matrix of expected transitions are passed to the elements of the corresponding types. In this algorithm, we consider the use of two probabilities for obtaining the resulting one [6]:
p je = f ( p ' , pF )^ (3)
The probability of transition of the i-type of terrestrial surface to the j-type depends not only on the total probability, but also on the number of elements of type j in this neighborhood.
p j - ni ■ p j j - 1 . K . m . (4)
where m is the number of types of terrestrial surface in the neighborhood, nj is the number of elements of type j in the analyzed neighborhood.
To calculate the spatial characteristics, a local and global saturation criteria were used. Their value is defined as the ratio of the frequency of occurrence of a particular type in the neighborhood to the occurrence of this type in the image as a whole [6]:
F _ n k, d, i / n d, i i , k , d N N ,
k where nk,d,i is the number of the considered type elements in the neighborhood, nd,i is the number of all elements in the neighborhood, Nk is the number of specific type elements on the whole image, N is the number of all elements of the image.
The method for the saturation criterion of the average characteristics calculating for each type of earth’s surface is presented below:
F-kd - logHZF.» |.
V Nl . eL where L is a set of elements of type l on the image, Nl is their quantity.
After that, the probability p spat for each class in the considered image is calculated as: , p-a -i-VF.k, -F.tj.
The resulting probability is calculated according to the formula: res prob spat p ij p ij + p ij .
Results
The basis of the developed modeling system is not only the implementation of algorithms for the environment simulation, but also several additional sub-systems for the available data set processing, the data loading into the system and the resulting data saving (Fig. 3). A number of third-party software is also used. A database management system ( DBMS ) is used for storage and efficient data operation, geographical information system (GIS) is for data classification, processing and visualization (Fig. 3).
For software development, the C# programming language, the Windows Forms API, and the GDAL library were chosen. GDAL is used to read and write raster geo-spatial data formats.
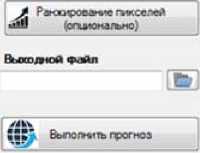
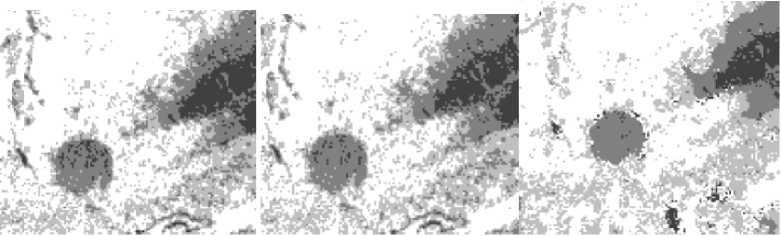
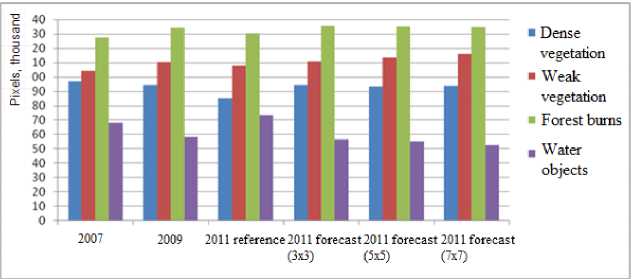
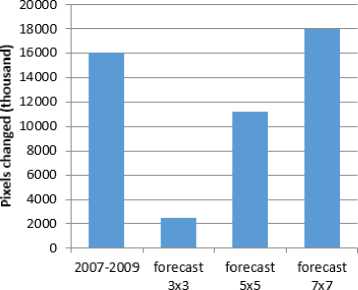
The main window of the program is shown in Fig. 4. To carry out the forecast, the user should to open different pictures, select the size of the neighborhood, the number of iterations and, if necessary, – 927 – lnterfa : The forecasting : subsy: tern ■ 4 / Fig. 3. Scheme of the software package Выберите ncprwiА Фрагмент ™^ tmiya»7_dj*<4 fW] HFA Erdas knagrw lm< ;«(mg) Разрешение 678x588 Количество Качалов 1 Проекте PROJCSFUTM Zone 44 r;ythem Hemisphere GEOGCStWCS 84". DA ' UMfWGS.ia64' SPHEROID PWGS Выберите второй Фрагмент »e*we\NDVlx2009_d_ndvt mg [ ^] HFA Erdas Vnagr* Images (mg) Ко.-етчество кмалов 1 Г^офох* PROJCSrUTM Zone 44 Northern Hemtsphere'.GEOGCSrWGS 34’DATUMTWGS 19847SPHEROIO TWOS 84" .6378137.298 257223563AUTHOR! TYp EP SG'. "70304].TO WGS84 [0.0.0.0.0.0.01AUTHORITY rEPSG"-6326-nPRlMEM Third-Party Environmental modeling system ^ s Subsystem for loading and saving data FixeI ranking suljsy:stem Simulation parameters calculate°n subsystem Выбейте размер oepeciwoc™ KA 5 IT- P«™p=«™ Задайте когмчество итераиИ! j : Котметвоитерме Fig. 4. The main window of the program perform pixel ranking of the image. The size of the neighborhood shows how many pixels will be used to create the cellular automaton. The number of iterations sets the time interval for which the forecast will be made. For example, if the input data set contains images for 2015 and 2016 with the same date, the number of iterations should be set to 1 for the next time interval forecast (2017). The MODIS data with a spatial resolution of 500 meters of the Yugansky natural reserve territory with calculated values of the normalized difference vegetation index (NDVI) were used. The use of this area allowed minimizing the impact of anthropogenic factors on the vegetative state changing. Landsat images with a spatial resolution of 30 m on the territory of the forest complexes of the Tomsk region were also used. For the Landsat data, NDVI value maps were obtained. An important task in modeling was to determine the number of classes for the image classifying. Based on the state of the forecasting territories, it was decided to divide the image into 4 classes, because in this case it allowed to determine the main types in the investigated area (dense vegetation, weak vegetation, forest burns, water objects). The forecast of the territories changing using the Landsat data was made with a use of two images for 2007 and 2009. The image for 2011 was used as a reference for estimating the accuracy of the forecast. Classification of the presented images was carried out in ERDAS Imagine using the tool of non-supervised classification. The classification matrix for Landsat data was used to obtain the matrix of actual transitions (Table 1), which allows to calculate the matrix of expected transitions (Table 2) and the stochastic matrix (Table 3), which shows the probability of transition of the image class to a new state. Local saturations for each pixel of the Landsat image were also calculated. Based on this information, the averaged values of the saturation criterion for the image were obtained (Table 4). On the basis of the presented matrices, the spatial and probabilistic (formulas 4 and 7 respectively) components of the pixel transition into a new state for each pixel were obtained. As a result, the resulting probabilities (formula 8) and the prediction map for Landsat images were constructed. To illustrate the results, Fig. 5 presents the forecast image for 2011. Table 1. The matrix of actual transitions Type/Type Dense vegetation Weak vegetation Forest burns Water objects Dense vegetation 90105 2504 3022 0 Weak vegetation 323 94574 8455 0 Forest burns 5189 3285 117983 0 Water objects 0 0 10199 57893 Table 2. The matrix of expected transitions Type/Type Dense vegetation Weak vegetation Forest burns Water objects Dense vegetation 84971 4714 5947 0 Weak vegetation 975 86744 15633 0 Forest burns 9738 6205 110514 0 Water objects 418 265 18187 49222 Table 3. The stochastic matrix Type/Type Dense vegetation Weak vegetation Forest burns Water objects Dense vegetation 0,9415 0,0260 0,0324 0,0 Weak vegetation 0,0034 0,9148 0,0818 0,0 Forest burns 0,0410 0,0260 0,9330 0,0 Water objects 0,0 0,0 0,1498 0,8502 Table 4. The averaged values of the saturation criterion Type/Type Dense vegetation Weak vegetation Forest burns Water objects Dense vegetation 1,6291 0,3786 -1,8298 -3,2798 Weak vegetation 0,3761 1,2081 0,0582 -1,4638 Forest burns -1,8044 0,0724 1,1580 0,4586 Water objects -3,5831 -1,5226 0,4679 1,9472 a b c Fig. 5. Landsat image fragment for 2007 (a), 2009 (b), forecasted 2011 (c) To work with MODIS data, MOD13 500 meter resolution images (Vegetation Indices 16-Day L3 Global 500 m) for 2000-2008 with an interval of 2 years were selected [2]. These data were obtained by means of 16 days’ composition. Using the tools of the ERDAS Imagine system, the necessary sections of the Yugansky natural reserve were cut out. Further, each of the areas under , the study was also divided into 4 classes (dense vegetation, weak vegetation, forest burns, water objects), the necessary parameters for the earth’s surface modeling were calculated and a forecast was made. Research of software and method effectiveness Analyzing the fragments of Landsat space images presented above, we can conclude that in 2009 there was an increase in NDVI values in comparison with 2007, which indicates an increase in the biomass of vegetation (development of vegetation cover). Looking at the forecast map for 2011, we can say that this trend has been preserved. Elements of the image were not simply transformed by the general probability for the whole image, but depending on the local characteristics (environment) of the pixel data, that is, the trends of the changes in the considered territories were reflected in the obtained forecast maps. To compare the obtained forecast maps with reference images, a k index was added. This index shows the ratio of the number of identical pixels on both images to the total number of pixels (Table 5). In accordance with the given forecast values, we can say that the highest accuracy corresponds to the forecast map obtained from Landsat images (about 88 percent). The result can be explained by the fact that a larger number of pixels were considered in forecasting the Landsat data, which means – 930 – that the spatial component of the transition probability (the saturation criterion) was calculated from a larger sample. For the resulting forecast maps by MODIS data, the average NDVI for the Yugansky natural reserve was obtained. The results of NDVI calculation in Table 6. The average NDVI values for the reserve differ from the reference ones insignificantly (about two percent for 2004 and 4.5% for 2008), which also indicates the high accuracy of the forecast. To estimate the effect of the cellular automata degree on the accuracy of forecast maps, the number of each class pixels for the resulting (forecast) and original Landsat images was calculated. The neighborhoods of 3x3, 5x5 and 7x7 were chosen, because with a higher values of the neighborhood size, the complexity of the used algorithms increases significantly (Fig. 6). According to the results, we can see that the trends in the state of each type of earth's surface in the period from 2007 to 2009 are preserved on all images, except the reference one, which has the greatest deviation. Most clearly, the trends are traced for the 7 CA degree. The closer the number of pixels that have moved to the new class on the forecast image, to the pixels count that changed their values in the previous time interval, the greater the accuracy of the forecast. The most approximate number of pixels that have moved to a new class refers to the power of 7 (Fig. 7). Table 5. Estimation of forecast accuracy Image/Characteristic N identical N total k Landsat 2011 349385 397399 0,879 MODIS 2004 21914 25900 0,846 MODIS 2008 19874 25900 0,767 Table 6. MODIS NDVI values Area/Year — 2000 2002 2004 2006 2008 2004 (forecast) 2008 (forecast) Yugansky natural reserve 0,77025 0,77748 0,77517 0,77273 0,76615 0,77384 0,76957 Fig. 6. The chart of the number of pixels per class Estimated data Fig. 7. Diagram of the changed pixels number Conclusion The paper presents the results of software development for the dynamics and forecast assessing of the state of vegetation cover using the Earth remote sensing data. The results of the methods analysis for estimating the dynamics of vegetation cover, existing analogues, are presented. Algorithms for predictive maps obtaining with a use of the theory of cellular automata methods and satellite data are considered and implemented. Results of testing of the developed software and estimation of the forecast maps, obtained to the territories occupied by the forest complexes are given. The forecast maps obtained with the help of the developed software are of high accuracy and reflect the main trends of vegetation development in the territories under consideration. However, it is worth noting that the forecast of the state of the vegetation cover is quite a difficult task and, for more accurate prediction, it is necessary to take into account a number of other characteristics (wind direction, relief, climatic conditions, etc.) in the form of adding additional probabilities as a correspondence map. Using such characteristics will require the modification of the implemented methods and development of new functionality for their incorporation, but this will help to solve a wider range of problems and increase the reliability of the obtained results.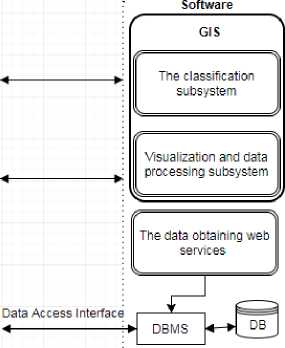
References Software development for assessment of the vegetation cover changes using the Earth remote sensing data
- Barrett Т.М. Models of Vegetative Change for Landscape Planning: A Comparison of FETM, LANDSUM, SIMPPLLE, and VDDT. Gen. Tech. Rep. RMRS-GTR-76-WWW. Ogden, UT: U.S. Department of Agriculture, Forest Service, Rocky Mountain Research Station, 2001, 14 p.
- Kovalyov A.V., Tokareva O.S. Using MODIS NDVI products for vegetation state monitoring on the oil production territory in Western Siberia. MATEC Web of Conferences. 2016. 48, Article number 05003. 1-4 DOI: 10.1051/matecconf/20164805003
- Langley S.K., Cheshire H.M., Humes K.S. A comparison of single date and ultitemporal satellite image classification in a semi-arid grassland. Journal of Arid Environment, 2001, 49, 401-411.
- Mantelas L.A. et al. A fuzzy cellular automata modeling approach -accessing urban growth dynamics in linguistic terms, Computational Science and Its Applications -ICCSA 2010, 2010, Proceedings, Part I, 140-151.
- Bochenek B., Tajs-Zielinska K. Topology optimization with efficient rules of cellular automata, Engineering Computations, 30(8), 2013, 1086-1106.
- Замятин А.В., Марков Н.Г. Анализ динамики земной поверхности по данным дистанционного зондирования Земли. Москва: Физматлит, 2007. 176 с.
- Moises Espinola, Roza Ayala, Cellular Automata Applied in Remote Sensing to Implement Contextual Pseudo-Fuzzy Classification, Cellular Automata for Research and Industry 2010, 312-316.
