Some issues of interpretation of gas-hydrodynamic studies of wells

Author: Sadiev R.R., Boqopolskiy V.
Journal: Мировая наука @science-j
Section: Основной раздел
Article in issue: 5 (98), 2025.
Free access
To analyze and regulate the development of gas and gas condensate fields, it is necessary to have information about the production capabilities and filtration parameters of the reservoir. For this purpose, the pressures, temperatures, and flow rates of wells, filtration resistance coefficients, and reservoir parameters under non-stationary gas filtration conditions were determined. The existing methods of processing well research results under non-stationary conditions are analyzed here. Calculation methods and their implementation for determining reservoir parameters from pressure recovery curves are presented. Using the identification method, productivity coefficients, filtration resistance coefficients, and parameters of gas and gas condensate wells were determined along the pressure recovery curve.
Filtration parameters, filtration models, well studies, identification
Short address: https://sciup.org/140311517
IDR: 140311517 | UDC: 622.276.652
Text of the scientific article Some issues of interpretation of gas-hydrodynamic studies of wells
Hydrodynamic studies of wells are based on various mathematical models depending on the type of reservoir and various thermodynamic conditions of gas-liquid systems.
Not always, especially in the initial period of field development, the existing field information is sufficient to select a filtration model that takes into account the degree of uniformity of the reservoir, the properties of fractured-porous reservoirs, relaxing properties of gas-liquid systems, the phenomenon of creeping deformation of soils, etc.
At the same time, the selection of models and the assessment of the corresponding reservoir parameters have to be carried out only on the basis of data from hydrodynamic studies.
In this regard, the task of constructing diagnostic procedures is of particular importance, allowing with a certain degree of reliability to select the correct mathematical model for interpreting pressure recovery curves directly from hydrodynamic research data.
The intensive development of the oil and gas industry requires increasing the efficiency of oil, natural gas and condensate production processes, increasing reservoir component recovery, and improving the development and operation of oil and gas fields. In addition, correct analysis, generalization of information, reliable forecast of gas and condensate production, well flooding and other indicators of oil and natural gas field development, and calculation of recoverable gas and oil reserves are important. Analysis of geological and field data on the technological regime of offshore gas and gas condensate wells shows that the normal operation of production wells is disrupted for a number of reasons, and this leads to a decrease in their productivity.
Using the results of the analysis of data on technological regimes, it was found that the most significant factors affecting the regime of production wells are:
-
- destruction of the bottomhole zone of wells;
-
- formation of sandy-liquid plugs;
-
- irrigation of wells with plantar water;
-
- formation of gas hydrates in the borehole.
Statement of the problem
The purpose of this work- is to interpret hydrodynamic studies, when processing the data obtained as a result of the research, the most accurate and acceptable method for correctly predicting the operating mode of the well is determined.
The studies are divided into 2 types - basic (reference) and point-based Basic studies include those studies that are carried out with stationary filtration using at least five study modes.
Point studies are studies conducted with stationary filtration in one or two modes. When performing the next point analyses, the results are compared with the indicator curve that was obtained during these studies. If the results of the point experiments (the difference between P r – P wf ) for a given flow rate differ by more than ten percent, the data obtained are not reliable and then the well must be investigated using the method of reference studies.
The technology of finding the coefficients of filtration resistance according to the indicator curve, based on the parameters of well operation, is as follows:
-
- 6 – 8 stages of its operation with different modes are selected from the available parameters of the production well. For each mode, they find Р r , Р wf , and Q . In this case, the Р r is calculated from the Р st at the mouth, and the Р wf is determined by the constant column of gas in the annular space.
According to formula (1), the selected mode is processed:
P 2 - P If = aQ + bQ 2
In the process of comparing with the results of previous studies, it is possible to determine the constancy of the operating characteristics of the well and prove that
-
- there is no destruction in the bottom-hole zone of the well,
-
- there is no flooding of the gas-bearing reservoir with contour water,
-
- the degree of saturation of the reservoir fluid does not actually change.
At the exploration stage, a sand-liquid plug may form at the bottom of the well. If a sand plug has formed in the well, this may indicate that the well is imperfect in terms of the degree of opening. For the most part, during the exploration of wells, the plug is destroyed, since due to depression on the formation, the height of the plug decreases, and therefore the coefficients a and b.
All this leads to a deformation of the indicator line. Based on experiments, it has been revealed that if the flow velocity is greater than 2 m/s, then the rock particles will be carried to the surface.
Figure 1 shows a view of the height of the plug created by quartz sand with a diameter of 0,05 ⋅ 10-3 to 0,2 ⋅ 10-3.
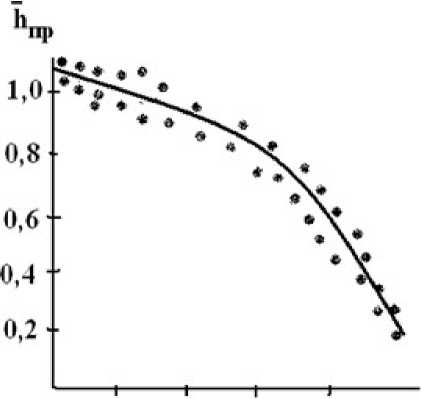
0 1 2 3 4 v.m/c
Fig.1 The height of the plug created by quartz sand diameter
Filtration of suspensions through porous media in real conditions is accompanied by the manifestation of hysteresis phenomena. In particular, the patterns of fluid filtration towards the reservoir and towards the well are different, all other things being equal. Sometimes a well that pours liquid well has extremely low pick-up. Hysteresis phenomena are also observed when working with cores. Similar phenomena remain unexplored to this day.
All this necessitated experimental studies of the processes occurring in porous media during filtration of water with suspended solids. The studies were carried out under various characteristics of parameters such as the concentration of suspended particles in the suspension, their size and shape, the permeability of the porous medium, and the size of the pore channels under various filtration modes.
The research results showed that even in the conditions least favorable for the coloration of a porous medium (suspended particles in the suspension had a rounded shape, particle sizes were many times smaller than the pore sizes), core permeability decreases. Moreover, this process is irreversible, i.e. it is not possible to achieve a complete restoration of the initial value of water permeability. This can be explained by the tortuous configuration of the pore channels and the variability of their cross-section, which is confirmed by the quantitative determination of the particle content along the length of the sample.
Experimental studies have also made it possible to establish that attenuation of pick-up can occur at any content, size and shape of suspended particles in the injected water with varying degrees of hysteresis phenomena.
The technique of removing pressure recovery curves.
Several well research methods are discussed below. Pressure recovery curves are processed by various methods, determined by the operating mode of the well before stopping. Two types of boundary conditions are used: an infinite reservoir and a limited reservoir with constant pressure on the contour when solving dependencies describing the pressure recovery process.
For an infinite reservoir, the processing of recovery curves, depending on the operating mode of the well before shutting down, is carried out using the following methods.
If the operating time of the well T before removing the recovery curves is much longer than the pressure recovery time t (sufficient T — 20 t), then the curves are processed according to the formula:
p2=a+e lg t
a=PI o+в Ig^-+bQ22 Rc.пр
kpпл
X =
mμ where Pз.o and Pз are the initial (before stopping) and the current pressure at the bottom, respectively, kgf/cm2;
t - is the current pressure recovery time,s;
Q 0 well productivity before shutdown, cm3/s;
X — piezoelectric conductivity coefficient, cm2/s;
m - porosity, fraction of a unit;
b - coefficient of the binomial formula;
h - effective reservoir capacity, m в = 2,3 Q 0 РплТЛлРат
2 π khT
ст where ^пл viscosity of gas in reservoir conditions, sPz;
Z пл - is the coefficient of super-compressibility of gas pпл at reservoir temperature;
Tcm = 293 К; P am = 1 , 033 кгс / см2
To process the pressure recovery curve (PRD) according to formula (2), it is plotted in coordinates рз from lg t

Figure 2. PRD processing according to formula (2)
PRD processing in the case of comparability of the operating time of the well before stopping T with the recovery time t ( T < 20 t ) is carried out according to the formula:
T +1
p 3=P™ - в lg-— t (5)
The application of formula (2) in this case distorts the final section of the reservoir and can lead to erroneous conclusions about the parameters of the reservoir and its uniformity.
In this case, to determine the PRD β coefficient, it is plotted in coordinates:
p 3—lg ~ t.
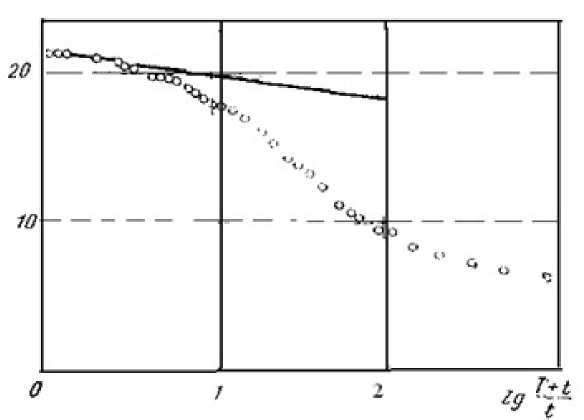
Figure 3. CVD processing according to formula (5)
For a limited reservoir, the recovery curves are plotted in coordinates (Fig.4)
Ц (Рм -pl)
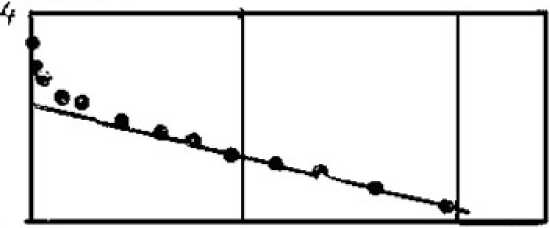
tiolt
Figure 4 Processing of CVD in a limited reservoir
The proposed comparative methodology allows for a more accurate interpretation of the results of well and reservoir research in order to select optimal operating modes for gas wells.
Conclusion
-
1. The factors influencing the character and shape of the indicator curves are analyzed.
-
2. The methods of constructing the CVD for various periods of well operation before testing are presented.
