Состав некоторых железных руд и возможность их использования в производстве цемента (западный регион Монголии)
Автор: Цэренханд Б., Санжаасурен Р., Солонго П.
Журнал: Вестник Бурятского государственного университета. Философия @vestnik-bsu
Рубрика: Химия
Статья в выпуске: 3, 2014 года.
Бесплатный доступ
Изучен химический и минеральный состав некоторых железистых руд в западном регионе Монголии. Исследован эффект использования фторида кальция на температурное разложение кальцита в сырьевой смеси для получения цементного клинкера. Результаты показали, что оксид железа в железных рудах Западной Монголии Увгондацан (Ховд) составляет 87,23%, Зуул хар (Ховд) - 85,00% и Харгант (Увс) - 82,29%. Железистые руды Харганата и Увгандацана содержат в основном магнетит, в то время как железистая руда Зуул Хара - гематит. Температурное разложение кальцита уменьшилось на 5, 10 и 15 oC при использовании фторида кальция с смеси, содержащей цементный клинкер известняка «Шохойт», глины «Шол» и железистой руды «Харгант» с добавками 0,5%, 1,0% и 1,5%.
Магнетит, коэффициент насыщения, цементный клинкер, железистая руда, гематит
Короткий адрес: https://sciup.org/148182370
IDR: 148182370 | УДК: 666.9
Текст научной статьи Состав некоторых железных руд и возможность их использования в производстве цемента (западный регион Монголии)
Iron ore is a mineral that contains high Fe 2 O 3 and a mixture of alumosilicates. In order to reduce module of Alumina in cement production, minerals that have high iron containment are used [1, 2]. Minerals such as magnetite (Fe 2 OyFeO), hematite (Fe 2 O3), limonite (P-FeO(OH)), goethite (a-FeO(OH)), lepidocrocite (P-FeO(OH)), siderite (FeCO 3 ) and ilmenite (FeTiO 3 ) are contained in iron ore. As a result of the geological survey in Mongolia, approximately 200 iron ore mine were explored. The main objective of the study is to determine the chemical and mineral composition of the Western Mongolian iron ores and to investigate possibilities to use them in raw mix for obtaining cement.
Iron ores from “Kharganat” in Uvs aimag and “Suul Khar”, “Uvgundatsan” in Khovd aimag, and chemical pure calcium fluoride were used in this research. “Kharganat” iron ore deposit is located 45 km northwest from the center of Naranbulag soum and 3.2 km from lake Sharburd. The deposit length is 1200 m and width is 12-30 m. The geographic coordinates of Kharganat iron ores are 49o37/00// (north latitude) and 92o11/00// (east longitude). “Uvgundatsan” iron ore is located 105 km from Khovd city and 60 km northwest from Myangad soum. The geographic coordinates of Uvgundatsan iron ores are 48o24/24// (north latitude) and 91o51/00// (east longitude). “Suul Khar” iron ore is located 22 km from Khovd city and 45 km from Buyant soum. The geographic coordinates of Suul khar iron ores are 47o51/00// (north latitude) and 91o48/00// (east longitude). Chemical pure calcium fluoride (CaF 2 ) is used to study the effect of a mineralizing agent on the decomposition temperature of calcite in raw mix for obtaining cement clinker.
Experimental procedure
We used standard methods for taking and preparing samples. The mineral composition of raw materials was determined by X-Ray diffraction (XRD) and thermal analysis (TG/DTA); the chemical composition was determined by X-Ray fluorescence (XRF) analysis and calculation of cement raw mixture by Kinds method [1-3].
Results and discussion
Chemical composition of iron ores. The chemical composition of iron ores was determined by energy disperse X-ray fluorescence (ED-XRF) analysis. Table 1 shows that contents of iron oxide (Fe 2 O 3 ) in the Western Mongolian iron ores such as “Kharganat”, “Uvgundatsan”, “Suul Khar” are higher than in “Tumurt” (№4) iron ore, which is presently used in cement production.
Chemical composition of iron ores, %
Table 1
|
Iron ores |
SiO 2 |
Al 2 O 3 |
Fe 2 O 3 |
CaO |
Mn 2 O 3 |
MgO |
SO 3 |
Na 2 O |
K 2 O |
Loi |
Σ |
|
№1 |
7.07 |
1.02 |
89.29 |
0.53 |
- |
0.15 |
1.02 |
1.02 |
0.01 |
- |
100.11 |
|
№2 |
9.684 |
1.164 |
87.227 |
1.408 |
0.129 |
- |
- |
- |
- |
1.18 |
99.995 |
|
№3 |
3.945 |
0.671 |
85.002 |
0.485 |
- |
0.001 |
- |
0.003 |
0.004 |
9.88 |
100.001 |
|
№4 |
8-20 |
0.5-4 |
58-74 |
1.8-6 |
- |
3.5-7 |
2-7 |
8.5-20 |
0.5-3.6 |
2-7 |
№.1 “Kharganat” in Uvs aimag, №.2 “Uvgundatsan” in Khovd, №.3 “Suul Khar”in Khovd, №4 Tumurt
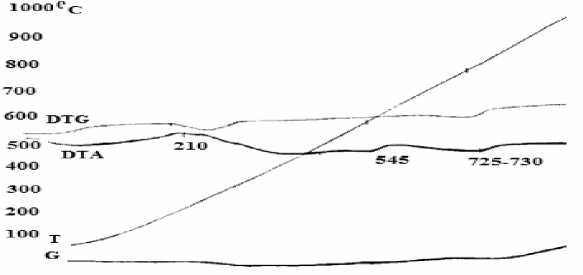
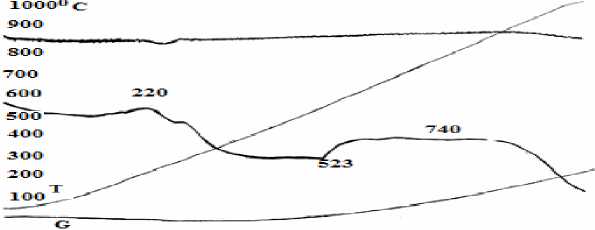
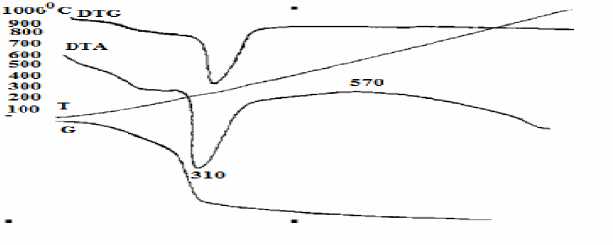
Mineral composition of iron ores. DTA/TG studies. The mineral composition of iron ores was investigated by TDA analysis. TG/TDA were undertaken. Derivatograph Q-1500, Hungary, thermo analyzer at a heating rate of 10oC/min using a-Al2O3 was used as a reference material. The results are shown in the Fig. 1-3.

Fig. 1. DTA/TG curves of the “Kharganat” iron ore
From Fig. 1, we can see that:
-
1. A small amount of heat was emitted due to the water evaporation in β-limonite [β-FeOOH) as in the case of β-Fe2O3∙H2O] at 210oC. At this point, sample weight was reduced by Δm = -4.5 mg ~ 0.3% and it can be calculated from weight loss curve. Iron oxide in β-limonite amount to 2.67% [4].
-
2. Heat absorption was observed due to the γ-iron oxide (γ-Fe 2 O 3 ) in lepidocrocite composition (γ-FeOOH) as well as (γ-Fe2O3∙H2O) was transformed into α -hematite ( α -Fe2O3) at 545oC. At this point, sample weight was reduced by Δm = -3.0 mg ~ 0.2% and it can be calculated from weight loss curve. Iron oxide in lepidocrocite amount to 1.78%
-
3. Heat absorption occurred due to transformation of α -hematite into β-hematite at 725oC. In this transformation phase, sample weight increased by Δm =19 mg ~ 1.27%. The reason is that, during the process of α-Fe 2 O 3 to β-Fe 2 O 3 , density increases from 3.3 to 4.28 mg/cm3 [4].

Fig. 2. DTA/TG curves of the “Uvgundatsan” iron ore.
From Fig. 2, we can see that,
-
1. A small amount of heat was emitted due to the water evaporation in β-limonite [β-FeO(OH), as β-Fe 2 O 3 ∙H 2 O] at the 220oC. At this point, sample weight was reduced by Δm = -4 mg ~ 0.2% and it can be calculated from weight loss curve. Iron oxide in limonite amount to 1.87% [4].
-
2. Heat absorption was observed due to the β-iron oxide (β-Fe 2 O 3 ) in lepidocrocite composition (γ-FeOOH) as well as γ-Fe 2 O 3 ∙H 2 O) transformed into α -hematite ( α -Fe 2 O 3 ) at 523oC. At this point, sample weight was reduced by Δm = -3 mg ~ 0.15% and it can be calculated from weight loss curve. Iron oxide in lepidocrocite amount to 1.4% [4].
-
3. Heat absorption occurred due to the transformation of α-hematite into β-hematite at 740oC. In this transformation phase, sample weight increased by Δm =25 mg ~ 1.316%. The reason is that, during the process of α-Fe2O3 to β-Fe2O3, density increased from 3.3 to 4.28 mg/cm3.
From Fig. 3, we can see that,
-
1. A deep endotherm peak was formed due to the hydro-hematite water evaporation at 310oC. At this point, sample weight was reduced by Δm =110 mg ~ 7.38% and it can be calculated from weight loss curve. Iron oxide (Fe 2 O 3 ) in hydro-hematite amount to 65.601% [4]
-
2. An exothermic effect occurred due to the process of γ-Fe 2 O 3 to α-Fe 2 O 3 in magnetite composition at 570oC. In this transformation, sample weight reduced at m = -14 mg ~ 0.9395%. The reason is that, during the process sample density decreased from 4.28 to 3.3 mg/cm3.

Fig. 3. DTA/TG curves of the“Suul Khar” iron ore.
X-ray studies. X-ray diffraction (XRD) analysis was conducted by DRON-2 tool with iron cathodes and voltage of X-ray tube on 30 kV, ampera at 20 mA, width of slot at 1x10/0,25x6. Spacing between diffracting, which was minerals set, were calculated using ASTM card and directory and results are shown in the Fig. 4-6.
Fig. 4 showed that there are high intensity diffraction lines of magnetite at d=2.53 Å, medium intensity magnetite lines at d=2.95; 2.09 Ǻ, medium and low intensity diffraction lines of hematite at d= 4.88; 3.68; 2.69; 2.205 Ǻ and low intensity diffraction line of goethite at d=3.34 Ǻ; as in Fig. 5, which is for “Uvgundatsan” iron ore, there high and medium intensity diffraction lines of magnetite at d=4.85, 2.97, 2.72, 2.53, 2.41, 2.09, 1.71, 1.61 Ǻ, low intensity diffraction lines of hematite at d=3.69, 2.72, 2.69, 2.31, 2.20, 1.86, 1.69 Ǻ, quartz lines at d=4.27, 2.28, 2.00 Ǻ low intensity diffraction lines at d=3.34 Ǻ; as in figure 6, which is for “Suul Khar” iron ore, high and medium intensity diffraction lines of magnetite at d=2.97, 2.51, 2.45Ǻ, medium and low intensity diffraction lines of hematite at d=3.69, 2.2, 2.58, 2.30, 2.20, 2.18 Ǻ, quartz lines at d=2.34, 2.25 Ǻ and low intensity diffraction line of goethite at d=4.20, 3.34 Ǻ etc, respectively [5].

Fig. 4. X-ray Diffractogram of “Kharganat” iron ore

Fig. 5. X-ray Diffractogram of “Uvgundatsan” iron ore

Fig. 6. X-ray Diffractogram of “Suul Khar” iron ore
The results of mineral analysis showed that iron ores of “Kharganat” and “Uvgundatsan” mostly contain magnetite (Fe 3 O 4 ), whereas iron ore of “Suul Khar” – hematite (Fe 2 O 3 ).
The research result of the effect of calcium fluoride on decomposition temperature of calcite in raw mix for cement production. Raw mix used in cement clinker production that consists of “Shokhoit” limestone, “Shal” clay and “Kharganat” iron ore was calculated by Kinds method. Silica module was n=2.2 while Saturation coefficients (SC) were at 0.83, 0.88 and 0.93 in this calculation. The results are shown in Table 3 and chemical composition of the initial materials [6] which are used to make raw mixes is shown in Table 2.
According to the result of raw material evaluation, it can be observed that amounts of iron ore in 100 kg cement are approximate for every saturation coefficient level and modules (Table 3), in clinker composition they are within the limit of Portland cement standard [7]. In conclusion, it could be assumed that these iron ores can be used in cement production.
Research was conducted as follows: Calcium fluoride at 0%, 0.5%, 1.0% and 1.5% of raw material weight were added to limestone of “Shokhoit”, clay from “Shal” and iron ore of “Kharganat” at saturation coefficient of SC=0.93 and silica module at n=2.2 (Table 4). The effect of calcium fluoride on decomposition temperature of calcite in raw mix for obtaining cement we determined by DTA analysis. Result is shown in Fig. 7. From Fig. 7 shown, weak exothermic effect was observed due to the water evaporation of clay minerals in raw material composition at 325-185oC, deep endotherm peak was observed due to the decomposition of calcite (CaCO3), which is the main component of composition, at 865-870oC. The sample weight loss was 32.52% when calcium fluoride was not available, the loss was 33.4% when calcium fluoride was added 0.5% while it was 1.0% the loss was 32.78%, and when it was 1.5% the loss was 32.96%. From Fig. 7 we can see that, the decomposition temperature of calcite (CaCO 3 ) was reduced by 5oC, 10oC, and 15oC when calcium fluoride (CaF 2 ) in the raw mix for obtaining cement clinker that consists of “Shokhoit” limestone, “Shal” clay and “Kharganat” iron ore was added up to 0.5%, 1.0% and 1.5%.
Chemical composition of raw material, %
Composition and characteristics of mixes for obtaining cement clinkers
Composition of raw mixes with addition CaF 2
Table 2
|
Name of raw material |
SiO 2 |
Al 2 O 3 |
Fe 2 O 3 |
CaO |
MgO |
SO 3 |
Na 2 O |
K 2 O |
Mn2O3 |
other |
Loi |
Σ |
|
Limestone of Shokhoite |
0.85 |
0.10 |
0.25 |
54.64 |
0.25 |
0.20 |
0.22 |
- |
- |
0.62 |
42.87 |
100 |
|
Clay of Shal |
58.33 |
15.4 |
3.12 |
5.13 |
3.58 |
0.222 |
2.7 |
2.89 |
- |
0.298 |
8.33 |
100 |
|
Iron ore of Kharganat |
7.07 |
1.02 |
89.29 |
0.53 |
0.15 |
1.02 |
1.02 |
0.01 |
- |
- |
100.11 |
|
|
Iron ore of Uvguntsan |
9.684 |
1.164 |
86.435 |
1.408 |
- |
- |
- |
- |
0.129 |
1.18 |
100 |
|
|
Iron ore of Suul khar |
3.945 |
0.671 |
85.002 |
0.485 |
0.001 |
0.003 |
0.004 |
- |
9.89 |
100.001 |
Table 3
|
Mix |
Component content, (mass. %) |
SC |
Modules |
|||
|
Lime stone |
Clay |
Iron ore |
SM |
AM |
||
|
A-1 |
73.90 |
23.98 |
2.23 |
0.83 |
2.2 |
1.3 |
|
A-2 |
75.17 |
23.05 |
2.15 |
0.88 |
2.2 |
1.29 |
|
A-3 |
75.73 |
22.20 |
2.07 |
0.93 |
2.2 |
1.31 |
|
B-1 |
73.80 |
23.86 |
2.32 |
0.83 |
2.2 |
1.29 |
|
B-2 |
74.80 |
23.86 |
2.24 |
0.88 |
2.2 |
1.29 |
|
B-3 |
75.77 |
22.11 |
2.16 |
0.93 |
2.2 |
1.25 |
|
C-1 |
73.66 |
24.02 |
2.32 |
0.83 |
2.2 |
1.29 |
|
C-2 |
74.65 |
23.11 |
2.23 |
0.88 |
2.2 |
1.26 |
|
C-3 |
75.60 |
22.26 |
2.15 |
0.93 |
2.2 |
1.3 |
Mix A was calculated from Kharganat iron ore. Mix B was calculated from Uvgudatsan iron ore. Mix C was calculated from Suulkhar iron ore
Table 4
|
Mix |
Amount of mix, (m. %) |
|
|
Amount of initial mix, (m. %) |
Addition CaF 2 , (m. %) |
|
|
A-3a |
100 |
= |
|
A-3b |
99.5 |
0.5 |
|
A-3c |
99 |
1.0 |
|
A-3d |
98.5 |
1.5 |
Б. Цэрэнханд, Б. Баяраа, Г. Долмаа. Химический и минералогический состав некоторых глин Убснурского аймака (Монголия)
Conclusion
Based on the studies, the following conclusion can be drawn:
-
• The chemical investigation result showed that iron oxide (Fe2O3) in the Western Mongolian iron ores is contained in Uvgondatsan (in Khovd) – 87.23%, Suul khar (in Khovd) – 85.00% and Khargant (in Uvs) – 89.29%. Therefore, these iron ores can be used in cement production.
-
• X-ray diffraction and DTA analysis results show that iron ores of “Kharganat” and “Uvgundatsan” are mostly contained magnetite (Fe 3 O 4 ) while iron ore of “Suul Khar” is mostly contained hematite (Fe 2 O 3 ).
-
• A calculation of raw mix for obtaining cement clinker was done by using iron ores, clay of “Shal” and limestone of “Shokhoit”, and calculated modules that from clinker compositoin (n=2.2 p=1.25-1.30) are within the limit of Portland cement standard.
-
• The decomposition temperature of calcite (CaCO3) was reduced by 5oC, 10oC, and 15oC when calcium fluoride (CaF2) in the raw mix for obtaining cement clinker that consists of “Shokhoit” limestone, “Shal” clay and “Kharganat” iron ore was added up 0.5%, 1.0% and 1.5%, respectively.
Список литературы Состав некоторых железных руд и возможность их использования в производстве цемента (западный регион Монголии)
- Butt Yu.M., Timashev V.V. Practical work on chemical technology of binding materials. -M.: High School, 1973. -496 p.
- Semendyaeva A.F. Control of cement production. -L.: Stroyizdat, 1974. -P. 26-44.
- Lotov V.A. Structure, properties of the cement raw mix preparation and properties of the Portland cement clinker. -Tomsk, 2006. -P. 2-7.
- Sunjidmaa N. The characteristics of Mongolian Portland cement and the effect of some additives in it: diss.. doc. of chemistry sciences. -Ulaanbaatar, 1997. -268 p.
- Topor N.D. Differential thermal and thermo gravimetric analysis of minerals. -M.: Nedra, 1964. -165 p.
- Novenkov E.D., Gantsog Ts. General methods of X-ray analysis. -UB, 1987. -P. 72-73.
- Kamenica F. Guide to X-ray examination of minerals. -L.: Nedra, 1975. -159 p.
- Tserenkhand B. Physical and chemical studies obtaining Portland cement at low temperature using by raw materials in Hovd aimag. -Erdenet: Khukhdel print, 2007. -P. 65-72.
- Sanjaasuren R. Chemistry of cement. -Ulaanbaatar, 2006. -P. 20-30.


