SourceViz: A Tool for Supporting Software Metrics Visualization

Автор: Muhammad Ilyas, Hafiz Anas Bilal, Qandeel Tariq, Saba Ameer Awan
Журнал: International Journal of Information Engineering and Electronic Business(IJIEEB) @ijieeb
Статья в выпуске: 3 vol.9, 2017 года.
Бесплатный доступ
Maintaining and understanding large software systems is a complex and time consuming process. Understanding the internal structure of such systems is not an easy task due to the invisible nature of software. Source Code Visualization, i.e. measuring the code metrics and then visualizing them, provides an efficient solution to this problem. There are many tools available which gives an insight to the internal structure of the software. But all of them don't provide visualizations of hierarchical relationships and code complexity of the source code. In this paper, we present a tool named "SourceViz". This application computes different software metrics, code complexity, class-relations and then visualizes the calculated metrics in different metaphors. This visual analysis assists the project managers and software developers in understanding the static structure of the software by presenting project-level as well as class-level view.
Software Metrics, Software Visualization, Code Complexity, Source Code Visualization
Короткий адрес: https://sciup.org/15013507
IDR: 15013507
Текст научной статьи SourceViz: A Tool for Supporting Software Metrics Visualization
Published Online May 2017 in MECS
Software systems are complex hierarchal systems. Understanding the structure of such systems is a cumbersome exercise. The intangible nature of the software enhances this problem [1]. It is not possible for the software engineers to acquire a detailed insight of the source code in order to analyze every detail. Visualizing the source code provides a solution to this problem. It makes the software visible by providing a physical shape to it. Different techniques used in the process of software visualization facilitate the users to understand the code and grasp its structure [1].
A number of metrics have been defined for analyzing a software structure. These metrics are the quantitative measure of the code elements. They provide quantitative checks on software design through clear, tangible and qualitative analysis. Also, they are designed to help in identifying the problem areas. They actually highlight the hidden dependencies of the code structure. Also, they provide measures to pay attention to the complexities of the object oriented code. They are likely to assist managerial decision making by providing information for managerial issues. Hence, these metrics can facilitate in improving the overall quality of the software system. The most common example includes the widely used lines of code measure. These measures characterize the properties of the software systems. Visualizing these metrics helps in the comprehension of the system.
SourceViz is a tool that explores and visualizes the internal structure of the source code written in Java. In the field of software visualization, a number of techniques exist to address the visual representations in 2D and 3D. Out of these techniques, SourceViz utilizes bar chart, pie chart and graphs to visually represent the metrics. The metric values are presented by the visual attributes, i.e. size and color. In addition to this, the graphs display the hierarchy of the system through nodelink structure. A user can understand the code through multiple views. Each view addresses a different perspective for analysis. So, our visualization helps users to see a big picture of the software system.
The remainder of this paper is structured as follows. In Section 2, related work is discussed. Section 3 describes the working of our tool. Section 4 concludes and summarizes our findings and in Section 5, future work is discussed that how this work can be carried further.
-
II. Related Work
Different visualization techniques have been proposed in the literature. These techniques have been mapped onto different metaphors. Basic metaphors include: Bar Chart, Pie Charts, Graphs, Cityscapes, Matrix Views and Network Views [1,2]. A number of tools have been discussed in the literature that implements these techniques to visualize the structure of software from different perspectives.
Graph based visualization techniques have been most commonly used to visualize software metrics. They are used to formally model relationships between objects. The static graphs include node-link and matrix structures. UML graphs are used widely to visualize the structure of source code. These graphs provide a 2D view of the software. They model the standard artifacts such that it highlights the design of the software. The tools that generate UML models include IBM Rational Rose and Visual Paradigm. Other techniques are Dependency Structure Matrix (1981), Treemap, Circular Treemap (1991), City metaphor (1993), Polymetric Views (1999), Solar system (2003), Landscape (2004), UML Metric View (2005), Treemap Metrics (2005) [4].
Tools that relate to our work based on above mentioned techniques include: Metric View, Polymetric Views, SolidFX, CodeCity, Codstruction, X-Ray and NDepend. Metric View [3] extracts software metrics from the source code and maps them on UML diagrams. This tool is capable of showing class relations but due to the short comings of UML modeling diagrams, it provides limited information. Polymetric Views [5] provide a 2D graph that visualizes only class hierarchy relations at multiple levels. It is not concerned with the low level metrics as described in table1. X-Ray is a tool based upon Polymetric Views. It is also maps source code elements on UML diagrams; so likewise, it is also restricted to dependency metrics views at multi-levels. SolidFX [7] is a multipurpose visualization tool. It supports the visualization of various source code through dependency graphs, software metrics and system diagrams. It can even undertake very large projects having multi-million lines of code but, it is restricted to C/C++ platform.
Table 1. Existing tools on source code visualization
|
Sr.# |
Tools |
Metaphor |
Descriptions |
Limitations |
|
1 |
CyVis |
Bar/Pie Charts |
Does not provide any information about the hierarchy relationships at different level |
Project, package and class level view |
|
2 |
NDepend |
Hierarchical View |
complicated tool with a complex user interface |
Hierarchy relationship with .Net framework support |
|
3 |
CodeCity & Codestruction |
City Metaphor |
Does not provide any insight about low-level metrics of code |
3D view domain of system map with domain of city |
|
4 |
SolidFX |
Dependency Structure |
Large Projects but restricted to C/C++ platform |
Dependency graphs, software metrics and system diagrams. |
|
5 |
X-Ray |
Polymetric Views , UML Representation |
It restricts to dependency metrics views at multi-levels |
Maps source code elements on UML diagrams |
|
6 |
Metric View |
UML Representation |
Due to short comings of UML modeling diagrams, it provides limited information |
Shows class relations |
|
7 |
Polymetric Views |
Hierarchical View |
Not concerned with low level metrics |
Gives 2D graph that visualizes only class hierarchy relations at multiple levels |
In [16], authors presented a software visualization approach that provides a mental picture by viewing an object-oriented (OO) software by means of polymetric views, i.e. light-weight soft- ware visualizations enriched with software metrics.
Other than these, CodeCity [6] and Codstruction [8] are the common tools based on city metaphor to visualize software metrics. They provide a 3D view of the software. The domains of a system are mapped to the domains of a city i.e. a system is a city, package is a district and buildings are the classes of the source code. The class metrics are defined by the attributes of a building. Visual properties are applied to these mapped software metrics. Box-plot mapping technique is utilized to visualize the values of these mapped metrics. Five levels are defined to map the metrics for the purpose of categorization. These are highly scalable. Multiple parameters are used to give an appropriate view of the class metrics. These parameters include class color, dimension, position, color saturations of the buildings created in the city based view. But, these tools are unable to visualize the relationships among different entities.
In [17], authors presented code elements as classes, functions, or attributes in city metaphor by the tool CodeMetropolis. It uses the game engine of Minecraft for the graphics, and is able to visualize various properties of the code based on structural metrics. In this work, we present our approach to integrate our visualization tool into the Eclipse IDE environment. Previously, only standalone usage was possible, but with this new version the users can invoke the visualization directly from the IDE, and all the analysis is performed in the background.
CodeMetropolis [18] is a tool which uses the city metaphor to show the structure of the source code as a virtual city. In it, different physical properties of the city and the buildings are related to various code metrics. In its previous version, it was limited to represent only code related artifacts. In its extended version, authors tried to visualize the properties of the tests related to the program code. The test suite and the test cases are also associated with a set of metrics that characterize their quality (such as coverage and specialization).
NDepend [9] is the recent tool that is closest to our work. It visualizes a large number of software metrics along with the hierarchy relationships but, it is quite a complicated tool with a complex user interface.
Moreover, it is designed to support Dot Net framework. CyVis [10] is another tool that collects and analyzes software metrics which is specially designed to deduce and visualize cyclomatic complexity. It provides project, package and class level view that visualizes the complexity using bar chart. But, it does not provide any information about the hierarchy relationships at different levels.
Compared to other tools and techniques, SourceViz extracts the metrics and other class relations directly from the source code. It visualizes both, low level as well as high level software metrics. These metrics can be visualized for different levels i.e. project, package or class. It also indicates the complexity level of the source code. The techniques used for visualization are simple and easily understandable. Moreover, our tool has a user friendly interactive interface. This tool targets a large number of audience including project managers, developers, software architects and designers etc.
-
III. Proposed Work
Building a prototype artifact is a significant element of the applied research. It serves as the basic and preliminary step to demonstrate the feasibility of the research artifact or it can be referred to as “proof by construction”. Also, the building process contributes to the body of knowledge in the field, by adding a new dimension to the already used techniques.
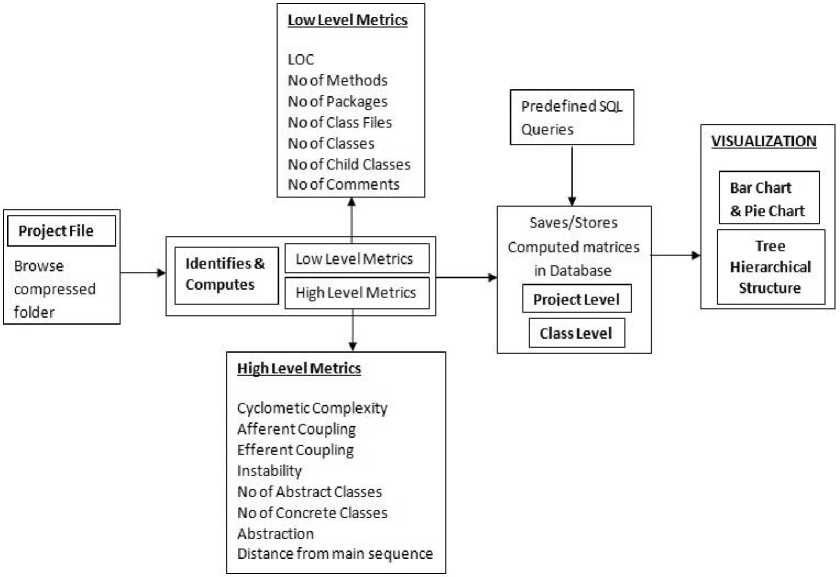
Fig.1. Process Flow of SourceViz
In this section we describe the system architecture and working of our proposed prototype application SouurceViz. Figure 1 represents the architecture of SourceViz. Two main algorithms developed in this application are described in this section.
-
A. SourceViz- An Overview
SourceViz is a source code visualization tool that we have developed to enhance the understanding of the source code structure and complexity.
The functions of this tool include:
-
1) Extract and compute software metrics
-
2) Analyze hierarchal relations at multiple levels
-
3) Compute software complexity
-
4) Visualize them
-
B. Algorithm Design
We have developed two main algorithms for our system. The first algorithm is designed to browse a compressed folder containing the project file. It identifies and computes the software metrics from the selected file. The metrics that we will be studying in our system are described in section 4.4.3. Each of these software metrics is stored in a database for each project along with their computed values.
The second algorithm deals with the visual representations of all these computed metrics. The visualization techniques utilized through this algorithm include Pie and Bar Charts. These charts present all other metrics except for cohesion and coupling. They will be dealt through Tree Hierarchy Structure. We have also used Datasheets to visualize the metrics in a tabular form.
-
C. Algorithm for Metrics Calculation
We designed the algorithm for metrics calculation, which consists of following steps:
Step1: Browse a compressed folder (.zip) containing the project file written in Java.
Step2: Identify and compute software metrics from the selected project.
Identify: low level and high level metrics
Compute: calculate values of metrics by sub algorithms
Step3: Values of computed metrics are then stored in the database in. values of computed metrics are then displayed on the main interface of the SourceViz and also in the tables with their corresponding visualization is applied.
User can adjust view to show flexibility of their desired level through predefined quires. Query is processed by just clicking the button.
-
D. Metrics Extraction
Software metric is standard of measurement. Software metric computes property of a piece of software or its specifications. Since quantitative methods have been proved so powerful in other sciences, computer science practitioners and theoreticians have worked hard to bring similar approaches to software development. Tom DeMarco stated, “You can’t control what you can't measure”. There are countless examples of software metrics. Software metrics have been widely used in research and are well established [12]. Metrics have been using in computer science because they enable identification of valuable piece of information for software quality attributes [13]. Complexity, efficiency, re-usability, testability, and maintainability are a few example of software quality attributes. Recently, an increasing interest in OO metrics [14] has been shown thanks to the increasing popularity of OO analysis and design methodologies. In our approach, we consider both OO metrics [15] and “more-traditional” code-size metrics. In the following, we shortly introduce metrics we used in our software visualization approach .
-
1) LOC : Computing lines of code is an old technique.
Lines of code are computed regardless of the internal functionalities of software. SourceViz computes this metric not only for the whole project but also for every java class file separately in that project. We
The lines of code considered by this tool are noncomment, non-blank lines.
-
2) No. of Methods: Considering the static analysis of source code we know every method has ability to perform some functionality. This tool counts number of methods found in each class and displays them separately.
-
3) No. of Packages : We are counting the number of packages. Total packages found in that project. Here we are not considering the default packages.
-
4) No. of total classes: This metric counts the total number of classes within a class project. It also displays their names, the total number of methods within and the parent class to which it belongs.
-
5) No. class files: The classes declared are present in some class files that are saved as .java extension. This tool considers this metric and gives the total count of the class files in a project. Greater the number of class files, heavier will be the project.
-
6) No. of Child Classes: SourceViz calculates the total number of classes that are extended at package level. It also calculates the number of
child classes for each class, if extended, at class level.
-
7) No. of Comments: Comments in a code helps in understanding the working of each command or method but, too much comments result in increasing the size of the project. Also, they are not a part of the actual functionality of the code so, not considered at managerial level. This tool computes the total number of comments for each class file separately and provides an exact count.
-
8) Percentage of Comments: SourceViz not only finds the number of comments but also, the percentage of comments. Percentage of comments is computed using the following formula: Comments Percentage = (No. of Comments / LOC)*100.
-
9) No. of Abstract Classes (Na): At package level, ‘Na’ is the total number of abstract classes that are within that package. This is an important metric as; the greater the number of abstract classes, the higher the opportunities to extend the package.
-
10) No. of Concrete Classes: At package level, ‘Nc’ is the total number concrete classes that are in that package.
-
11) Afferent Coupling (Ca): At the package level Ca is defined as, Ca of a package is the number of classes of other packages that are called in.
-
12) Efferent Coupling (Ce): At the package level Ce is defined as, Ce of a package is the number of classes of this packages that are called in other packages.
Fig. 2 given below, depicts the concept of Ca and Ce.
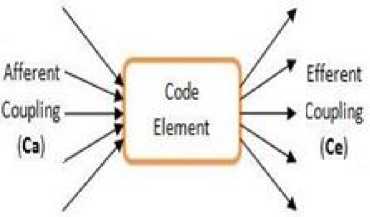
Fig.2. Afferent and Efferent Coupling
-
13) Instability (I): Instability ‘I’ is the ratio of Afferent Coupling ‘Ca’ and Efferent Coupling ‘Ce’. It is either ‘0’ or ‘1’, where I= 0 means the project is instable and I= 1 means the project is stable. It is given as,
I=Ce/ (Ce+Ca), where Ca and Ce > 0
-
14) Abstractness (A): The ratio of ‘Na’ and ‘Nc’ is called Abstractness. Its range is lies between 0 and 1, where A= 0 indicates the package is totally concrete and A= 1 indicates the package is abstract. It is given as:
A = Na/ Total no. of classes
-
15) Cyclomatic Complexity: CC is a measure to estimate the complexity defined for each class, as well as whole software project. It is the most
common and useful technique. CC is computed on the basis of the decision nodes that are if | for | while | for each | try. The complexity of these nodes is defined as either ‘0’ or ‘1’. Remember that else, catch, do are not the decision node.
In this tool, we first compute CC for every method in a class, then the total sum for all computed values of CC is displayed class wise. Along with this, SourceViz also computes CC for the whole project by finding average CC of all the classes.
-
16) Distance from main sequence: This metric is an indicator of the project's balance between abstractness and stability. It is given as, A+I = 1 (main sequence)
For Ideal projects the value is either A= 0 and I= 1 means completely abstract and stable or A=1 and
I= 0 means completely abstract and stable. Minimum value indicates that the project is good.
If it is > 0.7 then it indicates that the project is problematic.
For value of main sequence is 0, Package is coincident with the main sequence, and for value 1, main sequence is so far with the main sequence.
-
E. Algorithm for Visualizing Metrics
It deals with visual representation of calculated metrics. It visualizes structure of software graphically as well as presents in tabular form.
Bar-Chart and Pie-Chart visualize all the metrics of source code except cohesion and coupling. Cohesion and coupling are dealt through Tree hierarchy Structure.
Table 2. Metric Classification in SourceViz
|
Sr. No |
Metric |
||
|
1 |
Line of code |
Low Level Metrics |
|
|
2 |
No. of methods |
||
|
3 |
No. of total classes |
||
|
4 |
No. of abstract classes |
||
|
5 |
No. of concrete classes |
||
|
6 |
No. of packages |
||
|
7 |
No. of conditional statements |
||
|
8 |
No. of comments |
||
|
9 |
Percentage of comments |
||
|
10 |
Afferent Coupling |
High Level Metrics |
|
|
11 |
Efferent Coupling |
||
|
12 |
Instability |
||
|
13 |
Abstractness |
||
|
14 |
Distance from Main Sequence |
||
|
CC Value level |
Level |
THRESHOLD VALUE FOR CC |
|
|
CC<20 |
Low |
||
|
CC=20 |
Moderate |
||
|
CC>20 |
High |
||
As described above, SourceViz visualize structure of software graphically as well as in tabular form. Packages, classes and methods are the main code elements in a software structure. Graph Scene view is provided for understanding the structure based on these code elements. SourceViz provides three different graphical views. First view, as shown in fig.1, provides a complete hierarchical structure that consists of classes and methods providing a complete understanding of the software. It visualizes a tree structure in an order of: the selected file, the classes declared in them and; the methods declared in each class. The view displays the parent child relationship within a file. Fig. 3 displays the second view that is based on all objects’ relationship.
The main focus of SourceViz is on visualizing cohesion. Classes are represented by green widgets. Blue connections show the relation between a particular class and the object(s) called by that class.
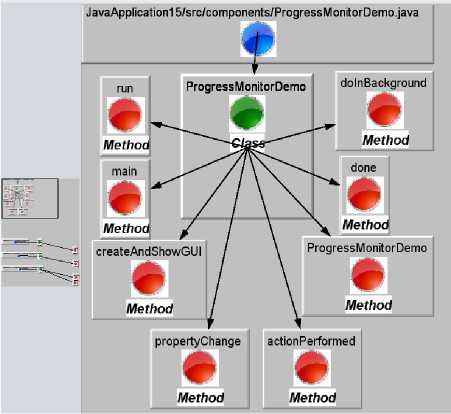
Fig.3. Hierarchal tree structure of SourceViz
The view determines high cohesion and high coupling based on the phenomenon that: the class where outgoing is more is highly coupled and the class where incoming is more indicates high cohesiveness. Such a view is also shown for a specific class as in Fig. 4, and 5.
Other techniques used include, pie chart and bar chart for visualizing low level metrics. These metrics are visualized as percentages. JFreeChart library is used to display the metrics in the mentioned views. The static analysis of the code elements as a pie chart and bar chart helps in better understanding of the code structure. Different colors are allocated to differentiate the elements in the case of pie chart whereas the size of the bar indicates the values in a bar chart. We selected the most common metrics that a user wants to see i.e. LOC, comments, number of classes, number of methods and conditional statements. Fig. 6 and 7 show the views of bar chart and pie chart respectively.
Distance from Main Sequence. Formulas used are given below in section C.
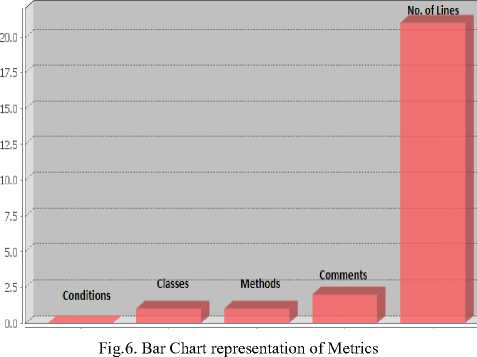
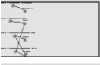
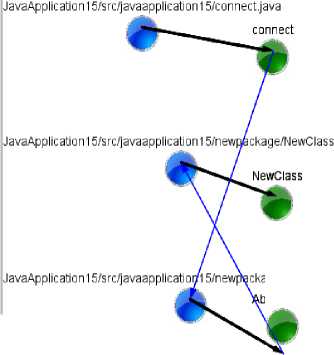
Fig.4. Class-level Cohesion View of SourceViz
directness
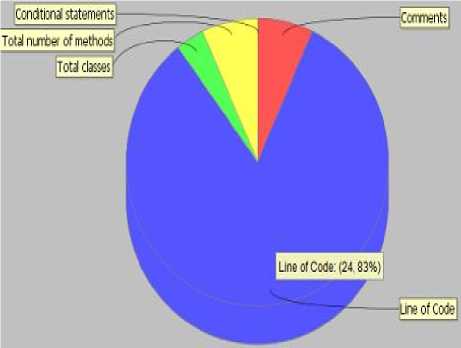
Fig.7. Pie Chart representation of Metrics
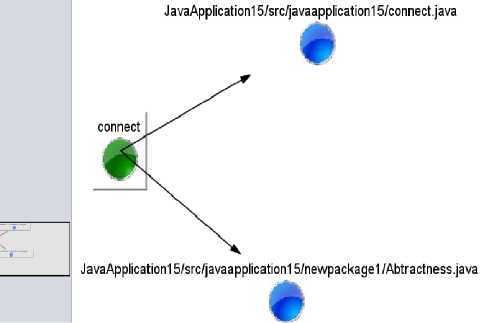
Fig.5. Single Class Cohesion
We also used tables as a view to represent the code elements in a comprehensible manner. The table gives information about the number of different code elements at multiple levels. Our tool provides three tabular views, one for each level that is project, package and class.
Fig. 8 gives the textual view of all the metrics at a package level i.e. all the packages in a project, total files in that package, Afferent Coupling (Ca), Efferent Coupling (Ce), Instability (I), Abstractness (A), and
Fig. 9 gives a tabular representation of data of all the classes e.g. Cyclomatic Complexity (CC), Line of Code (LOC) of that class, number of methods etc.
Fig. 10 gives the interface of SourceViz.
-
IV. Equations and Formulae
Following formulas have been incorporated in the algorithm in order to derive some metrics from the calculated metrics.
Comments % = (No. of Comments/LOC)*100 (1)
Instability (I) = C e / (C e +C a ) (2)
Where Ca (Afferent Coupling) and Ce (Efferent Coupling) are greater than zero.
Where N a is number of abstract classes.
Distance from Main Sequence (D) = A+I = I (4)
-
V. Conclusions and Future Works
Software is inherently intangible. Metrics can help analyze the software to some extent, but a metric alone, is a single numerical value and it does not provide much useful information. When a single metric is combined with other metrics and class relations, it provides more meaningful information. Visualizing all these relations and metrics, enhances the understanding of the software even more. The tool presented in this paper, provides a big picture of the software. It helps the users to have a detailed insight into the software system by visualizing software metrics and the relationships between different metrics, in a time saving and efficient manner. In future we will extend this prototype which can facilitate as following:
-
• Evaluating and visualizing opportunities for reusability, refactoring and reengineering
-
• Evaluating the quality of software through the provided visualizations
-
• Evaluating the maintenance opportunities
|
Name |
Cydomentic Compl.. |
| Une of Codes |
I Packge Name |
I NumOer_of_classes | Num6er_of_methods |
I Percantage of Comm... |
|
JavaApphcation15/src/com |
. 15 |
134 |
components |
1 8 |
12 |
|
JavaApplication15/src/java |
2 |
42 |
javaapplication15 |
1 1 |
3 |
|
JavaApplication15/src/java... |
0 |
21 |
javaapplication15.ne... |
1 1 |
2 |
|
JavaApplication15/src/java... |
0 |
24 |
javaapplication15.ne... |
1 2 |
2 |
Fig.8. Tabular View of Classes Data
|
Name of Package |
Afferent Coupling (... | Efferent Coupling (... Instability (I) Abstractness(A) Distance from mai... |
|
components |
0 0 0.0 0.0 0.0 |
|
javaapplication15 |
0 1 1.0 0.0 1.0 |
|
javaapplication15... |
1 0 0.0 1.0 1.0 |
|
javaapplication15... |
1 1 0.5 00 0.5 |
Fig.9. Tabular View of Class-Level Metrics
Список литературы SourceViz: A Tool for Supporting Software Metrics Visualization
- T. J. Ball and S. G. Eick, "Software Visualization in the Large", Computer, vol.29, no.4, pp.33,43, Apr 1996 doi: 10.1109/2.488299
- S. G. Eick, T. L. Graves, Karr A F, Mockus A, Schuster P, "Visualizing Software Changes", Software Engineering, IEEE Transactions on, vol.28, no.4, pp.396,412, Apr 2002doi: 10.1109/TSE.2002.995435
- C. M. Termeer, C. F. J. Lange, A. Telea, and M. R. V. Chaudron, "Visual Exploration of Combined Architectural and Metric Information", Visualizing Software for Understanding and Analysis, 2005. VISSOFT 2005.
- P. Caserta and O. Zendra, "Visualization of the Static Aspects of Software: A Survey", IEEE Trans. On Visualization and Computer Graphics, vol.17, no.7 (2011) 913-933 doi: 10.1109/TVCG.2010.110
- M. Lanza and S. Ducasse, "Polymetric Views- A Lightweight Visual Approach to Reverse Engineering", Trans. on Software Eng., vol.29, no.9, pp.782-795, doi: 10.1109/TSE.2003.1232284, Sept. 2003.
- R. Wettel. [Online] Available: http://www.inf.usi.ch/phd/wettel/codecity.html [Accessed 9 January 2016]
- A. Telea and L. Voinea, "An Interactive Reverse Engineering Environment for Large Scale C++ Code", in 4th ACM Symp. in Soft. Vis., 2008.
- R. Wettel and M. Lanza, "Visualizing Software Systems as Cities", Proc. VISSOFT 2007 (4th IEEE International Workshop on Visualizing Software For Understanding and Analysis), pp. 92 - 99, IEEE Computer Society Press, 2007.
- P. Smacchia, NDepend [Online]. Available: http://www.ndepend.com/ Directory: Product. [Accessed 10 March 2016]
- P. Selvaraj and V. Iyer (2005-2006) CyVis: Software Complexity Visualiser [Online]. [Accessed 21 July 2016]
- Available Telnet: http://cyvis.sourceforge.net
- T. De Marco, "Controlling Software Projects: Management, Measurement and Estimation", Yourdon, NewYork,NY,1982
- R. Subramanyam and M. S. Krishnan, "Empirical analysis of ck metrics for object- oriented design complexity: implications for software defects", IEEE Trans. Software Eng.29(2003)297–310.
- M. Lanza and R. Marinescu, "Object-Oriented Metrics in Practice. Using Software Metrics to Characterize, Evaluate, and Improve the Design of Object-oriented Systems", Springer Verlag, 2010.
- S. R. Chidamber and C. F. Kemerer, "A metrics suite for object oriented design", IEEE Trans.Softw.Eng.20(1994)476–493
- R. Francese, M. Risi, G. Scanniello, and G. Tortora, "Proposing and assessing a software visualization approach based on polymetric views". Journal of Visual Languages & Computing, 34, 11-24.
- G. Balogh, A. Szabolics and Á Beszédes, "CodeMetropolis: Eclipse over the city of source code," Source Code Analysis and Manipulation (SCAM), 2015 IEEE 15th International Working Conference on, Bremen, 2015, pp. 271-276. doi: 10.1109/SCAM.2015.7335425
- G. Balogh, T. Gergely, Á Beszédes and T. Gyimóthy, "Using the City Metaphor for Visualizing Test-Related Metrics"," 2016 IEEE 23rd International Conference on Software Analysis, Evolution, and Reengineering (SANER), Suita, 2016, pp. 17-20. doi: 10.1109/SANER.2016.48
