Spatial and logical model of American electorate political choice formalization: experience for Russia

Author: Petrov Artur Igorevich
Journal: Economic and Social Changes: Facts, Trends, Forecast @volnc-esc-en
Section: Public administration efficiency
Article in issue: 2 (50) т.10, 2017.
Free access
The results of the 58th US presidential election held November 8th, 2016 turned out a big surprise for many people. Numerous public opinion polls in the USA on political loyalty conducted by various researchers from July to October, 2016, demonstrated a steady trend of an electoral advantage of the Democratic Party's nominee (H. Clinton). However, during election (November 8th, 2016) the Republican Party's nominee D. Trump won with 306 electoral votes against 232. Why did this happen? Experts, political analysts have different explanations of this choice of American voters. In this article, the author makes an attempt to conduct a simple statistical analysis of the results of American electorate political preferences using basic socio-economic categories such as “quality of life”, “gross domestic product”, “employment” and “crime”. The hypothesis accepted as the basis for the author's arguments implies that the voters' political preferences greatly depend on the actual quality of people's lives, which is highly differentiated in the US states...
2016 us presidential election, election results, quality of life of the us states population, correlation-regression analysis, electorate political choice, protest nature of election
Short address: https://sciup.org/147223919
IDR: 147223919 | UDC: 323.2 | DOI: 10.15838/esc.2017.2.50.6
Text of the scientific article Spatial and logical model of American electorate political choice formalization: experience for Russia
Introduction . The U.S. presidential election is one of the key global events of 2016, the outcome of which can have a significant impact on both domestic and foreign policy of the country, and, in addition, exert influence on a planetary scale. The United States of America is a state that in the end of the 20th – beginning of the 21st century aspires to take the dominant position in the world. Gross domestic product (GDP) of the United States at par in 2015 amounted to 18,037 billion US dollars or about 24.4% of the total GDP of all countries of the world (73,891.9 billion US dollars) [26]. The U.S. itself and many other countries [33] have formed an opinion that, having the greatest economic, political, cultural and military influence in the world, the U.S. is currently the only superpower on the planet.
20 January 2017 the inauguration of the newly elected President of the United States was held; Donald Trump, the representative of the Republican Party, assumed office on that day. His victory in the presidential election (08.11.2016) was largely unexpected. During almost all the pre-election presidential race, public opinion polls in the United States registered the advantage of his rival, Hillary Clinton, the candidate from the Democratic Party [25; 27]. Why did this happen? What motivated this choice? Which states voted for Donald Trump, and which – for Hillary Clinton, and why? Does it implies actual change in politics, economy, and life style of the Americans? Will this event have any significant influence on other countries and peoples? This is a small part of the essential questions the answer to which the world will only get with time. As for today, it would be interesting to look for an answer to the following three crucial questions.
-
• Did the Americans voted for Trump in protest against the politics of the Democratic Party, which they are already tired of?
-
• Is this choice associated with the fact that U.S. citizens needs changes in both external and domestic policy?
-
• Were any spatial features of electoral behavior of residents of different states manifested during the election?
As the author was trying to find answers to these questions, he statistically tested the hypothesis that the political preferences of the voters depend heavily on the actual satisfaction with the quality of people’s life, this quality being highly differentiated across the states of the U.S.
The aim of this study is to establish the presence of statistical dependence between the quality of life of the population in various U.S. states and the results of their electoral behavior.
The tasks set by the author were as follows:
-
• quantitative assessment of electoral preferences of citizens in different U.S. states by means of the indicator “Ratio of electoral votes cast for the Democratic candidate to electoral votes cast for the Republican candidate” (% Democratic / % Republican );
-
• substantiation of choosing the American Human Development Index (AHDI) as a quantitative characteristic of the quality of life of U.S. citizens;
-
• finding a dependence between the results of electoral preferences of U.S. citizens and the quality of life ( % Democratic / % Republican ) = f(AHDI) , which is considered
as the basic (source) dependence purposes of the present research;
-
• finding a second order (follow-up)
dependence between the American Human Development Index (AHDI) and the factor that indirectly determines the basic foundations of the quality of life (gross domestic product of U.S. states) for the purpose of finding explanations for the dependency obtained;
-
• establishing a third order dependence between the American Human Development Index (AHDI) and road traffic accident rate, one of the practical manifestations of the quality of life in U.S. states;
-
• establishing statistical relationship between the results of political election and Human risk HR , a feature of road traffic accident rate;
-
• conducting similar research for databases on the election of 2000 and 2008, when a rival political party was the winner;
-
• clarifying the logic of the results obtained;
-
• formulating the research findings;
-
• formulating the conclusions that are important from the standpoint of experience for Russian authorities.
Quantitative assessment of electoral preferences of citizens in different U.S. states. Following the meeting of the Electoral College (December 19, 2016), the election results as of November 08, 2016 [31] were slightly adjusted. Two Republican electors from Texas did not vote for Donald Trump [22]; however, this did not affect the outcome ection. Based on the statistics of the
Thus, in various U.S. states the voters’
distribution of electoral votes for each state it is possible to calculate the coefficient “Ratio of electoral votes cast for the Democratic candidate to electoral votes cast for the Republican candidate” (1):
%Democratic / %Republican =
. (1)
% of electoral votes of the state cast for H. Clinton
% of electoral votes of the state cast for D. Trump
The figure (1) is a tool around which an ideology of further research will be built.
Votes cast for candidates from other parties (Gary Johnson from the Libertarian PartyJill Stein from the Green Party, Darrell Castle from the Constitution Party) and independent candidate Evan McMullin were excluded from the calculation.
The results [30; 31] of the quantitative assessment of electoral preferences of citizens in various U.S. states in the 2016 presidential election are presented in Table 1 .
Note that the effective range of values of this index is defined as [0.32; 2.07]. The District of Columbia is eliminated from further consideration for the following key reason: an urban region may not be identical to a state due to geographical and sociopolitical reasons. That is why the value of the ratio (% Democratic / % Republican ) for the District of Columbia is extremely high (% Democratic / % Republican ) = 22.75 and statistically is a release point.
preference of Democratic or Republican candidates differs considerably (almost in 7 times). For a number of U.S. states it is typical that the percentage of the votes cast for candidates from other parties (libertarian, green, constitution) is relatively high (10 to 28%).
Substantiation of choosing the American Human Development Index (AHDI) as a quantitative characteristic of the quality of life of U.S. citizens. It is almost impossible to evaluate the quality of life correctly; however, many researchers have attempted to do so [7; 15].
Today, the Human Development Index (HDI) is a generally recognized indicator for global assessment of the quality of life in various countries [3; 13]. However, each country usually uses its own analogue of HDI to carry out intra-country regional-spatial differentiation of the quality of life. For instance, the United States uses the American Human Development Index (AHDI) [28; 29], which essentially consists in a complex assessment of the quality of life taking into account average life expectancy, level of education and income.
Summarizing the statistics broken down by district, researchers from the Measure of America [29] defined the average estimated value of AHDI for each state in the United States (Tab. 2) . The same table presents a
Table 1. Results of the U.S. presidential election (2016)*
|
No. |
U.S. state (constituent political entity of the United States of America) |
Results of the U.S. presidential election, November 2016 |
||||
|
% of votes cast for the candidate from U.S. leading parties |
4-ч С М £ ° о с — ^ > О О О. eS5 + ё 1 |
О С/З о аз о = > ° о ^ |
сл о с о "^ со .S2 о5 ~ о °? с Е §- >. и Q DC ^ о - о CL о 5 со "со о е ^ О О ^ > ч- о_ |
|||
|
Democratic Party – H. Clinton |
Republican Party – D. Trump |
|||||
|
1. |
Alabama |
34 |
62 |
96 |
4 |
0.55 |
|
2. |
Alaska |
37 |
51 |
88 |
12 |
0.73 |
|
3. |
Arizona |
45 |
48 |
93 |
7 |
0.94 |
|
4. |
Arkansas |
34 |
61 |
95 |
5 |
0.56 |
|
5. |
California |
62 |
32 |
94 |
6 |
1.94 |
|
6. |
Colorado |
48 |
43 |
91 |
9 |
1.12 |
|
7. |
Connecticut |
55 |
41 |
96 |
4 |
1.34 |
|
8. |
Delaware |
53 |
42 |
95 |
5 |
1.26 |
|
9. |
District of Columbia |
91 |
4 |
95 |
5 |
22.75 |
|
10. |
Florida |
47 |
49 |
96 |
4 |
0.96 |
|
11. |
Georgia |
45 |
51 |
96 |
4 |
0.88 |
|
12. |
Hawaii |
62 |
30 |
92 |
8 |
2.07 |
|
13. |
Idaho |
28 |
59 |
87 |
13 |
0.47 |
|
14. |
Illinois |
56 |
39 |
95 |
5 |
1.44 |
|
15. |
Indiana |
38 |
57 |
95 |
5 |
0.67 |
|
16. |
Iowa |
42 |
51 |
93 |
7 |
0.82 |
|
17. |
Kansas |
36 |
57 |
93 |
7 |
0.63 |
|
18. |
Kentucky |
33 |
63 |
96 |
4 |
0.52 |
|
19. |
Louisiana |
38 |
58 |
96 |
4 |
0.66 |
|
20. |
Maine |
48 |
45 |
93 |
7 |
1.07 |
|
21. |
Maryland |
48 |
45 |
93 |
7 |
1.07 |
|
22. |
Massachusetts |
60 |
33 |
93 |
7 |
1.82 |
|
23. |
Michigan |
47 |
48 |
95 |
5 |
0.98 |
|
24. |
Minnesota |
46 |
45 |
91 |
9 |
1.02 |
|
25. |
Mississippi |
40 |
58 |
98 |
2 |
0.69 |
|
26. |
Missouri |
38 |
57 |
95 |
5 |
0.67 |
|
27. |
Montana |
36 |
56 |
92 |
8 |
0.64 |
|
28. |
Nebraska |
34 |
59 |
93 |
7 |
0.58 |
|
29. |
Nevada |
48 |
46 |
94 |
6 |
1.04 |
|
30. |
New Hampshire |
47 |
47 |
94 |
6 |
1.00 |
|
31. |
New Jersey |
55 |
41 |
96 |
4 |
1.34 |
|
32. |
New Mexico |
48 |
40 |
88 |
12 |
1.20 |
|
33. |
New York |
59 |
36 |
95 |
5 |
1.64 |
|
34. |
North Carolina |
46 |
50 |
96 |
4 |
0.92 |
|
35. |
North Dakota |
27 |
63 |
90 |
10 |
0.43 |
|
36. |
Ohio |
43 |
51 |
94 |
6 |
0.84 |
|
37. |
Oklahoma |
29 |
65 |
94 |
6 |
0.45 |
|
38. |
Oregon |
50 |
39 |
89 |
11 |
1.28 |
|
39. |
Pennsylvania |
48 |
48 |
96 |
4 |
1.00 |
|
40. |
Rhode Island |
54 |
39 |
93 |
7 |
1.38 |
|
41. |
South Carolina |
41 |
55 |
96 |
4 |
0.75 |
|
42. |
South Dakota |
32 |
62 |
94 |
6 |
0.52 |
|
43. |
Tennessee |
35 |
61 |
96 |
4 |
0.57 |
|
44. |
Texas |
43 |
52 |
95 |
5 |
0.83 |
|
45. |
Utah |
27 |
45 |
72 |
28 |
0.60 |
|
46. |
Vermont |
57 |
30 |
87 |
13 |
1.90 |
|
47. |
Virginia |
50 |
44 |
94 |
6 |
1.14 |
|
48. |
Washington |
53 |
37 |
90 |
10 |
1.43 |
|
49. |
West Virginia |
26 |
68 |
94 |
6 |
0.38 |
|
50. |
Wisconsin |
46 |
47 |
93 |
7 |
0.98 |
|
51. |
Wyoming |
22 |
68 |
90 |
10 |
0.32 |
* Compiled with the use of: [30; 31].
Table 2. Numerical values of the indicator of political preferences of American voters (2016) and various indicators of economic and social development in U.S. states*
|
No. |
U.S. state (constituent political entity of the United States of America) |
Numerical values of the indicator showing political preferences of American voters (2016) and various indicators of economic and social development in U.S. states |
|||
|
52 ~ о -о го О С
2 “ Е t Е О 2 |
с Е 5 о ^ т Е£о с о. C\J П^° < |
О- Щб “^Г |
Тл "^ ■^ ^ го , ОС СУ CD ту ^^1 ОО § сг о о. ZE ^,О |
||
|
1. |
Alabama |
0.55 |
4.04 |
36930 |
16.91 |
|
2. |
Alaska |
0.73 |
5.06 |
54582 |
9.91 |
|
3. |
Arizona |
0.94 |
4.89 |
38006 |
11.44 |
|
4. |
Arkansas |
0.56 |
3.91 |
37582 |
15.71 |
|
5. |
California |
1.94 |
5.40 |
50988 |
7.92 |
|
6. |
Colorado |
1.12 |
5.53 |
49768 |
9.11 |
|
7. |
Connecticut |
1.34 |
6.17 |
66716 |
6.89 |
|
8. |
Delaware |
1.26 |
5.22 |
45284 |
12.93 |
|
9. |
District of Columbia |
Not considered due to its territory being disproportionate to other states |
|||
|
10. |
Florida |
0.96 |
4.82 |
42868 |
12.54 |
|
11. |
Georgia |
0.88 |
4.62 |
38835 |
11.53 |
|
12. |
Hawaii |
2.07 |
5.53 |
46466 |
6.69 |
|
13. |
Idaho |
0.47 |
4.50 |
37153 |
11.38 |
|
14. |
Illinois |
1.44 |
5.31 |
48508 |
7.17 |
|
15. |
Indiana |
0.67 |
4.56 |
40460 |
11.31 |
|
16. |
Iowa |
0.82 |
5.03 |
44421 |
10.33 |
|
17. |
Kansas |
0.63 |
4.96 |
46393 |
13.26 |
|
18. |
Kentucky |
0.52 |
4.02 |
37059 |
15.23 |
|
19. |
Louisiana |
0.66 |
4.12 |
41811 |
15.85 |
|
20. |
Maine |
1.07 |
4.93 |
41240 |
9.85 |
|
21. |
Maryland |
1.07 |
5.94 |
54036 |
7.4 |
|
22. |
Massachusetts |
1.82 |
6.16 |
59603 |
4.86 |
|
23. |
Michigan |
0.98 |
4.76 |
40940 |
9.09 |
|
24. |
Minnesota |
1.02 |
5.69 |
49133 |
6.62 |
|
25. |
Mississippi |
0.69 |
3.81 |
34139 |
20.27 |
|
26. |
Missouri |
0.67 |
4.60 |
41107 |
12.63 |
|
27. |
Montana |
0.64 |
4.54 |
40599 |
18.75 |
|
28. |
Nebraska |
0.58 |
5.11 |
48321 |
11.96 |
|
29. |
Nevada |
1.04 |
4.63 |
40490 |
10.21 |
|
30. |
New Hampshire |
1.00 |
5.73 |
53629 |
7.16 |
|
31. |
New Jersey |
1.34 |
6.12 |
57728 |
6.22 |
|
32. |
New Mexico |
1.20 |
4.52 |
36656 |
18.36 |
|
33. |
New York |
1.64 |
5.66 |
56683 |
5.26 |
|
34. |
North Carolina |
0.92 |
4.57 |
39365 |
12.91 |
|
35. |
North Dakota |
0.43 |
4.90 |
57900 |
18.27 |
|
36. |
Ohio |
0.84 |
4.71 |
42155 |
8.68 |
|
37. |
Oklahoma |
0.45 |
4.14 |
45117 |
17.25 |
|
38. |
Oregon |
1.28 |
4.86 |
41690 |
8.99 |
|
39. |
Pennsylvania |
1.00 |
5.07 |
47955 |
9.35 |
|
40. |
Rhode Island |
1.38 |
5.38 |
48023 |
4.93 |
|
41. |
South Carolina |
0.75 |
4.35 |
36860 |
17.05 |
|
42. |
South Dakota |
0.52 |
4.79 |
45966 |
15.94 |
|
43. |
Tennessee |
0.57 |
4.22 |
40233 |
14.69 |
|
44. |
Texas |
0.83 |
4.65 |
45755 |
13.12 |
|
45. |
Utah |
0.60 |
5.03 |
37644 |
8.70 |
|
46. |
Vermont |
1.90 |
5.31 |
47144 |
7.02 |
|
47. |
Virginia |
1.14 |
5.47 |
50105 |
8.44 |
|
48. |
Washington |
1.43 |
5.4 |
50357 |
6.54 |
|
49. |
West Virginia |
0.38 |
3.95 |
35778 |
14.70 |
|
50. |
Wisconsin |
0.98 |
5.16 |
44406 |
8.81 |
|
51. |
Wyoming |
0.32 |
4.83 |
56004 |
25.68 |
* Compiled with the use of: [24], [28], elections/results/president [30].
series of statistical data for each state in the United States, which will be used in the second stage of the research to establish the dependency of the second and third orders (later) between the American Human Development Index (AHDI) and factors that indirectly determine the basic foundations of the quality of life [24; 28; 30].
Finding a dependence between the results of electoral preferences of U.S. citizens and the quality of life (% Democratic / % Republican) = f(AHDI), which is considered as the basic (source) dependence for the purposes of the present research . Statistical processing of the data in Table 2 was carried out with the use of the software package STATISTICA 6.0 for correlation and regression analysis. Figure 1
provides a graphical representation model (% Democratic / % Republican) =
f(AHDI) .
The statistical characteristics (R2 = 0.469; F-test = 42.47; standard error of approximation = 0.313) of the model (% Democratic / % Republican) = f (AHDI) allow us to conclude that the quality of life significantly influences the electoral preferences of
Americans. In the states where AHDI is relatively low (AHDI < 4.5), the ratio of electoral votes for Clinton to votes for Trump did not exceed 0.8. On the contrary, in the states with a relatively high quality of life (AHDI > 5.5) the ratio (% Democratic / % Republican) was in the range from 1 to 2. Let us try with the help of correlation and
Figure 1. Graphical representation of the model (% Democratic / % Republican) = f (AHDI)
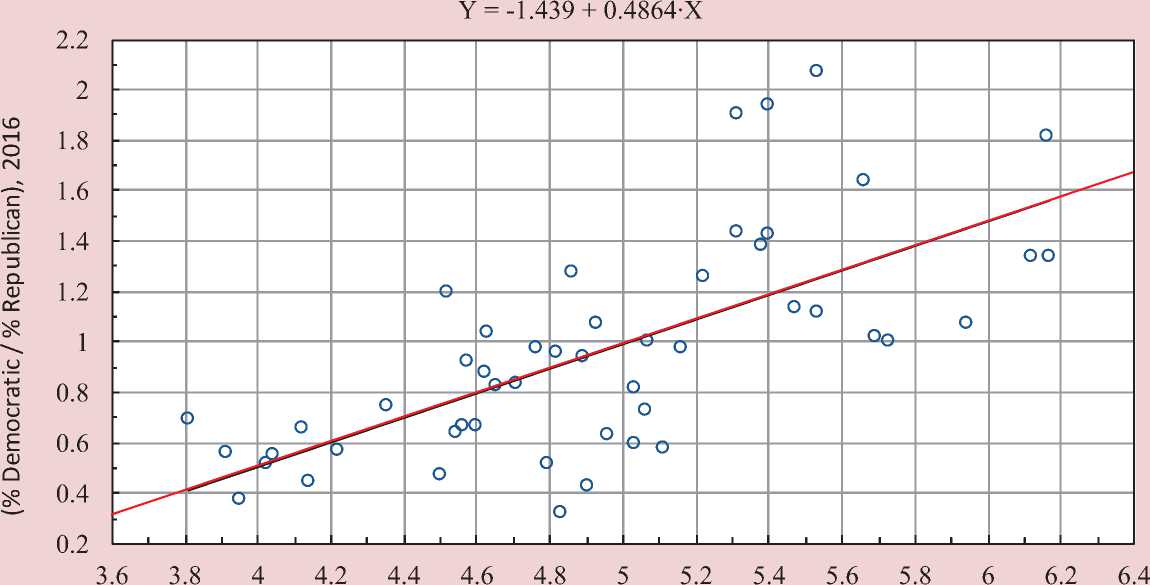
X – American Human Development Index (AHDI), 2013–2014

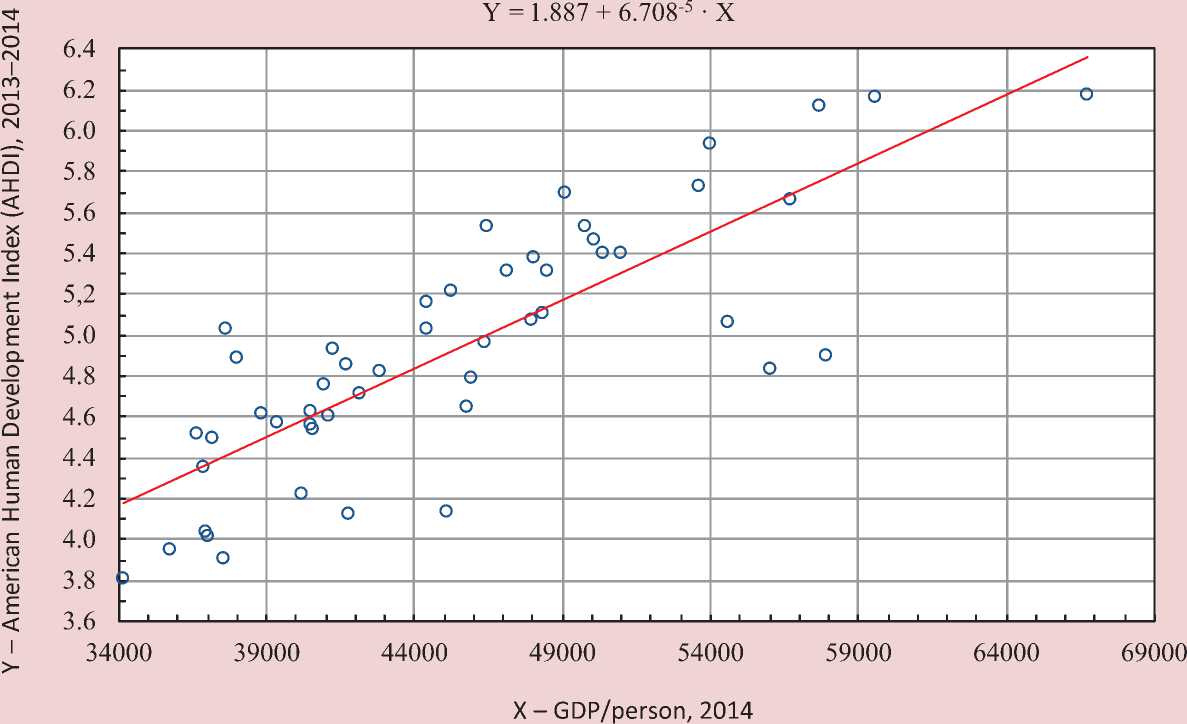
Figure 2. Graphic representation of the model AHDI = f (GDP / person)
regression analysis to understand whether AHDI in the United States is statistically related to gross domestic product per capita, a basic socio-economic feature of each state.
Finding a second order (follow-up) dependence between the American Human Development Index (AHDI) and the factor that indirectly determines the basic foundations of the quality of life (gross domestic product of U.S. states). Using the data from Table 2, we build a regression model (Fig. 2) of the relationship between data sets for U.S. states AHDI and the value of “GDP per capita” AHDI = f(GDP/person) .
The statistical characteristics of this model (R2 = 0.665; F-test = 95.29; standard error of approximation = 0.351) demonstrate a strong statistical relationship between AHDI and the value of “GDP per capita”.
Given the fact that AHDI is a comprehensive measure, such a high level of statistical relationship between the indicator “GDP per capita” and the human development index is quite unexpected.
Establishing a third order dependence between the American Human Development Index (AHDI) and road traffic accident rate, one of the practical manifestations of the quality of life in U.S. states . Road traffic accident rate is not the factor that determines AHDI , but it is closely linked to it. The value of “GDP per capita” largely determines the structure of the car fleet in a state from the standpoint of the price of cars and, as a
Figure 3. Graphical representation of the model of Human risk HR = f (AHDI)
E
Y = 39.413 -5.654 • X
|
- |
|||||||||||||
|
- |
|||||||||||||
|
- |
|||||||||||||
|
- |
1 |
||||||||||||
|
<2 |
л |
||||||||||||
|
- |
n ° |
о |
|||||||||||
|
- |
% |
0*"*--- |
|||||||||||
|
- |
о |
D |
|||||||||||
|
- |
о о |
о л |
|||||||||||
|
- |
о° |
о о |
о^ О |
||||||||||
|
- |
° 5 |
) о |
о |
П° |
|||||||||
|
- |
о |
о |
|||||||||||
|
- |
|||||||||||||
-
3 .6 3.8 4 4.2 4.4 4,.6 4.8 5 5.2 5.4 5.6 5.8 6 6.2 6.4
X – American Human Development Index (AHDI), 2013–2014
consequence, their quality and level of active, passive and post-accident security. In this regard, it is interesting to estimate the degree of statistical connection between the indicator of “Human risk HR”, widely used in world practice for intercountry and interregional comparative assessment of road safety [11], and AHDI. Figure 3 provides a graphical representation of the model HR = f(AHDI) , built according to the data as of 2014.
The statistical characteristics of this model (R2 = 0.556; F-test = 60.04; standard error of approximation = 3.067) also suggest the presence of a sufficiently strong statistical relationship between road traffic accident rate and the quality of life.
In general, the relationship HR = f(AHDI) shown in Figure 3 can be interpreted as an illustration of the existence of a relationship between different aspects of human activity, including driving, which is very important for Americans, and the quality of life. It is therefore important to assess the presence or absence of the influence of the actual accident rate as one of the grounds for political dissatisfaction with the existing political scenario in the country.
Establishing the statistical relationship between the results of political election and Human risk HR, a feature of road traffic accident rate . With the two indirectly related models – model (% Democratic /
Figure 4. Graphic representation of the model (% Democratic / % Republican) = f(HR)
Е о
ф
2.4
ф
о ф о
ф ОС
о
о
о Е ф О
Е ф о
0.2
Y = 9/X
2.2
1.8
1.6
1.4
1.2
0.8
0.6
0.4
|
о |
|||||||||||
|
о с |
|||||||||||
|
л |
|||||||||||
|
\ |
хО о |
||||||||||
|
и |
о\^ |
о |
о |
||||||||
|
Оо^ |
° |
0 |
|||||||||
|
о |
°о о |
||||||||||
|
с |
о |
■—-—-2 |
о |
о |
о |
||||||
|
о |
ио°с |
------ о |
о |
||||||||
|
о |
X - Human risk HR, 2014
4 6 8 10 12 14 16 18 20 22 24 26 28
% Republican) = f(AHDI) and model HR = f(AHDI) it is possible to link these two models using the dependence (% Democratic / % Republican)= f(HR) . Figure 4 provides a graphic representation of the model (% Democratic / % Republican) = f(HR) .
In this case, the approximation of the statistical data was carried out with the help of not the linear, but the reverse model, which is more suitable for experimental range. I must say that there is a certain sense in it, the essence of which lies in the fact that the linear perception of reality is not part of human nature. A normal human reaction to the deviation of the actual situation from the desired one (from an ideal picture of the world) is almost always non-linear [2].
The dependence presented in Figure 4 (R2 = 0.506; F-test = 49.17; standard error of approximation = 0.302) helps us establish a strong statistical relationship between the actual road traffic accident rate in U.S. states and the political scenario in the 2016 U.S. presidential election.
Conducting similar research for databases on the election of 2000 and 2008, when a rival political party was the winner . One of the most important issues in this study is to understand how the results obtained according to the data on the 2016 U.S. presidential election 2016 correspond to the general long-term logic of the political process? It is important to understand how stable the patterns of voting behavior are in the time when the
Table 3. Numerical values of the indicator of political preferences of American voters (2000; 2008; 2016) and various indicators of economic and social development in U.S. states*
No. U.S. state (constituent political entity of the United States of America) Numerical values of the indicator showing political preferences of American voters (2000, 2008, 2016) and various indicators of economic and social development in U.S. states 2000 [35] 2008 [36] 2016 [30] 2 го О D- 2 >, CZ CD E -ic' ro cd Ф = U О о £ s ^ О ГО 03 ОС QC c co , , c 2-So ° x CD О о ^ E ° - < 2 ro O D E го о оз 5 о о Q £ 5 ^ .2 03 CC DC c E 5 5 О 03 g CvJ о О E ° -< 2 ro Ь D- ₽ >, = co CD О 0^5^ .2 33 ГО 03 ОС ОС £= ZE E 5 co ro ° x о о 03 $ csj E ° -< 1. Alabama 0.75 3.94 0.65 3.92 0.55 4.04 2. Alaska 0.47 4.95 0.64 5.24 0.73 5.06 3. Arizona 0.88 4.59 0.85 4.75 0.94 4.89 4. Arkansas 0.90 3.71 0.66 3.81 0.56 3.91 5. California 1.26 5.09 1.65 5.39 1.94 5.40 6. Colorado 0.82 5.30 1.20 5.44 1.12 5.53 7. Connecticut 1.47 5.89 1.61 6.18 1.34 6.17 8. Delaware 1.31 4.96 1.68 5.09 1.26 5.22 9. District of Columbia Not considered due to its territory being disproportionate to other states 10. Florida 1.00 4.63 1.06 4.81 0.96 4.82 11. Georgia 0.78 4.45 1.11 4.63 0.88 4.62 12. Hawaii 1.51 5.32 2.67 5.56 2.07 5.53 13. Idaho 0.42 4.38 0.59 4.32 0.47 4.50 14. Illinois 1.28 4.98 1.68 5.24 1.44 5.31 15. Indiana 0.72 4.45 1.02 4.58 0.67 4.56 16. Iowa 1.02 4.77 1.23 4.94 0.82 5.03 17. Kansas 0.64 4.78 0.74 4.79 0.63 4.96 18. Kentucky 0.73 3.89 0.72 4.06 0.52 4.02 19. Louisiana 0.85 3.84 0.68 3.82 0.66 4.12 20. Maine 1.11 4.69 1.45 4.68 1.07 4.93 21. Maryland 1.43 5.46 1.72 5.74 1.07 5.94 22. Massachusetts 1.88 5.76 1.72 6.02 1.82 6.16 23. Michigan 1.11 4.88 1.39 4.94 0.98 4.76 24. Minnesota 1.07 5.43 1.23 5.61 1.02 5.69 25. Mississippi 0.71 3.54 0.77 3.55 0.69 3.81 26. Missouri 0.94 4.37 1.00 4.49 0.67 4.60 27. Montana 0.57 4.15 0.96 4.28 0.64 4.54 28. Nebraska 0.53 4.78 0.74 4.91 0.58 5.11 29. Nevada 0.94 4.41 1.28 4.47 1.04 4.63 30. New Hampshire 0.98 5.47 1.20 5.63 1.00 5.73 31. New Jersey 1.40 5.66 1.36 5.99 1.34 6.12 32. New Mexico 1.00 4.31 1.36 4.29 1.20 4.52 33. New York 1.71 5.28 1.75 5.62 1.64 5.66 34. North Carolina 0.77 4.25 1.02 4.46 0.92 4.57 35. North Dakota 0.54 4.39 0.85 4.79 0.43 4.90 36. Ohio 0.92 4.68 1.09 4.68 0.84 4.71 37. Oklahoma 0.63 3.97 0.52 3.93 0.45 4.14 38. Oregon 1.00 4.72 1.43 4.75 1.28 4.86 39. Pennsylvania 1.11 4.77 1.23 4.91 1.00 5.07 40. Rhode Island 1.91 5.04 1.80 5.46 1.38 5.38 41. South Carolina 0.72 4.05 0.83 4.19 0.75 4.35 42. South Dakota 0.62 4.39 0.85 4.52 0.52 4.79 43. Tennessee 0.92 4.00 0.74 4.08 0.57 4.22 44. Texas 0.64 4.39 0.80 4.50 0.83 4.65 45. Utah 0.39 4.71 0.55 4.72 0.60 5.03 46. Vermont 1.24 5.00 2.23 5.24 1.90 5.31 47. Virginia 0.85 5.01 1.15 5.39 1.14 5.47 48. Washington 1.14 5.24 1.43 5.26 1.43 5.4 49. West Virginia 0.88 3.63 0.75 3.82 0.38 3.95 50. Wisconsin 1.00 4.95 1.33 5.07 0.98 5.16 51. Wyoming 0.41 4.41 0.51 4.47 0.32 4.83 * Compiled with the use of: ,_2000 [35], wiki/United_States_presidential_election,_2008 [36], [30; 31].
Figure 5. Graphic image of the model (% Democratic / % Republican) = f(AHDI)
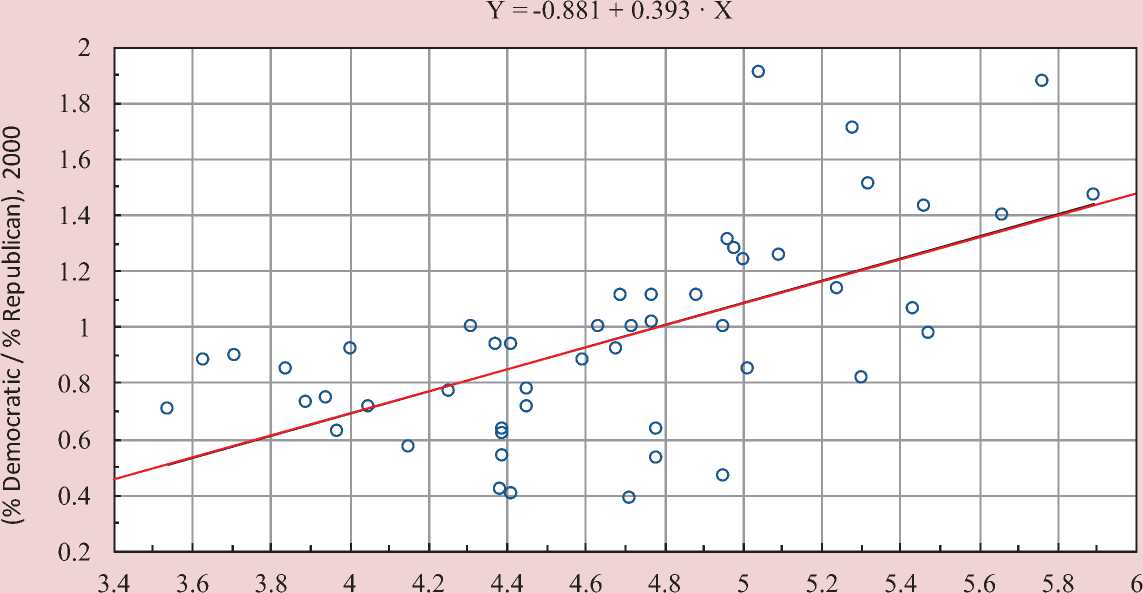
X – American Human Development Index (AHDI), 2000
Figure 6. Graphic image of the model (% Democratic / % Republican) = f(AHDI)
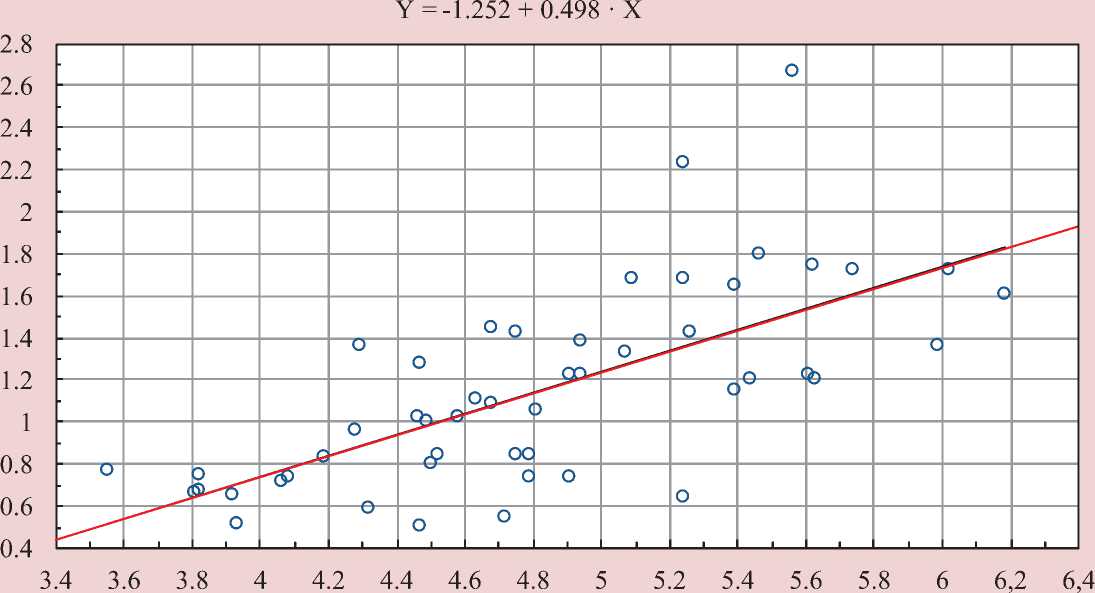
X – American Human Development Index (AHDI), 2008
Table 4. Models (% Democratic / % Republican) = f(AHDI)
|
Years of presidential election in the U.S. |
Model type % Ratio = a + b · AHDI |
Values of model parameters and their meaning |
||
|
a |
b |
Explanation of the physical meaning of parameter b |
||
|
2000 |
% Ratio = -0.88 + 0.39 · AHDI |
-0.88 |
0.39 |
b shows the degree of manifestation of the feature |
|
2008 |
% Ratio = -1.25 + 0.50 · AHDI |
-1.25 |
0.50 |
|
|
2016 |
% Ratio = -1.44 + 0.49 · AHDI |
-1.44 |
0.49 |
|
Conclusion. During the presidential election in 2008 and 2016 the influence of AHDI on the outcome of the election was expressed to a greater extent than in 2000.
representative of the rival political party is elected President? To answer this question, let us study the correlation between the value of AHDI and the relevant ratios (% Democratic / % Republican) in 2000 and 2008. This election is interesting mainly due to the change of representatives of various political parties in the position of President. In particular, in 2000, presidential power passed from the representative of the Democratic Party (Bill Clinton) to Republican George W. Bush; in 2008, the presidential election was again won by a Democrat (Barack Obama). Table 3 shows the information necessary for the analysis.
Figures 5 and 6 show graphic images of the models (% Democratic / % Republican) = f(AHDI) defined according to the data as of 2000 and 2008. The dependencies corresponding to the election of (Fig. 5) and of 2008 (Fig. 6) are essentially identical to the counterpart based on the data as of 2016 (see Fig. 1). I.e., obviously, these dependencies are fairly stable and they reflect the underlying processes typical of American society. Besides, the statistical characteristics of the models (% Democratic / % Republican) = f(AHDI) defined according to the data as of 2000 and 2008 are virtually identical to their counterpart built according to the data as of 2016.
In this regard, it is necessary, at least in the first approximation, to understand the cause of this stability. Table 4 shows for comparison the linear models (% Democratic / % Republican) = f(AHDI) that identify the processes under consideration.
We can see that for the models of 2008 and 2016 the value of parameter b in the model is virtually the same (0.50 and 0.49, respectively), which means that the transfer of power from the Republicans to the Democrats (2008) and from the Democrats to the Republicans (2016) equally depended on how well the current government promoted the quality of life of the population.
Discussion of research findings. The study carried out by the author helped identify the correlation relationships between the results of the 2016 U.S. presidential election and the characteristics of the American Human Development Index (R2 = 0.469) and Human
-
2 = 0.506) for each state. The
It can be assumed that the voters expect the relationships show that there is a statistical dependence between the quality of life in various U.S. states and the results of electoral behavior in these states.
Considering the specifics of the models obtained, let us try and find the answers to the questions put earlier.
-
• Was voting for Donald Trump as President of the United States an element of the protest movement of Americans who are tired of politics of the Democratic Party? The dependence (% Democratic / % Republican) = f(AHDI) shown in Figure 1 proves that, most likely, there is a certain logic in this thesis. People voted for Hillary Clinton in those states where the quality of life is high (AHDI > 5.2) ; electors from the states with a relatively low quality of life (AHDI < 5.2) voted for Donald Trump.
-
• Is this choice associated with the essential needs of the citizens of the United States in the changes in both external and domestic policy? It is easy and, at the same time, difficult to answer this question. On the one hand, according to the dialectical law of negation of the negation, this argument is quite legitimate. On the other hand, it is unclear how these sentiments can be assessed numerically. Probably, Trump’s election theses about the necessity to turning the focus of attention of the federal authorities from
foreign policy to domestic policy appealed to the population of those states in which the quality of life leaves much to be desired.
Republican Party not only to reverse the priorities from foreign policy to domestic policy, but also to introduce changes in the country, in particular, to improve the situation in those states where the quality of life is low.
-
• Were any spatial features of electoral behavior in different U.S. states manifested during the 2016 election? There were several such features. In particular, in nine states (about 18% of the total number of states) a large number (10%) of the votes were cast for a third candidate. This is one of the facts of negation of the candidates from the Democratic and Republican parties, i.e., in American politics the influence of the third force is gradually increasing. Another feature of the 2016 election is seen in an explicit confirmation of a theory of R. Kaplan [9] about the geographical aspect of economic and political preferences of voters. Residents of highly developed coastal areas are committed to a liberal democratic ideology, the inhabitants of continental regions of the country are more conservative and support the established norms of life. As a third feature we can recognized the existence of several states in which electoral behavior of the population differs significantly from the general trend, typical of most U.S. states. It is primarily the states of Hawaii and California, whose commitment to the values of the Democratic
Party is much higher than could be expected in accordance with the model (% Democratic / % Republican) = f(AHDI) (see Fig. 1). The opposite of these states, according to the specifics of electoral behavior are North Dakota, South Dakota, Wyoming and Nebraska (the states of the Midwest), which are characterized by a pronounced tendency to support the Republicans. If we compare these groups of states by the actual value of the ratio (% Democratic / % Republican), then the difference is four times. This figure can be characterized as the level of significant differences between the fundamentals of the worldview of the population of various states. That is why, upon the election of Donald Trump President, in some areas of the country and particularly in the District of Columbia serious social unrest [34] was registered. A number of popular U.S. persons, mainly from the show business, declared they rejected the current political choice that the U.S. had made [21]. Perhaps, we jump to conclusions when we speak about a political split in the country; however, its initial signs were clearly manifested in the United States in November–December 2016.
Another important remark can be made while analyzing the data in Table 3, which presents the dynamics of the indicator (% Democratic / % Republican) in 2000–2016 in different states. Some of them (Alabama, Arkansas, Kentucky, Louisiana, Oklahoma, Tennessee, West Virginia) experienced a steady deterioration in the electoral attitude toward the policy of the Democratic Party, regardless of the activities of the President. It should be noted that these states, most of which belong geographically to the the country, are outsiders according to the quality of life.
Summarizing the results. The above models and reasoning can serve as the basis for building a spatial-logical model for formalizing the political choice of the American voter. The corresponding line of the behavioral choice of the voters in the U.S. can be described with the help of the following causal model (2).
Historical development of the United States as a nation – development of territorial space of the country by immigrants, often passionarians (according to L.N. Gumilev [6]), – formation of national demographic and cultural-historical features of behavior in the population of different states – gradual formation of regional clusters, the population in which
(2) acquires certain styles of worldview, roughly differentiated as conservative and innovative-mobile – emergence of traditions and rules of social and consumer behavior – implementation of commitment to these traditions in practice – comparison of the results of daily manifestation of assimilated life style to some desired subjective models – development of political culture – implementation of the ideology of this culture in the election.
The model (2) that shows the formalization of political choice of the voter is not unique or typical only of the United States.
odels that show the link between the involved Russian hackers, can serve as a influence of the quality of life in the territorial entities of any country and the outcome of agreement or disagreement with the policy of the ruling party in a more or less adequate form can be formalized for any other country in the world. The protest political movement almost always begins with a question: “Is there any chance to improve my life under the leadership of the country’s ruling party”? Depending on the priority answer to this question the results of the next political election are generated. As for the U.S. in 2017, we can say: Americans are willing and waiting for change.
What did the first days of Donald Trump’s presidency show? Undoubtedly, the U.S. presidential election is a global event that forms the so called “new reality”. It stands to reason that Anatoly Chubais, who participated in the 47th World Economic Forum in Davos (January 17–20, 2017), described the psycho-emotional environment of the forum as “the horror of a global political catastrophe” [19]. It may be that Trump and his public behavior and promises do not correspond to the expectations and strategies of the world’s political “elite”, that the brightest representatives of this elite were confused even for the time required for the understanding of an event and selecting a new action strategy. At the same time there began a search for an external initiator of Trump’s victory. The scandals around the attacks on the campaign headquarters of the U.S. Democratic Party, which allegedly telling example of such actions [18].
It is known that the potential of the actions of the newly elected President can almost always be judged by the initiatives of the first one hundred days of the presidency [17]. What did Donald Trump and his team do in the early days in power that was of importance? Without pretending to provide complete facts, I shall name the following. First, he formed his presidential Office. Second, he initiated a number of important developments in the foreign and domestic policy. Third, he made a number of bold statements that became landmarks in his strategy. While analyzing what happened in January–February 2017, analysts at RBC [16] point out that within six months in office, Trump has issued 15 decrees.
To date, key positions in the Trump Administration are determined: Rex W. Tillerson became secretary of state, Jeff Sessions – attorney general, James Mattis – secretary of defense, Mike Pompeo – director of the Central Intelligence Agency. The candidates for the positions of the secretary of transportation, education, health, and homeland security have been approved as well. Trump has proposed conservative Neil Gorsuch to the Supreme Court of the United States. Much attention was paid to the scandal concerning the resignation of Trump’s national security advisor Michael Flynn, who met several times with Sergei Kislyak, the Russian Ambassador to the United States, in the summer of 2016 and was seen at the celebration of the anniversary of the news agency Russia Today on December 10, 2015 in Moscow at the same table with Vladimir Putin [32].
The most important decisions that Trump adopted in domestic politics were the launch of the process of abolition of Obamacare – healthcare reform undertaken by his predecessor, Barack Obama, and the signing of the immigration act prohibiting entry into the United States to the citizens of seven countries (Syria, Iraq, Iran, Sudan, Libya, Somalia and Yemen).
The most important foreign policy actions undertaken by Trump and his administration include the meetings with the prime ministers of the United Kingdom, Japan, Canada and Israel, as well as the White House statement that Donald Trump expects Russia to give Crimea back to Ukraine and reduce violence in Ukraine.
It is also significant that Trump has publicly quarreled with leading American media such as The New York Times, CNN, ABC, NBC and The Washington Post, all of which informed the public about the contacts between the people from Trump’s environment and the Russian Ambassador to the U.S. Sergei Kislyak.
And probably the most significant fact is Trump’s request to the U.S. Congress concerning the allocation in March 2017 of additional 54 billion dollars to be added to the biggest military budget in the world (604.5 billion dollars) [1].
Experience for Russia. In the the results of the U.S. presidential election it is necessary to answer the two questions that are most important for Russia and Russians:
-
• What are the implications of the results of the U.S. presidential election in 2016 for the entire world politics and for Russia in particular?
-
• What key conclusions out of Trump’s victory in the presidential race in the United States in 2016 must our leaders make? What circumstances need to be taken into account by the Russian authorities before the upcoming presidential election in Russia in 2018?
possibility of such approaches can be advertising. However, it is unlikely that this proven by the fact that Mike Pompeo and James Mattis – obvious “hawks”, i.e. advocates of a power approach to foreign political affairs according to the “hawks– doves” classification – were appointed to key positions [5; 10].
For Russia and its leadership, in the author’s opinion, the effects of Donald Trump’s presidency can be quite unexpected. Indeed, Trump has repeatedly declared his willingness to seek cooperation with the Kremlin. At the same time, it is not certain whether he considers cooperation as a search for mutually acceptable solutions, rather than for those that he sees as being advantageous for the United States.
With regard to the second essential question, there are wide opportunities for reflection on possible strategies for the next actions of our government for the coming year. Who could imagine a year before the U.S. presidential election that the outcome would be as it was on November 08, 2016? Even in September–October 2016, it seemed that Donald Trump had no serious reasons for being confident in his victory. Experts argue [14] that a large contribution to Trump’s victory was made by experts from Cambridge Analytica specializing in the creation and dissemination of the so-called targeted advertising. This technology is based on gathering data about Internet users and creating a special, point-targeted advertising for them, including political modern method of information warfare would have worked if the American public would be satisfied with the policy, especially in domestic affairs, which was conducted by representatives of the U.S. Democratic
Party. Another consideration is that the third law of dialectics – the law of negation of the negation – on the example of American political life clearly testifies that society demands a new quality of life, including that in the sphere of politics. Obviously, the lack of novelty in the practices of public life sooner or later creates an atmosphere that in our country was named “stagnation”, and it is not the atmosphere that contributes to the development of civil society, economy, politics and the state in general. In this regard, a wake-up call for our government is the fact that in general the interest in political life on the part of Russian society is gradually decreasing. Table 5 presents the data on voter turnout at the election to the State Duma of the Russian Federation of the 1st –7th convocations (1993–2016).
The data in Table 5 can be interpreted in different ways, but the fact remains: the results of the 2016 State Duma election turned out to be very controversial [8]. The leading role in the political life of the country belongs to the ruling party “United Russia”, and remains such. But in 2007–2016 there was a considerable decrease in voter turnout (almost by a quarter compared to the election of 2007).
Table 5. Statistics on the election to the State Duma of the Russian Federation
|
Feature |
Election to the State Duma of the Russian Federation of different convocations |
||||||
|
I |
II |
III |
IV |
V |
VI |
VII |
|
|
Date of election |
12.12.1993 |
17.12.1995 |
19.12.1999 |
7.12.2003 |
2.12.2007 |
4.12.2011 |
18.09.2016 |
|
Voter turnout, % |
54.81 |
64.76 |
61.85 |
55.75 |
63.71 |
60.21 |
47.88 |
|
% of the votes for the leading party |
22.92 |
22.30 |
24.29 |
37.56 |
64.30 |
49.32 |
54.20 |
|
Leading party |
LDPR |
KPRF |
KPRF |
United Russia |
United Russia |
United Russia |
United Russia |
|
Leading party head |
Vladimir Zhirinovsky |
Gennady Zyuganov |
Gennady Zyuganov |
Boris Gryzlov |
Vladimir Putin |
Dmitry Medvedev |
Dmitry Medvedev |
It indicates the slowly emerging political apathy of citizens, the subconscious reluctance of Russians to share the joy of victory and, especially, the bitterness of failure with the government.
What do Russian authorities have to pay attention to in the context of the results of the 2016 U.S. presidential election? First of all, to the objective necessity of change. The change aimed to improve the quality of life of Russians.
Conclusion. Spatial-logical modeling of the formalization of the political choice of the voter in a democratic society is just one of the possible options for analyzing the forecast of future political events. It is not a cure-all and it does not provide accurate estimates. However, this tool can be used to study the dynamics of public sentiment along with other approaches to building the models for assessing the changes in socio-political life. The 2016 U.S. presidential election has shown this quite clearly.
References Spatial and logical model of American electorate political choice formalization: experience for Russia
- Arbatov A. Gonka vooruzhenii Trampa: na chto khochet potratit' milliardy prezident SShA . Available at: http://russiancouncil.ru/inner/?id_4=8772#top-content..
- Bodalev A.A. Vospriyatie i ponimanie cheloveka chelovekom . Moscow: Izd-vo Mosk. un-ta, 1982. 200 p..
- Bushuev V.V., Golubev V.S., Korobeinikov A.A., Selyukov Yu.G. Chelovecheskii kapital dlya sotsiogumanitarnogo razvitiya . Moscow: IATs Energiya, 2008. 96 p..
- Vybory v GosDumu-2016 . Available at: https://ria.ru/infografika/20160918/1476912507.html#/summary..
- General ne znaet slov lyubvi . Available at: http://spbvedomosti.ru/news/politika/general_ne_nbsp_znaet_slov_nbsp_lyubvi/..
- Gumilev L.N. Etnogenez i biosfera Zemli . Leningrad: Izd-vo LGU, 1989. 496 p..
- Davydyants D.E. Otsenka kachestva zhizni cheloveka . Ekonomicheskii vestnik Rostovskogo gosudarstvennogo universiteta , 2006, issue 4, no. 1, pp. 98-105..
- Ilyin V.A. 13-e Poslanie Prezidenta: na povestke dnya transformatsiya vlasti . Ekonomicheskie i sotsial'nye peremeny: fakty, tendentsii, prognoz , 2016, no. 6(48), pp. 9-20..
- Kaplan R. Mest' geografii. Chto mogut rasskazat' geograficheskie karty o gryadushchikh konfliktakh i bitve protiv neizbezhnogo . Moscow: Kolibri, Azbuka-Attikus, 2015. 384 p..
- Novyi direktor TsRU Maik Pompeo: «yastreb» protiv Rossii . Available at: http://www.mk.ru/politics/2017/01/24/novyy-direktor-cru-mayk-pompeo-yastreb-protiv-rossii.html..
- Petrov A.I. Osobennosti formirovaniya avtotransportnoi avariinosti v prostranstve i vremeni . Tyumen': TyumGNGU, 2015. 254 p..
- Petrov A.I. Avtotransportnaya avariinost' kak identifikator kachestva zhizni naseleniya . Ekonomicheskie i sotsial'nye peremeny: fakty, tendentsii, prognoz , 2016, no. 3(45), pp. 154-172..
- Programma razvitiya OON: Indeks chelovecheskogo razvitiya v stranakh mira v 2015 godu . Available at: http://gtmarket.ru/news/2015/12/16/7285..
- Rassledovanie Das Magazin: kak Big Data i para uchenykh obespechili pobedu Trampu i Brexit . Available at: http://theins.ru/politika/38490..
- Sadovaya E.S., Sautkina V.A. Kachestvo zhizni naseleniya mira: izmerenie, tendentsii, instituty . Moscow: IMEMO RAN, 2012. 208 p..
- Tramp v Belom dome: ezhednevnik prezidenta SShA . Available at:http://www.rbc.ru/textonlines/03/03/2017/589afd179a7947a 2674f4afa? from=newsfeed..
- Tramp rasskazal o planakh na pervye sto dnei prezidentstva . Available at: https://ria.ru/world/20161122/1481859392.html..
- FBR i ANB opublikovali doklad o khakerskikh atakakh iz Rossii . Available at: http://www.vedomosti.ru/politics/articles/2016/12/30/671781-spetssluzhbi..
- Chubais: «Mir perevernulsya. Takoi uzhas v Davose ya pripomnyu tol'ko raz» . Available at: https://www.bfm.ru/news/344362..
- Elektronnaya biblioteka runeta. Donald J. Trump . Available at: http://booksee.org/g/Donald%20J.%20Trump..
- «Ya vsya v slezakh». Reaktsiya amerikanskikh zvezd na pobedu Trampa . Available at: https://life.ru/t/%D1%82%D1%80%D0%B0%D0%BC%D0%BF/928779/ia_vsia_v_sliezakh_rieaktsiia_amierikanskikh_zviozd_na_pobiedu_trampa..
- A Historic Number of Electors Defected, and Most Were Supposed to Vote for Clinton. Available at: http://www.nytimes.com/interactive/2016/12/19/us/elections/electoral-college-results.html
- American Human Development Index (AHDI). Available at: http://www.measureofamerica.org/maps/
- Bureau of Economic Analysis. Available at: https://www.bea.gov/regional/about.cfm
- General Election: Trump vs. Clinton. Available at: http://www.realclearpolitics.com/epolls/2016/president/us/general_election_trump_vs_clinton5491.html
- Gross domestic product 2015. Available at: http://databank.worldbank.org/data/download/GDP.pdf.
- Latest Election Polls 2016. Available at: http://www.nytimes.com/interactive/2016/us/elections/polls.html?_r=0
- Mapping the Measure of America. Available at: http://www.measureofamerica.org/maps/
- Measure of America. Of the Social Science Research Council. Available at: http://www. measureofamerica.org
- Presidential Election Results: Donald J. Trump Wins Clinton. Available at: http://www.nytimes.com/elections/results/president
- Presidential Election Results: Donald J. Trump Wins Clinton. Available at:http://www.nytimes.com/elections/results/president?action=click&pgtype=Homepage&clickSource=story-heading&module=span-abc-region®ion=span-abc-region&WT.nav=span-abc-region
- RT oproverg zayavleniya o tom, chto Flinnu platili za poyavlenie v efire kanala . Available at: https://ria.ru/world/20161213/1483474477.html..
- United States of America country profile. Available at: http://news.bbc.co.uk/2/hi/americas/country_profiles/1217752.stm
- US election 2016 live blog: ‘World collapsing before our eyes'. Available at: http://www.news.com.au/world/north-america/us-election-2016-live-blog-record-turnout-in-early-voting/news-story/e820878edf84c0749b734a05130589df
- United States presidential election, 2000. Available at: https://en.wikipedia.org/wiki/United_States_presidential_election,_2000
- United States presidential election, 2008. Available at: https://en.wikipedia.org/wiki/United_States_presidential_election,_2008
