Spatial distribution of ndvi seeds of cereal crops with different levels of weediness according to planetscope satellite data

Author: Pisman Tamara I., Erunova Marina G., Botvich Irina Yu., Shevyrnogov Anatoly P.
Journal: Журнал Сибирского федерального университета. Серия: Техника и технологии @technologies-sfu
Article in issue: 5 т.13, 2020.
Free access
The objective of the study is to assess the state of agricultural seeds (level of weediness) on the territory of the Krasnoyarsk Agricultural Research Institute of Federal Research Center «Krasnoyarsk Science Center of the SB RAS» near the village Minino according to satellite data. For this purpose, an algorithm for obtaining and processing PlaneScope satellite data for calculating the NDVI vegetation index of agricultural seeds has been developed. On its basis a map of the spatial distribution of NDVI wheat seeds with different levels of weediness has been created. According to PlanetScope satellite data, an opportunity to interpret areas of wheat seeds with high and low levels of weediness has been shown. It has been found that the NDVI value of pure plantation of wheat with a low level of weediness is greater than the NDVI value of wheat seeds with a high level of weediness.
Planetscope, ndvi, algorithm, cereal crops, weediness of crops
Short address: https://sciup.org/146281643
IDR: 146281643 | UDC: 528.8.04, | DOI: 10.17516/1999-494X-0247
Пространственное распределение NDVI посевов зерновых культур с различной степенью засоренности по спутниковым данным PlanetScope
Целью работы является оценка состояния сельскохозяйственных посевов (степени засоренности) на территории Красноярского НИИСХ ФИЦ КНЦ СО РАН вблизи пос. Минино по спутниковым данным. Для этого разработан алгоритм получения и обработки спутниковых данных PlanetScope для расчета вегетационного индекса NDVI сельскохозяйственных посевов. На его основе создана карта пространственного распределения NDVI посевов пшеницы с различной степенью засоренности. По спутниковым данным PlanetScope показана возможность дешифрирования участков посевов пшеницы с высокой и низкой степенью засоренности. Выявлено, что величина NDVI чистых посевов пшеницы и с низкой степенью засоренности больше величины NDVI посевов пшеницы с высокой степенью засоренности.
Text of the scientific article Spatial distribution of ndvi seeds of cereal crops with different levels of weediness according to planetscope satellite data
Цитирование: Письман, Т.И. Пространственное распределение NDVI посевов зерновых культур с различной степенью засоренности по спутниковым данным PlanetScope / Т.И. Письман, М.Г. Ерунова, И.Ю. Ботвич, А.П. Шевырногов // Журн. Сиб. федер. ун-та. Техника и технологии, 2020. 13(5). С. 578-585. DOI: 10.17516/1999-494X-0247
of assessing the level of weeding, when it is possible to estimate the state of fields by the colour tones of their images [2].
The most informative images for interpreting the state of agrophytocenoses used to be Landsat-7 with a resolution of 15-30 m. In 2006 the Alos satellite was launched to replace it, the images of which significantly differ in higher resolution – up to 10 m. They allow monitoring the state of agriculturally used areas [3]. Nowadays MODIS data are mostly used, on the basis of which the systems of immediate remote monitoring of seeds of many countries in the world are built [4]. Since November 2018, the PlanetScope satellite constellation has appeared with a spatial resolution of 3 m. All PlanetScope satellites have new sensor characteristics that allow improved spectral resolution.
The objective of the study is to develop and pilot the method of satellite assessing the state of seeds of agricultural crops (level of weediness) by means of PlanetScope satellite data.
Material and methods
The object of the research is agriculturally used areas (seeds of agricultural crops) on the territory of the Krasnoyarsk Agricultural Research Institute of Federal Research Center «Krasnoyarsk Science Center of the SB RAS» near the village Minino [5, 6].
For interpreting the agricultural seeds with different weed level PlanetScope satellite data for the 9th of July, 2019 have been used.
Normalized Difference Vegetation Index – NDVI has been used in the study. NDVI values are calculated by means of the formula (1)
NDVI = (NIR - RED) / (NIR + RED), (1)
where RED – CSB (coefficient of spectral brightness) in a red part of visible spectrum, NIR corresponds to CSB (coefficient of spectral brightness) of near infra-red emission.
This index is based on two most stable (independent of other factors) sections of spectral-reflection curve of vascular plants. That is, high photosynthetic activity (as a rule, connected with dense vegetation) leads to less reflection in the red region of the spectrum and more reflection in the IR range. The ratio of these indicators to each other allows us to separate and analyze plant objects from other natural objects clearly. Using not a simple relationship, but a normalized difference between the minimum and maximum reflections increases the accuracy of measurement, allows us to reduce the influence of such phenomena as differences in illumination of the image, cloud coverage, haze, and absorption of radiation by the atmosphere. For vegetation, the NDVI index takes positive values, and the larger the green phytomass is, the higher NDVI is. Species composition of vegetation, conditions, exposure and elevation angle of surface influence on NDVI values. NDVI can take values from –1 to 1. For green vegetation, the index usually takes values from 0.2 to 0.8.
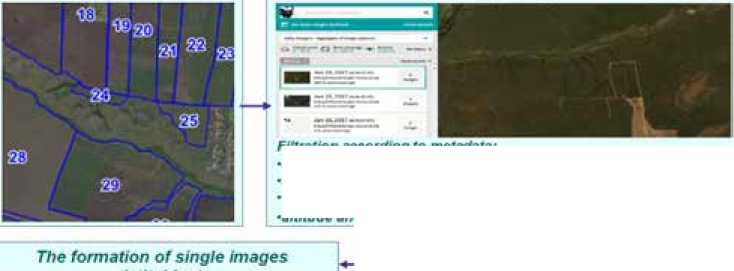
The algorithm used for construction a spatial distribution map of NDVI agricultural fields is shown in Fig. 1.
For biological assessment of the weed level of cereal crops, ocular method of record-keeping of weeds is used [7]. The sense of the method is that a field is crossed on the diagonal and weeds of all species are recorded at regular intervals. Observation data are evaluated on a four-point scale:
-
1 level – when weeds are found singly (up to 5% of the number of cultivated plants), a weak degree of weediness;
The formation of a set of images in the Planet Explorer Online service for the growing season of 2019
Digital map of agricultural fields
i planet
PlanetScope selected data loading
(stitching)
Calculation of NDVI for each image NDVI = (к4*Ь4 - кЗ"ЬЗ)/(к4*Ь4 * кЗ'ЬЗ) Wiere K4 - the саОгабсп coeflloent in the near Infrared region, k3- the cahbrenon coefficient In the red region. b3, b 4 - the PlanetScope channels
Filtration according to metadata:
■cloud coverage,
■spatial resolution,
•deviation from nadir.
•attitude and azimuth of the sun
NDVI dataset for the whole growing season
May 2019
September 2019
Statistics of NDVI values for each field
■535
Fig. 1. Flowchart of algorithm for obtaining and processing PlanetScope satellite images for the construction of NDVI spatial map of agricultural fields
-
2 level – weeds are visible among cultivated plants (up to 25%), the average degree of weediness;
-
3 level – the number of weeds is close to the number of cultivated plants (up to 50%), a strong degree of weediness;
-
4 level – the number of weeds is the same or more than cultivated plants and the latter are strongly subdued, a very strong degree of weediness.
Results and Discussion
Weeds are plants contaminating agriculturally used areas and causing damage to crops. Weeds include plants not cultivated by men, but having historically adapted to the conditions of cultivation of crop plants growing with them and damaging crops. Weeds are found in fields, meadows and other agriculturally used areas.
The main damage caused by weeds is a sharp decrease in crops yield with a simultaneous deterioration of the quality of the received products. This is due to the competition between crop plants and weed plants for the basic factors of life – water, light and nutrients.
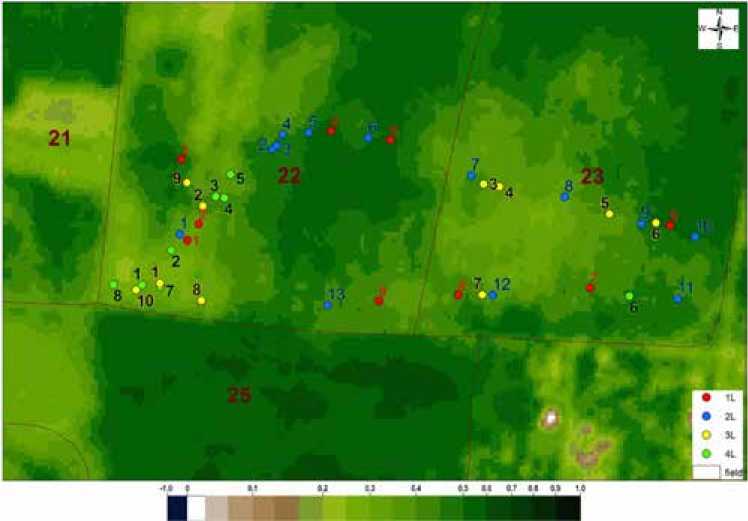
Fig. 2. Spatial distribution of NDVI of wheat seeds with a different weed level
Figure 2 shows the map of spatial distribution of NDVI of wheat plantings with different weed level for the 9th of July 2019. The areas of wheat seeds with different degrees of contamination are indicated as follows: red and blue circles means the ones with a low degree of contamination (1 and 2 levels), yellow and green circles correspond to the areas with a high degree of contamination (3 and 4 levels). The NDVI value (an indicator of photosynthetically active biomass) is illustrated by means of green color: the darker the color is, the higher the NDVI value and the greater the amount of crude aboveground phytomass of cultivated and weedy vegetation we obtain. Consequently, a high NDVI value corresponds to a large amount of crude aboveground biomass of cultivated plants with a low degree of contamination. A low NDVI value corresponds to a small amount of crude aboveground biomass of cultivated plants with a high degree of contamination.
Thus, as a result of monitoring the cereal crops seeds using PlanetScope satellite data, it is possible to evaluate the effect of weeds on the NDVI value of agrocenoses growth, i.e., the possibility of wheat crops areas interpretation with a high and low degree of weed contamination is shown.
The obtained data allow us to conclude that the NDVI values received in the middle of the growing season (at least for spring cereals) may reflect the degree of contamination rather than the state of the crop. Therefore, the use of such data when predicting crop yields can cause poor quality of forecast models in regions where crop weediness is very strong [8].
The map of the spatial distribution of NDVI agricultural vegetation shows the areas of wheat seeds with different degrees of weediness in several replications (Fig. 2). Figure 3 shows the averaged NDVI data of wheat crops with different degrees of weediness (from 1 to 4 levels). As a result, it has been confirmed that the NDVI value of pure wheat crops with a low degree of weediness is higher than the NDVI value of wheat crops with a high degree of weediness.
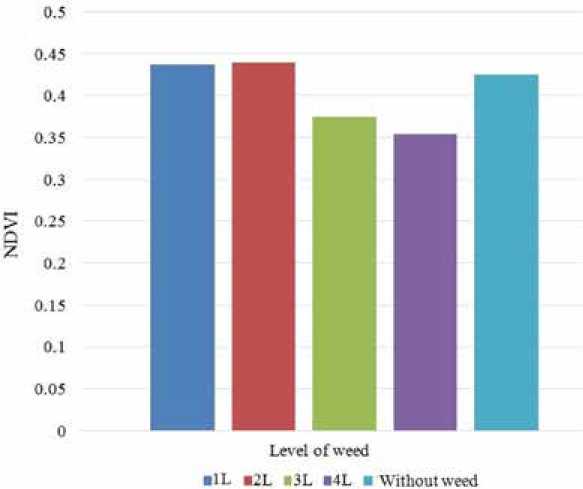
Fig. 3. The average NDVI value of wheat seeds with different levels of weediness according to satellite data
To carry out comprehensive assessment of the influence of weediness level of agricultural crops on the amount of crude aboveground biomass of cultivated plants from satellite data, it is necessary to analyze the spatial distribution of NDVI of vegetation of cereal crops during the growing season. In this case, as a result of the assessment of a high degree of weediness of crops on large areas, timely usage of herbicides and preservation of crop yields are possible.
For example, as a result of satellite studies (according to MODIS), the authors found out that the value of NDVI in the middle of the growing season is determined by the total effect of cultivated vegetation and weeds, and at the end of the season, the role of weeds in the formation of NDVI prevails [9]. Theoretically, at this time, NDVI can be used for assessment of total degree of weed contamination of arable land. In addition, it has been noted that the spatial distribution of crops weediness varied at different times of observation.
Conclusion
Due to the results of this study, the following conclusions have been made:
-
– an algorithm for obtaining and processing PlanetScope satellite data to calculate the vegetation index NDVI of agricultural crops has been developed;
-
– as a result of a comparative analysis of the NDVI value of wheat crops with different degrees of weediness, the possibility of assessing the sanitary condition of the studied crops is shown;
-
– according to PlanetScope satellite data, the possibility of interpretation wheat crops areas with a high and low degree of weediness has been shown. It has been revealed that the NDVI value for wheat crops with a low degree of weediness is higher than for wheat crops with a high degree of weediness.
The analysis of the obtained results showed the necessity to combine data obtained due to remote sensing method and ground-based field studies. It should be noted that the method of processing satellite data used at the current stage of work allows us to estimate only the degree of field contamination. The development of an algorithm for determining the types of weeds and the application of this algorithm to interpret images of agricultural crops are the tasks of the next stage of the research. To solve these problems, it is necessary to search for the most informative channels distinguishing a weed plant from other vegetation. For this, specialized algorithms of processing hyperspectral images are required [10].
Acknowledgements / Благодарности
The study was carried out within the framework of the Comprehensive Program of Basic Research of the SB RAS “Interdisciplinary Integration Studies” for 2018-2020. (Project No. 74).
Исследование выполнено в рамках Комплексной программы фундаментальных исследований СО РАН «Междисциплинарные интеграционные исследования» на 2018-2020 гг. (проект № 74).
References Spatial distribution of ndvi seeds of cereal crops with different levels of weediness according to planetscope satellite data
- Wu B., Meng J., Li Q, Yan N., Du X., Zhang M. Remote sensing-based global crop monitoring: experiences with China's CropWatch system, International Journal of Digital Earth, 2014, 7(2), 113-137
- Sims D.A., Gamon J.A. Relationships Between Leaf Pigment Content and Spectral Reflectance Across a Wide Range of Species, Leaf Structures and Developmental Stages, Remote Sensing of Environment, 2002, 81(2-3), 337-354
- Сергеева О.С., Красницкий В.М., Березин Л.В. Мониторинг почвенного покрова Западной Сибири по данным дистанционного зондирования, Плодородие, 2010, 1, 7-9
- Becker-Reshef I., Justice C., Sullivan M., Vermote E., Tucker C., Anyamba A., Small J. Monitoring Global Croplands with Coarse Resolution Earth Observations: The Global Agriculture Monitoring (GLAM) Project, Remote Sensing, 2010, 2 (6),1589-1609
- Erunova M.G., Shpedt A.A., Trubnikov Y.N., Yakubailik O.E. Geospatial database for digitalization of agriculture of the Krasnoyarsk territory. IOP Conference Series: Earth and Environmental Science, 2019, 315, 032022 DOI: 10.1088/1755-1315/315/3/032022
- Pisman T.I., Shevyrnogov A.P., Larko A.A., Botvich I.Y., Emelyanov D.V., Shpedt A.A., Trubnikov Y.N. The Information Content of Spectral Vegetation Indices in the Interpretation of Satellite Images of Cultivated Fields, Biophysics, 2019, 64(4), 588-592
- Бекетова О.А., Иванова Н.В., Жохова Е.А. Особенности видового состава сорной флоры Красноярского природного округа, Вестник КрасГАУ, 2019, 4, 10-15
- Rembold F., Atzberger C., Savin I., Rojas O. Using low resolution satellite imagery for yield prediction and yield anomaly detection, Remote Sensing, 2013, 5(4), 1704-1733
- Савин И.Ю., Докукин П.А., Вернюк Ю.И., Жоголев А.В. О влиянии засоренности на NDVI посевов ярового ячменя, определяемого по спутниковым данным MODIS, Современные проблемы дистанционного зондирования Земли из космоса, 2017, 14(3), 185-195
- Бондур В.Г. Современные подходы к обработке больших потоков гиперспектральной и многоспектральной аэрокосмической информации, Исследование Земли из космоса, 2014, 1, 4-16
