Spatiotemporal variations of vegetation change and its response to climate change in Mongolia during 1982-2015

Author: Wurihan, Sainbuyan Bayarsaikhan, Bao Yuhai, Tong Siqin, Jin Hugejiletu, Yang Xueliang
Journal: Природа Внутренней Азии @nature-inner-asia
Section: Биология
Article in issue: 2-3 (21), 2022.
Free access
Using the 1982-2015 GIMMS NDVI growing season (April - October) data, the average temperature and monthly precipitation data of 60 meteorological stations in the same period, the linear trend analysis method, the Mann-Kendall trend analysis method, the Pearson correlation we have studied the relationship between vegetation cover change and climate change in Mongolia and their response relationship. The results show that in the past 34 years, the average NDVI of the growing season in Mongolia has gradually increased from south to north in space. From the seasonal point of view, the NDVI showed an increasing trend in all three seasons. From the impact of vegetation NDVI, the impact of precipitation on vegetation NDVI was greater than that of temperature. The response of different vegetation types to precipitation is greater than that of air temperature, and alpine grassland vegetation has a significantly effect on air temperature and precipitation
Vegetation type, air temperature, precipitation, temporal and spatial evolution characteristics
Short address: https://sciup.org/148325685
IDR: 148325685 | UDC: 581.522(517.3) | DOI: 10.18101/2542-0623-2022-2/3-37-51
Пространственно-временные изменения растительности и ее реакция на изменение климата в Монголии за 1982-2015 гг
С помощью данных вегетационного периода, индекса GIMMS NDVI 19822015 гг. (апрель-октябрь), данных о средней температуре и месячных осадках 60 метеостанций за тот же период, метода анализа линейных трендов, метода анализа трендов Манна-Кендалла, корреляции Пирсона изучены взаимосвязи между изменением растительного покрова и климата в Монголии. Результаты показывают, что за последние 34 года средний индекс NDVI вегетационного периода в Монголии постепенно увеличивался с юга на север в пространстве. С сезонной точки зрения индекс NDVI демонстрировал тенденцию к увеличению все три сезона. Реакция NDVI растительности на осадки была больше, чем на температуру, также как и реакция разных типов растительности. На альпийские луга оказывают существенное влияние температура воздуха и осадки.
Text of the scientific article Spatiotemporal variations of vegetation change and its response to climate change in Mongolia during 1982-2015
The relationship between global climate change and terrestrial ecosystems (global change and terrestrial ecosystem, GCTE) is one of the important contents of global change research [Walker et al., 1997]. Vegetation is an important part of terrestrial ecosystem, connecting soil, hydrosphere and atmosphere, promoting material migration and energy exchange in each circle, and playing an important role in climate regulation, terrestrial carbon cycle, soil and water conservation, etc. [Piao et al., 2003; Wang et al., 2011] . Climate change is one of the main factors that change the growth, structure and function of vegetation [Zhou et al., 2011]. The research on the response of vegetation to climate change has become one of the main contents of global change research [Mu et al., 2012; Sun et al., 2010]. Therefore, starting from the relationship between vegetation and climate, revealing the response mode and intensity of regional and global vegetation activities to climate has become a hot issue in global change research [Piao et al., 2003; Cui et al., 2009; Jia, 2012]. In particular, the application of satellite remote sensing data in the monitoring of vegetation changes at the global and regional scales has further promoted global change research [Tucker et al., 2001; Zhou et al., 2001; Gan et al., 2011; Chen et al., 2008]
Mongolia is a major part of the Mongolian Plateau [Chen et al., 2019]. The southern part of Mongolia borders Inner Mongolia, China. Its ecological environment, natural resources, and social culture are closely related to China, and it is the most important green ecological barrier in northern China. Other geographical locations have unique advantages in the construction of the “China-Mongolia-Russia Economic Corridor” and are the main cooperation areas of the “Belt and Road” [Wang et al.,2018]. The climate in this region is dominated by typical continental arid and semi-arid climates, which are both sensitive to climate change and fragile ecosystems. The vegetation types from north to south are alpine grassland, forest, meadow steppe, typical steppe, desert steppe sparse vegetation, and the grassland area accounts for about 60% of the total area of Mongolia. In addition, Mongolia is a country with a vast land and sparse population, and is one of the least populous countries in the world [Bao et al., 2020] (population density is 2 people/km2). In terms of the degree of influence and difference of the process, the region has certain regional characteristics. In recent years, Mongolia’s terrestrial ecosystem has been significantly affected by climate change, such as lake area shrinking [Tao et al., 2015], drought aggravating [Tong et al., 2018], forest and grassland fires [Li et al., 2016] and forest diseases and insect pests [Huang et al., 2018] and other natural disasters occur frequently, which may be directly or indirectly Affect the ecological environment of northern China. Therefore, it is necessary to study the relationship between vegetation cover change and climate change and their response at the national scale of Mongolia in the past 30 years.
This study uses the third-generation NDVI (normalized difference vegetation index) data (NDVI3g) of the Global Inventory Modeling and Mapping Studies (GIMMS) from 1982 to 2015, combined with the temperature, precipitation and vegetation type data over the same period, to analyze On the basis of the interannual and seasonal variation characteristics of vegetation NDVI in Mongolia, its response to climate change was discussed. The purpose is to reveal the trend of vegetation growth and its main drivers in Mongolia at different temporal and spatial scales, and to provide a reference for understanding the overall development trend of the ecological environment in the region and for ecological environment construction and disaster prevention and mitigation.
Overview of the Study Area
In this paper, Mongolia is selected as the study area. Its geographical location is (41°35′–52°09′ N, 87°44′–119°56′ E), which is an inland plateau country and the second largest in the world. The landlocked country has a total land area of about 1.56 million km2. It borders the Siberia region of Russia in the north and the Inner Mongolia Autonomous Region of China in the south. The border with China is 4 770 km long (Figure 1).
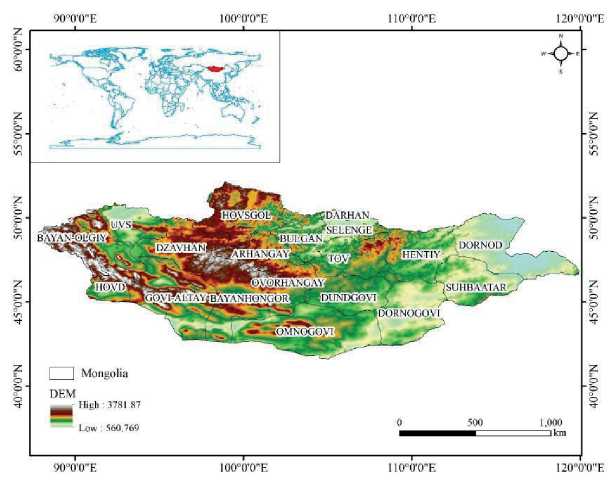
Figure 1. Location map of the study area
Mongolia’s terrain gradually decreases from west to east, with an average elevation of 1 580 meters. Most areas have a continental temperate grassland climate with obvious seasonal changes. Winters are long with frequent blizzards and snow; summers are short with large temperature differences between day and night; spring and autumn are short. The annual average temperature fluctuates from -8 to 6°C, decreasing from south to north. The frost-free period is about from June to September, with only 90–110 days. The average annual precipitation is about 120–250 mm, 70% of which is concentrated in July and August.
Data Sources and Methodology
Data sources
The meteorological data used in this study were provided by the School of Geographical Sciences, Inner Mongolia Normal University. For the monthly average temperature and monthly precipitation of 60 meteorological observation stations in Mongolia from April to October every year from 1982 to 2015, using the ArcGIS 10.2 environment, according to the geographical location of the meteorological station, using Kriging (Kriging) interpolation. The temperature and precipitation data were processed by the method to obtain the rasterized monthly temperature and precipitation data with the same spatial resolution and projection as GIMMS NDVI, which were used for the research on the variation trend of NDVI at the pixel scale and its response to climate (Figure 2).
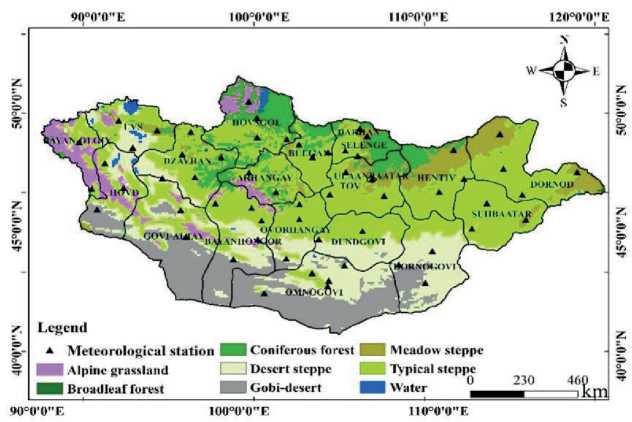
Figure 2. Weather site map
The vegetation type data comes from the Mongolian National Atlas. The vegetation type data in the atlas are scanned, geometrically corrected, digitized, etc., to obtain 6 vegetation types: alpine steppe, broad-leaved forest, coniferous forest meadow steppe, desert steppe, Gobi desert and typical steppe. Variation trends of vegetation types NDVI and their climatic responses. Livestock numbers and population data were obtained from the Mongolian N ational Statistical Information Service Network1.
The remote sensing data are GIMMS NDVI3g V1 data from 1982 to 20151, the temporal and spatial resolutions are 15 d and 0.0833, respectively °. Most of the vegetation in the study area stops growing in winter or is affected by snow cover. The NDVI data from April to October (the growing season) are selected for research every year. The maximum value synthesis processing was performed on the monthly two scene data to obtain a monthly-scale NDVI time series data set to further eliminate the influence of clouds, aerosols and other non-vegetation factors existing in the 15d NDVI. On this basis, the average value of NDVI from April to May, June to August and September to October was calculated to obtain NDVI in spring, summer and autumn, which was used to analyze the variation trend of NDVI in different seasons and its climate response. The average NDVI in the three growing seasons was further calculated to obtain the average NDVI in the growing season, and the temporal and spatial trend of annual NDVI was analyzed.
Methodology
Linear Trend Analysis
The change trend rate is the climate trend rate, which describes the change trend of meteorological elements in a long-term series. Generally, a linear trend line is used to fit the time series of meteorological elements over the years, and 10 times the slope of the trend line is the trend rate.
For example, if there is no sequence X = (Хі.хг.-.Х^ , then:
у = а + bx
In the formula, а is the regression constant, and b is the regression coefficient, also known as the slope, which are estimated by the least squares method:
1 = £іһі(Хі-х)(Уі-Ук = 2"=і(Хі-х)(Уі-у) 2Г=1(Хі-х)2 ° ^(х.-х)2
Among them, х = ^ііо^ , У =^1=іУ,. When b>0, it means that the meteorological elements have an upward trend, and when b<0, it means that there is a downward trend.
Correlation analysis method
In order to study the controlling factors of meteorological factors on the vegetation cover changes in Mongolia, the correlation coefficient between meteorological factors and vegetation was obtained by correlation analysis to express the influence of climate on vegetation cover changes. And the t-test was used to test the significance of the correlation coefficient, and the calculation of the correlation coefficient was:
гху
2Г=0[№-^)(Уі-У)1
^2|һі(^і-^+ЁІһі(уі-^
In the formula, the distribution of X and У is the average value of the sample values of the two elements. ^ху "^ ^ indicates a positive correlation, and ^ху < ^ indicates a negative correlation. The larger the correlation coefficient, the stronger the correlation between elements. The significance test of the two is realized by programming in Matlab, and the significance level mentioned in this study is 0.05.
Results
Change trend and climate response of vegetation NDVI in Mongolia
As shown in (Fig. 3a), it can be seen that in the past 34 years, the NDVI in the growing season in Mongolia has been fluctuating and rising slowly, with a linear upward trend of 0.004/10a. In 2012, it was 0.270, and the average over the years was 0.246. From 2000 to 2007, the vegetation NDVI showed a downward trend as a whole, and there were also years of continuous growth. The temperature in the growing season was rising at a rate of 0.37mm/10a, and the lowest temperature in the growing season reached 10.75°C in 1993, while the highest temperature reached 12.8°C in 2000 and 2007, and the change in temperature from 1998 to 2001 was small. In 2001–2003, the temperature plummeted. From the variation of precipitation in the growing season, it can be seen that the precipitation decreased at a rate of 5.21 mm/10a during the study period, while the trend of precipitation before 1998 was at the upper part of the average, and the precipitation after this year Below the mean, while precipitation changes have insignificant characteristics during the growing season. The continuous increase of precipitation in 1992–1994 was larger than that in other years, and the continuous decrease of precipitation in 2012–2014 was larger than that in other consecutive years. The precipitation reached a maximum value of 257 mm in 1994, while the precipitation decreased greatly in 1994–1995, with a minimum value of 136mm in 2004.
As shown in (Figure 3b), the fluctuation of vegetation NDVI in spring is frequent and significantly increased. The temperature reached a maximum of 5.58°C in 1997, and reached -0.057°C in 2010. The temperature dropped rapidly in this year, and the precipitation was 5.58°C. The velocity of 2.7 mm/10a was increasing and the fluctuation after 2001 was larger than that of the precipitation before that. The precipitation in 2003–2004 decreased greatly, with a difference of 15 mm.
As shown in (Figure 3c), the vegetation NDVI in summer also has an increasing trend, but the linear upward trend is 0.003 mm/10a. The annual vegetation NDVI has the characteristics of continuous rise. The summer temperature before 1998 fluctuated below 18.12°C and the fluctuation value of the temperature became larger in the years after it, and the temperature in 2002–2003 dropped straightly. The precipitation was decreasing at a rate of 6.11mm/10a and the fluctuation before 1999 was larger than that after that and the fluctuation values were very different.
As shown in (Figure 3d), the vegetation NDVI volatility in autumn was smaller than that in spring and was significant. The temperature fluctuated greatly, and the temperature dropped greatly between 1998 and 2000. The precipitation is decreasing at a rate of 1.54 mm/10a, and the variation of precipitation is large during most of the study period. From 1994 to 1996, the precipitation continued to decrease, while the increase in the magnitude and value of the precipitation from 1985 to 1987 was greater than that of the other three consecutive years of increase.
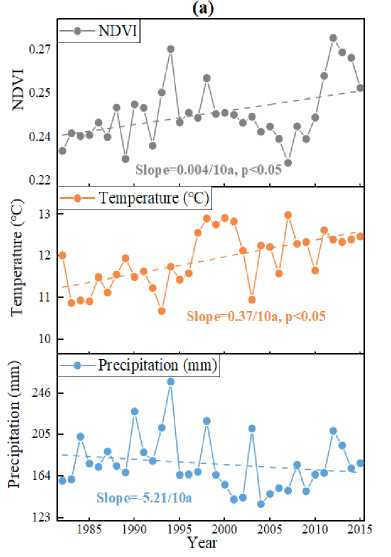
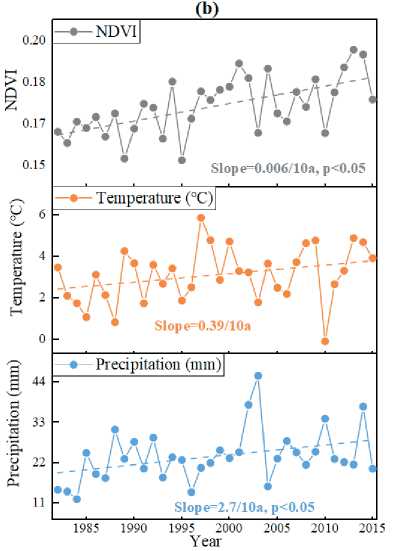
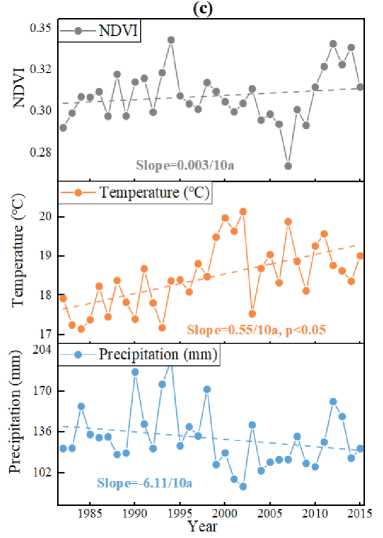
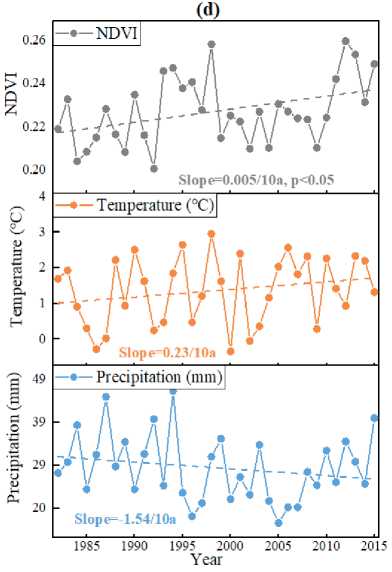
Figure 3. Variations of NDVI, temperature and precipitation during the growing season in Mongolia from 1982 to 2015 (a) in spring (b), summer (c) and autumn (d)
Spatial pattern and climate response of vegetation NDVI variation trends in Mongolia
Spatial pattern of NDVI variation trends
The vegetation NDVI values in this area have different distribution characteristics at different times in the study period, and the areas where the vegetation coverage increases during the growing season are more than the areas where the vegetation coverage decreases. Among them, the areas with a significant increase in vegetation coverage accounted for 29.35%, the areas with no significant increase in vegetation coverage accounted for 36.40%, and the areas with a significant decrease in vegetation coverage accounted for 8.8% (Figure 4a). During the study period, the areas with reduced vegetation coverage in the spring Mongolia area decreased, and the areas with reduced vegetation coverage were mainly in the southwest area and a small part of the central area and receded significantly (Figure 4b). The decline in vegetation coverage over time is moving north and the area is also expanding. The areas where vegetation coverage increases significantly are only in parts of the southwest of South Gobi Province and most of Oriental and Sukhbaatar Provinces. The vegetation in the area increased significantly (Figure 4c). During the study period, the vegetation coverage in autumn is compared with that in summer. It can be seen that the area where the vegetation coverage decreases while the location changes, and the area where the vegetation coverage decreases is moving to the southeast and southwest. Only 21.5% of the areas with a significant increase in vegetation accounted for 44% without a significant increase (Figure 4d).
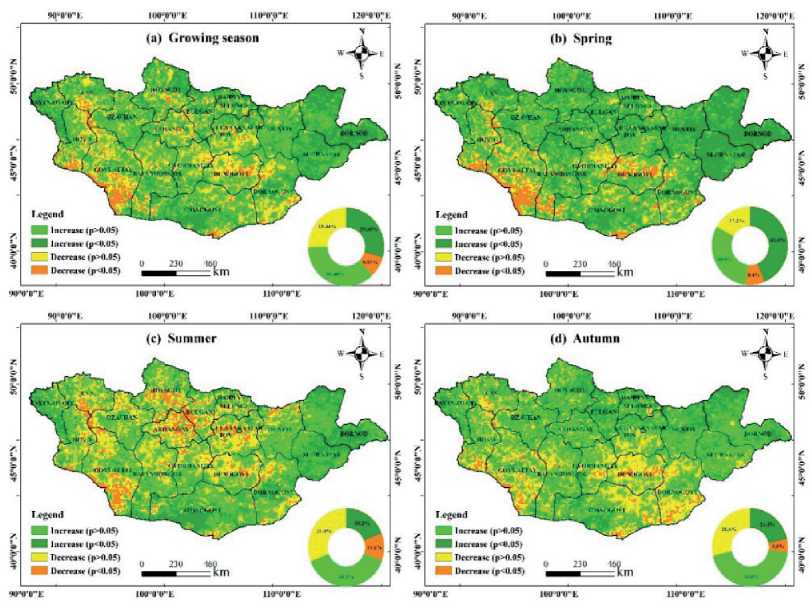
Figure 4. Spatial variation trend of vegetation NDVI
Spatial pattern of NDVI response to climate
As shown in Figure 5, vegetation NDVI is most significantly affected by climatic factors, and different regions have different degrees of response of vegetation NDVI to air temperature due to their unique natural conditions. The response of vegetation to temperature in the growing season is negatively correlated in most cases, and the proportion of pixels with negative correlation between NDVI and temperature in the growing season is as high as 60.9%, which is generally distributed in the central region; the negative response of vegetation NDVI to temperature is not significant. was 15.3%, mainly distributed in the central area of the study area (Figure 5a). Compared with the NDVI in the growing season, the proportion of pixels positively correlated with NDVI in spring is 75.8%, and the overall distribution is in the northern, southern and southeastern regions, and the proportion of pixels passing the significance test of 0.05 is 29%. The distribution study area is in the northern and northwestern regions (Figure 5b). It can be seen from the figure that the response of vegetation NDVI to temperature is more obvious in summer. The proportion of pixels negatively correlated with NDVI and temperature in summer is 75.1%, and the overall distribution is in the central area. The number of pixels passing the significance test of 0.05 accounts for 23.3%. %, mainly distributed in the central area of the study area (Figure 5c). The response of vegetation NDVI to temperature in spring and summer has the opposite characteristics of positive and negative relationship. In summer, the temperature is rising at a speed of 0.55˚C/10a, so the increase in temperature will affect the evaporation and decline one after another.
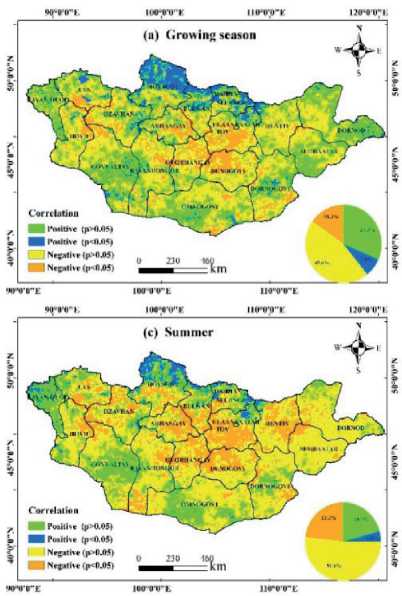
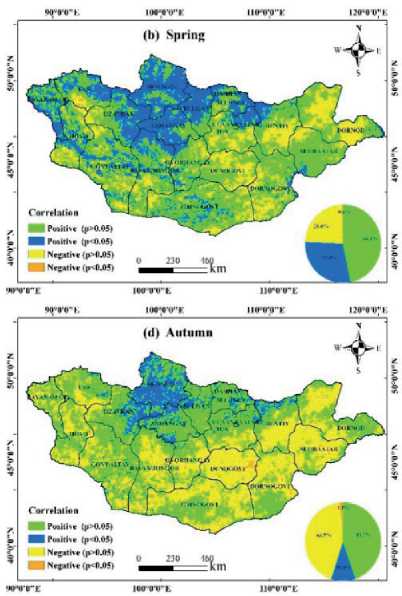
Figure 5. Correlation between vegetation NDVI and air temperature
The proportion of pixels positively correlated with NDVI and temperature in autumn is 55.1%, and the overall distribution is in the northern and southern parts of Kusugur Province, and the proportion of pixels passing the significance test of 0.05 is 10.4%, mainly distributed in Kusugu Southern Ireland and northwestern Kent (Figure 5d).
As shown in Figure 6, at the same time, the responses of vegetation NDVI to precipitation in different regions are different and have their own characteristics. It can be seen from the figure that the proportion of pixels positively correlated with vegetation NDVI and precipitation in the growing season is as high as 86.43%, which is distributed in most areas of Mongolia; the proportion of pixels passing the significance test of 0.05 is 56.76%, mainly distributed in The central, eastern and southern regions of the study area (Fig. 6a). In these different seasons, the area with the largest negative correlation between spring vegetation NDVI and precipitation is the largest, and the proportion of pixels negatively correlated with spring vegetation NDVI and precipitation is as high as 51.3%, and the overall distribution is in the south, southwest, and northwest regions; through the significant difference of 0.05. The number of pixels in the sex test accounted for 4.9%, which were mainly distributed in the northwestern part of Kusugur Province, Bayan Uriegai Province and the northeastern part of Central Province in the study area. The areas where vegetation NDVI was significantly positively correlated with precipitation were mainly distributed in the southern part of Kent Province, the western part of Sukhbaatar Province, and the northern part of the province (Fig. 6b).
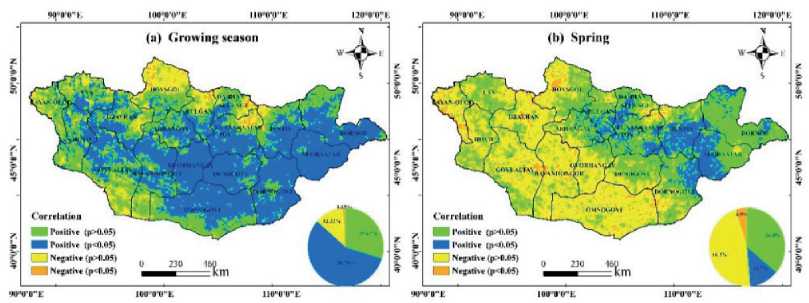
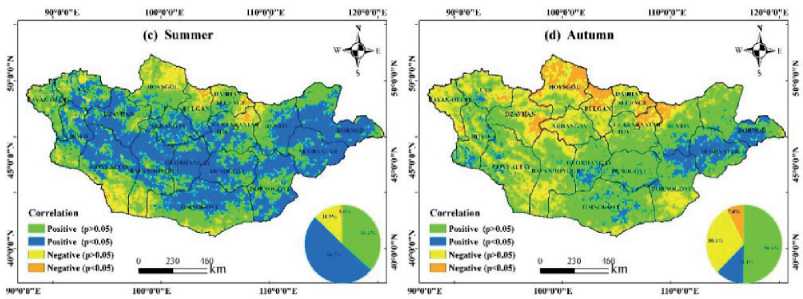
Figure 6. Correlation between vegetation NDVI and precipitation
It can be seen from the figure that the proportion of pixels that are positively correlated with NDVI and precipitation in autumn is as high as 62.5%, and the overall distribution is in the south, northeast and northwest regions; the proportion of pixels passing the significance test of 0.05 is 12.1%, mainly It is distributed in central Sukhbaatar Province, eastern South Gobi Province, and southwestern Khovd Province. The proportion of significant negative effects in the correlation between vegetation NDVI and precipitation in autumn was the largest among the four seasons, accounting for 7.4% (Fig. 6d).
Correlations between NDVI of different vegetation types and air temperature and precipitation
As shown in Figure 6, in Inner Mongolia, except for desert steppe, the other four vegetation types were positively correlated with air temperature throughout the growing season, among which coniferous forest was extremely significantly positively correlated. In the growing season and the other 3 seasons, coniferous forests are extremely significantly positively correlated (except in summer, which is not significant), and in autumn, all five vegetation types are positively correlated, among which coniferous forests are extremely significant positive correlations, and grasslands are typically significantly positive related. In summer, except for coniferous forest and alpine grassland, the other four vegetation types were negatively correlated, among which alpine grassland was positively correlated. The coniferous forest had the most significant relationship with air temperature in the growing season, spring and autumn, followed by the influence of alpine grassland on air temperature in spring, summer and autumn. Among the different vegetation types, the four seasons of meadow steppe and desert steppe had no significant characteristics in response to air temperature. Then, to analyze the correlation between different vegetation and precipitation in different seasons, desert steppe and meadow steppe have a very significant positive correlation with precipitation in the growing season and summer, while the NDVI of coniferous forest vegetation and the growth season have a negative correlation with precipitation (-0.29), the remaining vegetation types were positively correlated. The relationship between different vegetation types and summer precipitation was the most significant, followed by the effect of growing season precipitation on different vegetation types.
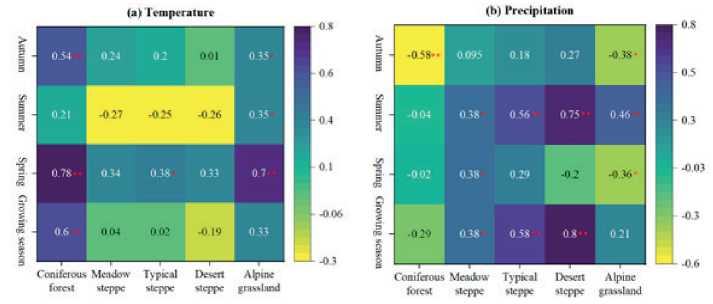
Figure 7. Partial correlation between NDVI and temperature and precipitation for different vegetation types
Conclusion
Using GIMMS NDVI data from 1982 to 2015, monthly temperature and precipitation data and vegetation type data in the same period, the variation characteristics of vegetation cover in Mongolia during the growing season, spring, summer and autumn were systematically analyzed, and analyzed from the perspective of temperature and precipitation. the reason for its change. The following conclusions are drawn through the research.
-
(1) From the perspective of temporal trends, in the past 34 years, Mongolia’s growing season NDVI has a slow upward trend in fluctuations. In precipitation and temperature changes, the precipitation in the growing season, autumn and summer has a downward trend, and the spring has an upward trend, and the temperature has an upward trend in all four seasons.
-
(2) From the perspective of spatial change, the proportion of vegetation NDVI growth in these four seasons is greater than the proportion of vegetation decline, and the proportion of significant increase in vegetation is also relatively high. In general, the growth of vegetation during the study period was optimistic.
-
(3) The influence of climatic factors on vegetation NDVI It can be seen that the influence of precipitation on vegetation NDVI is greater than that of temperature. The positive effect of spring temperature on vegetation NDVI was greater than the negative effect. On the contrary, the negative effect of summer temperature on vegetation NDVI was greater than the positive effect. The negative responses of temperature to vegetation NDVI in the growing season and autumn were mainly distributed in the central region, while the positive responses were larger in the northern regions. The positive effects of precipitation in the growing season and summer on vegetation NDVI were large and mainly distributed in the central and eastern regions, while the negative effects of precipitation in spring and winter on vegetation NDVI were largely distributed in the western regions.
-
(4) The response of different vegetation types to precipitation is greater than that of air temperature, and alpine grassland vegetation has a significant effect on air temperature and precipitation. The growing season and summer precipitation generally had a significant effect on the responses of different vegetation types while only the spring air temperature had a significant effect on different vegetation types. Air temperature has a significant effect on coniferous forest and alpine grassland vegetation in different seasons, while precipitation has a significant effect on other types of vegetation except for coniferous forest.
This paper analyzes the vegetation cover change and climate response in Mongolia, and draws some preliminary conclusions. However, because the factors affecting vegetation cover are complex and diverse, the influencing factors are diverse, and the relationship between them is complex, with extensive and dynamic characteristics. It is difficult to describe the trend and interaction of climate change and vegetation cover change in a comprehensive analysis. And there are certain limitations in the data, and there are still some problems worthy of further study.
References Spatiotemporal variations of vegetation change and its response to climate change in Mongolia during 1982-2015
- Walker B., Steffen W. (1997). A Synthesis of GCTE and Related Research. IGBP science, 1: 1-24.
- Piao S. L., Fang J. Y. (2003). Seasonal Changes in Vegetation Activity in Response to Climate Changes in China between 1982 and 1999. Acta Geographica Sinica, 58(1): 119-125.
- Wang X. H., Piao S. L., Ciais P. et al. (2011). Spring Temperature Change and its Implication in the Change of Vegetation Growth in North America from 1982 to 2006. Proceedings of the National Academy of Sciences, 108(4): 1240-1245.
- Zhou W., Gang C. C., Li J. L. et al. (2014). Spatial-temporal dynamics of grassland coverage and its response to climate change in China during 1982-2010. Acta Geographica Sinica, 69(1): 15-30.
- Mu S. J., Li J. L., Chen Y. Z., et al. (2012). Spatial differences of variations of vegetation coverage in Inner Mongolia during 2001-2010. Acta Geographica Sinica, 67(9): 1255-1268.
- Sun Y. L., Guo P., Yan X. D. et al. (2010) Dynamics of Vegetation Cover and Its Relationship with Climate Change and Human Activities in Inner Mongolia. Journal of Natural Resources, 25(3): 407-414.
- Piao S., Fang J., Zhou L. et al. (2003). Interannual Variations of Monthly and Seasonal Normalized Difference Vegetation Index (NDVI) in China from 1982 to 1999. Journal of Geophysical Research, 108(D14): 4401.
- Cui L., Shi J., Yang Y. et al. (2003). Ten-Day Response Characteristics of Vegetation NDVI to Temperature and Precipitation in Eastern China. Acta Geographica Sinica, 64(007): 850-860.
- Jia W. (2012). Seasonal Variation Characteristics of Extreme Temperatures in Qilian Mountains and Hexi Corridor in Recent 50 years. Geographical Sciences, 2 32(10): 1377-1390.
- Guo Y., Gong D., Wang W. et al. (2013). Statistical Relationship between Summer Cloud Cover and Daily Temperature in Eastern China. Geographical Sciences, 3 33(1): 104-109.
- Tucker C. J., Slayback D. A., Pinzon J. E. et al. (2001). Higher northern latitude normalized difference vegetation index and growing sea-son trends from 1982 to 1999. International Journal of Biometeorology, 45(4): 184-190.
- Zhou L. M., Tucker C. J., Kaufmann R. K. (2001). Variations in Northern Vegetation Activity Inferred from Satellite Data of Vegetation Index During 1981 to 1999. Journal of Geophysical Research, 106(D17): 20069-20083.
- Gan C., Wang X., Li B. et al. (2011). Analysis of Vegetation Coverage Changes in the Lianjiang River Basin in the past 18 years. Geographical Sciences, 31(8): 1019-1024.
- Chen H., Liu J., Wang W. (2008). Analysis of Variation Characteristics and Influencing Factors of Vegetation Index in Northern Hebei. Geographical Science, 28(6): 793-798.
- Chen F., Liu H. J., Liu S. J. et al. (2019). MODIS-based Desertification Dynamic Monitoring in Mongolia from 2003 to 2017. Journal of Northwest Forestry University. 34(5): 167-171.
- Wang J. L., Cheng K., Zhu J. X. et al. (2018). Development and Pattern Analysis of Mongolian Land Cover Data Products with 30 Meters Resolution. Journal of Geoinformation Science, 20(9): 1263-1273.
- Bao G., Tuya A., Bayarsaikhan S. et al. (2020). Variations and Climate Constraints of Terrestrial Net Primary Productivity over Mongolia. Quaternary International, 537: 112-125.
- Tao S., Fang J., Zhao X. et al. (2015). Rapid Loss of Lakes on the Mongolian Plateau. Proceedings of the National Academy of Sciences of the United States of America, 112(7): 2281-2286.
- Tong S., Lai Q., Zhang J. et al. (2018). Spatiotemporal Drought Variability on the Mongolian Plateau from 1980-2014 based on the SPE I-PM Intensity Analysis and Hurst Exponent. Science of the Total Environment, 615: 1557-1565.
- Li N., Bao Y. L.,Yin S. et al. (2016). Spatiotemporal Characteristics of Grassland Fire in China-Mongolia Border Regions. Journal of Catastrophology 31(3): 207-210.
- Huang X. J., Xie Y. W., Bao Y. H. et al. (2018). Suitable Distribution Areas of Jas's Larch Inchworm in Mongolia Plateau. Journal of North-WestA & F University (Natural Science Edition), 46(4): 98-106.
