Specialized LED assembly for out-atmospheric solar simulator

Author: A. A. Shevchuk, V. V. Dvirnyi, M. S. Maybakh, S. A. San'ko, A. A. Pavlova
Journal: Siberian Aerospace Journal @vestnik-sibsau-en
Section: Aviation and spacecraft engineering
Article in issue: 4 vol.23, 2022.
Free access
Traditional solar simulators for thermal vacuum tests of spacecraft are based on gas-discharge lamps. Due to the characteristics of such lamps, they can only be installed outside the thermal vacuum chamber. High-efficiency LEDs can be installed directly in the thermal vacuum chamber, which can significantly improve the luminous and operational characteristics of solar simulators. Obtaining a spectrum close to the spectrum of the extraterrestrial Sun (AM0) is one of the primary and most difficult tasks in ensuring that the luminous characteristics of the solar simulator meet the requirements. The article considers a pre-viously proposed model of a combined emitter consisting of halogen lamps and assemblies of high-performance LEDs of various wavelengths. We have proposed a method for determining the spectral match for AM0 solar simulators and determined the requirements for LED assemblies intended for use in the combined emitter. Simulation with a sample of the most suitable commercially available LED assembly, at the nominal power level of halogen lamps, showed a good spectral match, which deteriorates significantly with decreasing lamp power. At the same time, many programs and methods of thermal vacuum tests re-quire simulation of different irradiance levels. Taking this into account, the authors developed an experi-mental LED assembly. Simulation of the combined emitter with this LED assembly showed the best results. The required spectral match is maintained at various irradiance levels. The achieved characteristics of the developed LED assembly are not limiting and can be improved by further optimization.
Thermal vacuum tests, solar simulator, light emitting diode, LED assembly, halogen lamp, spectral match
Short address: https://sciup.org/148329665
IDR: 148329665 | UDC: 629.78; 621.32 | DOI: 10.31772/2712-8970-2022-23-4-734-746
Text of the scientific article Specialized LED assembly for out-atmospheric solar simulator
In the previous research [1; 2] it has been shown that the main obstacle to further improvement of the light and operational characteristics of solar simulators (SS) for thermal vacuum testing (TVT) of spacecraft (SC) is the placement of SS light sources outside the thermal vacuum chamber. In turn, this is due to the peculiarities of gas-discharge xenon lamps, which are used almost without alternative as light sources, and extremely rarely, gas-discharge metal halide lamps [3]. To obtain a working field in a thermal vacuum chamber, a complex optical system is used with a large number of reflective and refractive optical elements, which leads to high losses of the luminous flux. As a rule, even with careful manufacture of the elements of such SS, their efficiency is about 10% [4].
To domestic SS for TVT of SC, in particular, to those operating in JSC “Academician M. F. Resh-etnev “Information Satellite Systems” (JSC “ISS”), in terms of the main lighting characteristics, the following requirements are imposed:
– non-parallelism of the luminous flux up to 4°;
– energy illumination level (EI) 1340 - 1440 W/m2;
-
– uneven distribution of EI within the working field up to 15%;
-
– spectral range close to the range of solar radiation, in the region of 200–2000 nm [5].
The appearance in the last decade of new developments of high-efficiency LEDs makes it possible to create a simple and efficient SS on their basis [6; 7]. Unlike traditional ones, such an SS can be adapted to work under conditions of thermal vacuum tests, directly in a thermal vacuum chamber [1; 2]. As one of the most rational options, in [2] the design of the SS emitter in the form of a twodimensional array (matrix) with distributed parameters from a set of point light sources was proposed. Each source is equipped with a simple primary optical element. If the distance to the test object (TO) is many times greater than the distance between adjacent point sources of the matrix, their light fluxes, mixing many times, form a uniform working field on the TO (Fig. 1).
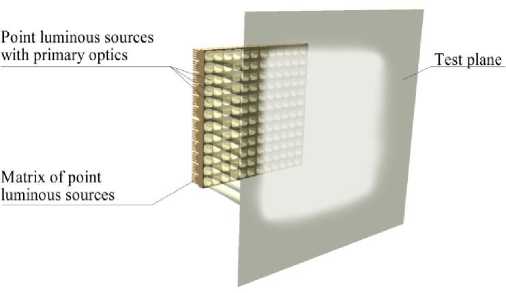
Рис. 1. Излучатель ИСИ в виде матрицы из точечных источников
Fig. 1. Emitter of solar simulator in the form of a matrix of point sources
To fully simulate the solar thermal effect on TO, it is necessary to simulate solar radiation in a wide range, including the infrared region. For that to happen, high-power LED assemblies from crystals of various wavelengths in the predominantly visible region and halogen lamps are placed in a matrix with uniform alternation predominantly in the infrared region of the solar spectrum. Such a solution is known [8; 9] and is justified, in particular, by the fact that LEDs in the visible part of the spectrum are currently the most developed, efficient, and commercially available. The low efficiency, narrow emission band, and high cost of infrared LEDs make their use unjustified. At the same time, halogen lamps are practically ideal and inexpensive sources of infrared radiation.
The light characteristics of two selected samples of a foreign manufacturer OSRAM - a high-power LED assembly and a halogen lamp, were measured in the research [2; 10]. Based on these measurements, the simulation of the combined matrix SS emitter was performed in Zemax specialized software for optical design. The results showed that the light characteristics of the model in terms of the non-parallelism of the light flux, the level and uneven distribution of the EI correspond to the requirements for SS for TVT of SC or exceed them. But no less important are the spectral characteristics of SS. Thus, when various spectrally selective reflective and absorbing coatings are used on the TO, the low spectral correspondence of SS will inevitably increase the total error in simulating the thermal effect on the TO of real solar radiation.
The non-parallelism of the light flux and the uneven distribution of the EI are determined by the geometric parameters of the matrix and the properties of the primary optical elements. In turn, the spectral range and spectral correspondence of the SS are determined by the corresponding characteristics of the light sources used - halogen lamps and LED assemblies.
The maximum emission of halogen lamps is concentrated in the infrared region. The spectrum of halogen lamps is very uniform and, like the spectrum of the Sun, is close to the spectrum of black body radiation (BB), but with a lower color temperature. On the contrary, the resulting spectrum of the LED assembly in the visible region is more complex and differs significantly from the black body spectrum, since it consists of the radiation of several crystals of different wavelengths.
The uniformity of the assembly spectrum is directly dependent on the number of wavelengths of the crystals used. On the other hand, SS for TVT of SC should provide a high directivity of the light flux. This limits the number of crystals in the assembly, since it must have a small, approaching a point, size of the radiating surface, which makes it possiple to install a single primary optical element with a small distribution angle on the assembly [2; 10].
Thus, an obligatory requirement for LED assemblies for combined SS, along with the correspondence of light characteristics, should be considered the optimal combination of the number of crystals that make up the assembly, their wavelengths, and the smallest possible size of the radiating surface.
Spectral correspondence of SS and the method of its determination
It should be noted that today the light characteristics of the SS for TVT of SC are not regulated by state standards. Also, the spectral characteristics of the gas-discharge, in the vast majority of cases, xenon lamps used in such SS, are not regulated, since it is believed that their spectrum is quite close to the extra-atmospheric spectrum of the Sun. However, when alternative light sources with other characteristics are used, it inevitably becomes necessary to confirm the spectral compliance of SS.
The closest is the current all-Union State Standard 60904, which is identical to the international standard IEC 60904, which classifies the characteristics of SS ground conditions of AM 1.5 (Air Mass 1.5) for testing photovoltaic devices, mainly solar photovoltaic converters (PVC), and defines measurement methods light characteristics of such SS [11].
Thus, the spectral correspondence of SS of AM 1.5 conditions is estimated in the wavelength range of 400–1100 nm using the following method:
– the SS spectrum in the general range of 400–1100 nm is divided into six separate subranges: 400–500, 500–600, 600–700, 700–800, 800–900, and 900–1100 nm. The values of the spectral density of energy illumination (SDEI) of SS are measured both in the general range and in each subrange. Measurement methods can be based on the use of a spectroradiometer consisting of a diffraction monochromator and a radiation receiver; a spectrometer based on a CCD array or a photodiode array; a set of receivers with bandpass filters; single receiver with a set of bandpass filters. The obtained SDEI data are integrated and thus the EI value in the entire range of 400-1100 nm and the EI values for each of the six separate subranges are obtained:
Xmax
E = j I (X) d X , '-min
where E is EI of the entire range or a separate subrange, W/m2; λ min and λ max are the initial and final wavelengths of the general range or subrange, nm; I(λ) is SDEI or intensity of solar radiation per unit wavelength, W/m2∙nm;
– determine the percentage contribution of the EI of each subrange to the EI of the entire range 400–1100 nm:
KE = -N^- 100 E , E общ
where K E is the contribution of the EI of a separate subrange to the EI of the entire range, %; E N is EI of a separate sub-range, calculated by formula (1), W/m2; E общ is the EI of the entire range, calculated by formula (1), W/m2;
– for each individual subrange of the SS, the value of the spectral correspondence is found:
K E ( ИСИ )
K c = ,
K E ( AM 1,5)
where K С is the spectral correspondence of a separate subrange; K E (ИСИ) is the contribution of the EI of this subrange to the total EI in the SS spectrum in the range of 400–1100 nm; K E (AM1,5) is the known contribution of the EI of the same subband to the total EI in the spectrum of the Sun AM 1.5 indicated in [11];
– determine the class of the spectral match of the SS by the worst value of the spectral match K С of all six individual subbands. For the highest class A, the value of the spectral correspondence should be in the range of 0.75–1.25, for class B, in the range of 0.6–1.4; for class C it should be within 0.4–2.0.
In our opinion, this technique is correct and can be taken as a basis for determining the spectral correspondence of SS for TVT of SC with minor changes:
-
– PVCs are extremely sensitive to the spectrum of received radiation. To assess the thermal effect of SS on the TO, the spectral correspondence classes A and B are redundant, and the initial class C can be taken as the correspondence criterion;
-
– a narrow spectral range of 400–1100 nm corresponds to the limits of the spectral sensitivity of the solar cell. The thermal effect of the Sun occurs in a wider range of wavelengths, including the infrared region. Therefore, compliance should be determined in a wider range - at least up to 2000 nm;
-
– when calculating the spectral correspondence according to formula (3), one should take into account the difference between the spectral distribution of solar radiation in Zero Air Mass (ZAM) and the spectral distribution of ground conditions AM1.5, for which the corresponding values of K E (AM0) should be used.
The authors proposed the following method for determining the spectral correspondence of SS for TVT of SC (hereinafter referred to as the method):
-
– the spectral compliance of the SS is determined in the wavelength range 400-2000 nm, which is divided into eight separate subranges. The EI contributions of each subband to the total EI of the entire 400–2000 nm range K E (AM0) were calculated in accordance with the description of the extraatmospheric solar spectrum ZAM in the international standard ASTM E490-2022 [12]. The boundaries of the subranges and the corresponding values of K E (AM0) are given in Table. 1;
-
– the condition for confirming the spectral compliance of the SS is to consider the values of K E (AM0) of all eight subranges determined by formulas (1)–(3) that do not go beyond 0.4–2.0.
EI distribution of the solar spectrum ZAM in the range 400–2000 nm
Table 1
|
Spectrum distribution |
Subrange, nm |
Whole range, 400– 2000 nm |
|||||||
|
400500 |
500600 |
600700 |
700800 |
800900 |
900 1100 |
11001400 |
1400 2000 |
||
|
K E( AM0) , % |
15.8 |
15.7 |
13.5 |
10.8 |
8.7 |
12.7 |
11.8 |
11.0 |
100 |
Using the method, the spectral correspondence of gas-discharge xenon lamps of the XBO series manufactured by OSRAM [13], used, in particular, in SS for TVT of SC, operating at ISS JSC, will be determined. Spectral distributions of the extra-atmospheric solar radiation conditions ZAM in accordance with [12] and gas-discharge xenon lamps OSRAM XBO with equal EI are shown in Fig. 2. Calculated in accordance with the methodology, the correspondence values of all eight subranges K с are within 0.6–1.7; the condition of the spectral correspondence of the SS is satisfied (Table 2).
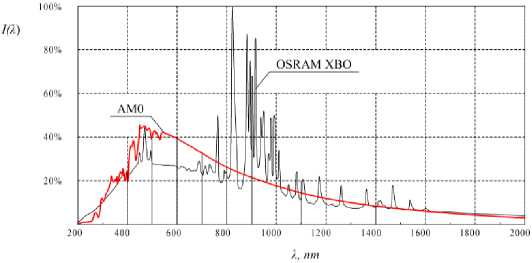
Рис. 2. Спектральные распределения солнечного излучения условий AM0 и газоразрядных ксеноновых ламп OSRAM XBO
Fig. 2. AM0 and gas-discharge xenon lamps OSRAM XBO spectral distributions
Spectral match ZAM of OSRAM XBO xenon discharge lamps
Table 2
|
Spectrum distribution and compliance of ZAM |
Subrange, nm |
Whole range, 400–2000 nm |
|||||||
|
400500 |
500600 |
600700 |
700800 |
800900 |
900 1100 |
11001400 |
14002000 |
||
|
K E (ИСИ) , % |
10.8 |
10.1 |
9.5 |
9.4 |
15.2 |
20.3 |
11.2 |
13.5 |
100 |
|
K С |
0.7 |
0.6 |
0.7 |
0.9 |
1.7 |
1.6 |
0.9 |
1.2 |
0.6 – 1.7 |
Modeling (commercially produced samples)
At the first stage of the experimental part, the modeling of the combined SS emitter, carried out earlier in [2], was taken as the basis. H1 high-beam automotive halogen lamps with an axial filament from OSRAM were selected for modeling. With a nominal power consumption of 55 W, the color temperature of T Ц lamps is 3500 K. After analyzing the latest developments of foreign manufacturers, high-performance LED Engin LZ7 LED assemblies from OSRAM [14] were selected from seven crystals of six wavelengths. Brief characteristics of the crystals that make up the assembly are given in Table 3.
The spectral distributions of the selected light sources were determined under normal conditions by a spectrum measurement system, which includes two MDR-206 monochromators and a PC with specialized software. The monochromators are calibrated against reference light sources based on an incandescent lamp and a deuterium lamp. The modeling of the resulting spectrum of the combined emitter was carried out in the mathematical engineering software Mathcad, while the light powers of crystals of different wavelengths were selected separately in relation to the light power of halogen lamps. Such a method for adjusting the spectrum of an LED SS is known and implemented, in particular, in [15].
The resulting spectrum of the combined SS model and the spectrum of solar radiation under conditions ZAM with equal EI are shown in Figure 3. By separate adjustment, a spectral correspondence was obtained in the range of 0.6–1.4 (Table 4, line 1).
The composition of the LED Engin LZ7 assembly
Table 3
|
Crystal |
Wavelength, nm |
Quantity in assembly |
Forward voltage, V |
Maximum forward current, A |
|
Blue |
449 |
1 |
3.2 |
3 |
|
T urquoise |
495 |
1 |
3.8 |
1 |
|
Green |
519 |
1 |
3.5 |
2.5 |
|
Light green |
522 |
2 |
3.2 |
1.5 |
|
Amber |
600 |
1 |
3.6 |
2.5 |
|
Red |
622 |
1 |
2.4 |
2.5 |
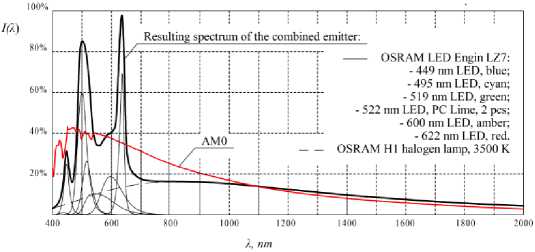
Рис. 3. Спектральные распределения солнечного излучения условий AM0 и комбинированного излучателя со светодиодной сборкой LED Engin LZ7 и галогенной лампой 3500 К
Fig. 3. Spectral distributions of AM0 and combined emitter with LED Engin LZ7 assembly and halogen lamp, 3500 K
It should be noted that the color temperature of halogen lamps of 3500 K is only achieved at their rated power. However, the simulation of the solar constant with an EI level of 1366 W/m2 is a special case of TVT of SC. Many programs and test methods provide for a decrease in the EI level, for example, to simulate the shading of the TO or its rotation relative to the Sun [16]. This requires a decrease in the level of EI of SS, and hence the power of light sources.
The spectrum of LEDs is practically independent of their power level, which cannot be said about halogen lamps. Along with a decrease in the power of a halogen lamp, its color temperature decreases with a shift in the maximum radiation towards longer wavelengths. This can lead to mismatch between halogen lamps and LED assemblies and degrade the spectral match of the SS.
It is also known that the resource of halogen lamps is inversely related to the operating temperature of the filament. For this reason, in SS it is highly desirable to use halogen lamps with a lower color temperature than in the model.
In the course of further simulation, the color temperature T Ц of the halogen lamp was reduced to 3000 and 2500 K (Table 4, lines 2 and 3). The results showed deterioration in the spectral fit of the model. With a decrease in T Ц to 3000 K, the spectral correspondence deteriorated to the limits of permissible limits, and when it was reduced to 2500 K, it went beyond the permissible limits of 0.4–2.0. This is due to the dip of the resulting spectrum in the region of 700–900 nm, where the LED assembly and halogen lamps are matched. Therefore, for better matching with halogen lamps, the spectrum of the LED assembly must be extended towards the far red – near infrared region.
Table 4
Spectral match of the model with LED assembly Engin LZ7 and halogen lamps 3500, 3000 and 2500 K
|
T Ц , K |
Spectrum distribution and compliance of ZAM |
Subrange, nm |
Whole range, 400–2000 nm |
|||||||
|
400500 |
500600 |
600700 |
700800 |
800900 |
900 1100 |
11001400 |
1400 2000 |
|||
|
3500 |
K E (ИСИ) , % |
10.0 |
19.2 |
16.9 |
6.2 |
6.6 |
11.8 |
13.7 |
15.6 |
100 |
|
K С |
0.6 |
1.2 |
1.3 |
0.6 |
0.8 |
0.9 |
1.2 |
1.4 |
0.6–1.4 |
|
|
3000 |
K E (ИСИ) , % |
10.6 |
21.4 |
16.4 |
4.4 |
5.5 |
11.1 |
14.2 |
16.4 |
100 |
|
K С |
0.7 |
1.4 |
1.2 |
0.4 |
0.6 |
0.9 |
1.2 |
1.5 |
0.4–1.5 |
|
|
2500 |
K E (ИСИ) , % |
9.1 |
19.2 |
13.7 |
1.8 |
3.3 |
10.9 |
17.9 |
24.1 |
100 |
|
K С |
0.6 |
1.2 |
1.0 |
0.2 |
0.4 |
0.9 |
1.5 |
2.2 |
0.2–2.2 |
|
Finally, the acquisition of high-power LED assemblies of foreign production is extremely difficult today. Therefore, another basic requirement, in accordance with the state policy of import substitution, is the use of domestic developments of the electronic component base.
Experimental sample of the LED assembly
Taking into account all the requirements listed above, the authors developed and manufactured an experimental sample of the LED assembly.
The appearance of the experimental assembly with a heat-removing base is shown in Figure 4. Assembly layout is shown in Figure 5. The dimensions of the radiating surface are 4 x 4 mm. The assembly consists of seven crystals of six wavelengths: five in the visible region and one in the infrared; the crystals are fed separately. Brief characteristics of the crystals that make up the assembly are given in Table 5.
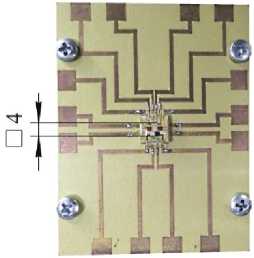
Рис. 4. Светодиодная сборка с теплоотводящим основанием
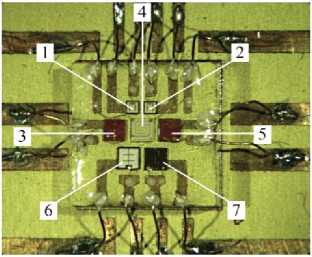
Рис. 5. Компоновка светодиодной сборки (увеличено)
-
Fig. 4. LED assembly with the heat sink base
-
Fig. 5. Layout of the LED assembly (increased)
Table 5
The composition of the experimental LED assembly
|
Crystal number in Figure 5 |
Wavelength, nm |
Voltage, V (for forward current, mA) |
Crystal size, mm |
Design |
|
1, 2 (blue) |
506 |
3.45 (150) |
0.610 x 0.610 |
Vertical |
|
3 (amber) |
592 |
2.08 (250) |
1.070 x 1.070 |
Vertical |
|
4 (green) |
521.3 |
3.21 (350) |
1.143 x 1.143 |
Planar |
|
5 (red) |
622.8 |
2.24 (350) |
1.070 x 1.070 |
Vertical |
|
6 (blue) |
455 |
3.1 (350) |
1.143 x 1.143 |
Planar |
|
7 (infrared) |
855 |
1.6 (350) |
1.066 x 1.066 |
Vertical |
The light characteristics of the experimental assembly were determined using the IS-2 measuring complex manufactured by Instrument Systems GmbH (number in the State Register of Measuring Instruments of the Russian Federation 73266-18). The limits of permissible relative error in measuring the spectral density of the radiation flux in the wavelength range of 380–830 nm do not exceed ±5%. The complex includes a CAS 120-151 spectrometer, an ISP500-100 photometric sphere, and a PC with specialized SpecWin Pro software.
The spectral distribution of the experimental LED assembly with an equal current of all crystals (series connection) is shown in Figure 6.
When the forward current changes in a wide range, from 20 to 200 mA, the resulting assembly spectrum remains practically unchanged (Fig. 7).
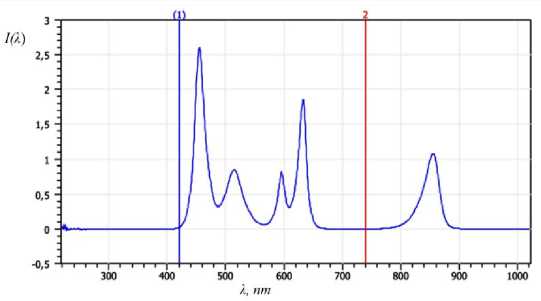
Рис. 6. Спектральное распределение экспериментальной светодиодной сборки
Fig. 6. Spectral distribution of the experimental LED assembly
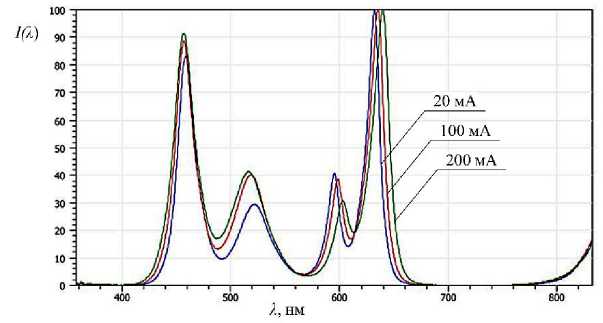
Рис. 7. Спектральное распределение экспериментальной светодиодной сборки при различных значениях прямого тока
Fig. 7. Spectral distribution of the experimental LED assembly at different values of the direct current
Simulation (experimental sample)
At the second stage of the experimental part, a similar simulation of the resulting spectrum of the combined emitter with an experimental LED assembly was performed in the Mathcad software. For the case with the color temperature of halogen lamps T Ц = 3500 K, as in the first stage of modeling, by separately adjusting the light power of crystals of different wavelengths in relation to the light power of halogen lamps, a spectral correspondence was obtained within 0.6–1.4 (Table 6 , line 1). The resulting spectrum of the combined SS model and the solar radiation spectrum of ZAM conditions with equal EIs are shown in Figure 8.
Further, in the same way, with separate power control, the resulting spectrum for halogen lamps with T Ц = 3000 and 2500 K was simulated (Table 6, lines 2 and 3). The values of the spectral correspondence of the subbands and the total spectral correspondence of the SS calculated in accordance with the methodology are summarized in Table 6. In all considered cases, K с are within 0.4–2.0; the condition of the spectral correspondence of the SS is satisfied.
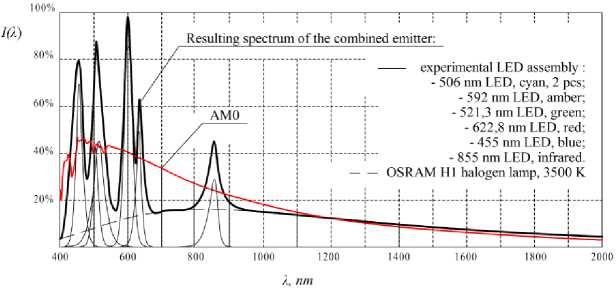
Рис. 8. Спектральные распределения солнечного излучения AM0 и комбинированного излучателя с экспериментальной светодиодной сборкой и галогенной лампой 3500 К
Fig. 8. Spectral distributions of AM0 and combined emitter with experimental LED assembly and halogen lamp, 3500 K
Table 6
Spectral match of the model with the experimental LED assembly and halogen lamps 3500, 3000 and 2500 K
|
T Ц , K |
Spectrum distribution and compliance of ZAM |
Subrange, nm |
Whole range, 400–2000 nm |
|||||||
|
400500 |
500600 |
600700 |
700800 |
800900 |
900 1100 |
11001400 |
14002000 |
|||
|
3500 |
K E (ИСИ) , % |
10.0 |
19.2 |
16.9 |
6.2 |
6.6 |
11.8 |
13.7 |
15.6 |
100 |
|
K С |
0.6 |
1.2 |
1.2 |
0.6 |
0.8 |
0.9 |
1.2 |
1.4 |
0.6–1.4 |
|
|
3000 |
K E (ИСИ) , % |
17.1 |
20.7 |
6.7 |
10.8 |
11.7 |
8.8 |
11.2 |
13.0 |
100 |
|
K С |
1.1 |
1.3 |
0.5 |
1.0 |
1.3 |
0.7 |
1.0 |
1.2 |
0.5–1.3 |
|
|
2500 |
K E (ИСИ) , % |
19.7 |
19.6 |
6.6 |
10.8 |
11.7 |
6.5 |
10.7 |
14.4 |
100 |
|
K С |
1.2 |
1.2 |
0.5 |
1.0 |
1.3 |
0.5 |
0.9 |
1.3 |
0.5–1.3 |
|
Results and discussion
The results of the simulation of the combined SS emitter showed that commercially produced high power LED assemblies do not match the spectral characteristics with halogen lamps accurately enough; the mismatch increases as the power of the light sources decreases. This is due to the purpose of such LED assemblies to work in other conditions - exclusively in the visible range.
The best results were obtained with an experimental LED assembly specially designed for use in a combined SS emitter. The spectral correspondence is maintained at different EI levels, for which five crystals of different wavelengths in the visible range and one crystal in the infrared range are sufficient in the assembly.
Despite the fulfillment of the spectral matching criterion, the emission spectrum of the LED assembly in the visible region is very uneven. Uniformity can be increased by adding crystals of other wavelengths, which will complicate the control system and increase the overall cost of SS. A more rational way to equalize the overall spectrum can be the use of phosphor, including white, crystals with a wider radiation band. In addition, analysis of the simulation results shows that the contribution of crystals with a wavelength of 506 nm in the resulting spectrum of the combined emitter is negligible. It seems to be more expedient to replace them with another crystal with a radiation maximum in the far red - near infrared region.
Spectral agreement in the course of experiments was achieved by separately adjusting the power of crystals of different wavelengths. It is possible to significantly simplify or eliminate a complex control system at the stage of designing an LED assembly by optimizing the light power, the number and size of crystals of different wavelengths, so that when they are connected in series and equal direct current, without separate regulation, the resulting spectrum of the assembly is as close as possible to the spectrum of solar radiation of ZAM.
Conclusion
The creation of a solar radiation simulator adapted to the conditions of thermal vacuum testing of spacecraft using alternative light sources of high-performance LEDs requires the solution of a number of extraordinary tasks. First of all, it is necessary to ensure the required accuracy of simulating the thermal effect of solar radiation on the test object. The necessary correspondence to the extra-atmospheric spectrum of the Sun can be obtained by combining the radiation of halogen lamps and high-performance LEDs of various wavelengths. In this case, it is necessary to take into account the peculiarities of the spectral characteristics of LED sources.
To confirm the spectral correspondence, the authors proposed an assessment technique based on the existing technique for simulators of solar radiation of terrestrial conditions, given in all-Union state Standard 60904–9.
Based on the measurements, modeling and evaluation of the results using the proposed methodology, the following conclusions can be drawn:
-
– a combined emitter from assemblies of high-performance LEDs of various wavelengths and halogen lamps is able to provide a spectral match close to the spectral match of traditional light sources -gas-discharge xenon lamps;
-
– the best results were obtained with an experimental LED assembly of crystals of six wavelengths and a size of the radiating surface of 4 × 4 mm, developed specifically for use in a combined emitter;
-
– the obtained characteristics of the experimental LED assembly are not limiting and can be significantly improved by further optimization;
-
– serial production of the developed LED assemblies can be completely made by a domestic manufacturer.
References Specialized LED assembly for out-atmospheric solar simulator
- Dvirnyi G. V., Shevchuk A. A., Dvirnyi V. V., Elfimova M. V., Krushenko G. G. [Analysis of LED-based solar simulator development capability for spacecraft ground testing applications]. Sibir-skiy zhurnal nauki i tekhnologiy. 2018, vol. 19, no. 2, p. 271–280 (In Russ).
- Shevchuk A. A. [Alternative method of solar simulation for thermal vacuum tests of spacecraft]. Siberian Aerospace Journal. 2021, Vol. 22, No. 4, P. 672-686 (In Russ).
- Tawfikab M., Tonnelliera X., Sansoma C. Light source selection for a solar simulator for thermal applications: A review. Renewable and Sustainable Energy Reviews. 2018, Vol. 90, P. 802–813.
- Krat S. A. [Increase of solar radiation simulator efficiency]. Sibirskiy zhurnal nauki i tekhnologiy. 2011, No. 2 (35), P. 124–127 (In Russ.).
- Kravchenko S. V., Nesterov S. B., Roman’ko V. A., Testoedov N. A., Khalimanovich V. I., Khristich V. V. [Approaches to creating integrated systems for optimization and testing of spacecraft]. Inzhenerniy zhurnal: nauka i innovatsii. 2013, No 1 (13), P. 149–175 (In Russ.).
- Reynolds K. LED-based sun-simulator design: technical and commercial considerations. Photonics Spectra. March 2015, P. 54–58.
- Plita F. Optical design of a fully LED-based solar simulator. PhD thesis. Loughborough, Loughborough University, July 2015. 186 p.
- Grandi G., Ienina A. Analysis and realization of a low-cost hybrid LED-halogen solar simulator. Proceedings of 2013 International Conference on Renewable Energy Research and Applications, ICRERA 2013. P. 794–799. 10.1109/ICRERA.2013.6749861.
- Karpenko A. V., Bazilevskii A. B. [Solar simulator based on combined continuous luminous sources]. Aktual'nye problemy aviatsii i kosmonavtiki. 2012, No. 8, P. 40 (In Russ).
- Dvirnyi G. V., Shevchuk A. A., Pastushenko O. V. [Ways to improve the technical and opera-tional characteristics of solar simulators for ground testing of spacecraft]. Reshetnevskie chteniya: materialy XXIV Mezhdunarodnoy nauchno-prakticheskoy konferentsii [Proc. 14th Int. scient. and pract. conf. “Reshetnev readings”]. Krasnoyarsk, 2020, vol. 1, p. 268–270 (In Russ).
- GOST R MEK 60904–9–2016. Pribory fotoelektricheskie. Chast’ 9. Trebovaniya k harakteristikam imitatorov solnechnogo izlucheniya. [State Standard R IEC 60904–9–2016. Photovol-taic devices. Part 9. Solar simulator performance requirements]. Moscow, Standartinform Publ., 2017. 12 p.
- ASTM International. ASTM E490-22. Standard Solar Constant and Zero Air Mass Solar Spec-tral Irradiance Tables. Available at: https://www.astm.org/e0490-22.html (accessed 19.10.2022).
- XBO® – lampy dlya kinoteatrov. Tekhnologiya i primenenie [XBO® cinema lamps. technolo-gy and application]. Available at: https://smart-story.ru/files/products/multimedia/Projectors/ Lamps/Osram/Docs/osram-xbo-lamp-technology-and-using.pdf (accessed 19.10.2022).
- OSRAM LED Engin LuxiGenTM LED Emitters. OSRAM, 2021. URL: https://www. osram.us/ledengin/products/luxigen/lz7.jsp (accessed: 19.10.2022).
- Bazzi A. M., Klein Z., Sweeney M. et al. Solid-State Solar Simulator. IEEE Transactions on Industry Applications. 2012, No. 48, P. 1195–1202.
- GOST R 56469–2015. Apparaty kosmicheskiye avtomaticheskiye. Termobalansnyye i termo-vakuumnye ispytaniya. [State Standard R 56469-2015. Automatic spacecrafts. Thermal balance and thermal vacuum tests]. Moscow, Standartinform Publ., 2015. 11 p.
