Specific features of harmonic conditions at the node connecting a pulp-and-paper mill to a supply network

Author: Kovernikova Lidiia I., Luong Van Chung, Ngo Van Cuong
Journal: Журнал Сибирского федерального университета. Серия: Техника и технологии @technologies-sfu
Article in issue: 1 т.13, 2020.
Free access
The paper presents the results of the analysis on measured parameters of harmonics at the node of the high-voltage network. The measurements were made at the node connecting the pulp-and-paper mill to the 220 kV supply network. This load is nonlinear and has a large capacity. Particular attention is paid to the distributions of the current and voltage harmonics. The paper clearly shows probabilistic properties of the measured parameters of harmonics.
Power quality, harmonics, high-voltage network, measurement, statistical analysis
Short address: https://sciup.org/146281417
IDR: 146281417 | UDC: 621.311 | DOI: 10.17516/1999-494X-0204
Особенности параметров режимов гармоник в узле присоединения целлюлозно-бумажного комбината к питающей сети
В статье представлены результаты анализа измеренных параметров гармоник в узле сети высокого напряжения. Измерения сделаны в узле присоединения к питающей сети 220 кВ мощной нелинейной нагрузки - целлюлозно-бумажного комбината. Особое внимание уделено законам распределения величин гармоник тока и напряжения. Статья наглядно показывает вероятностные свойства параметров гармоник.
Text of the scientific article Specific features of harmonic conditions at the node connecting a pulp-and-paper mill to a supply network
Цитирование: Коверникова, Л.И. Особенности параметров режимов гармоник в узле присоединения целлюлознобумажного комбината к питающей сети / Л.И. Коверникова, В.Ч. Лыонг, В.К. Нго // Журн. Сиб. федер. ун-та. Техника и технологии, 2020. 13(1). С. 38-51. DOI: 10.17516/1999-494X-0204
are presented in [8]; the results of measured parameters of the harmonics generated by energy saving lamps are presented in [9]; the harmonics measured in the medical center and their impact on the work of the medical equipment are indicated in [10]; the results of large-scale measurements of power quality indices in the 110 kV networks of Siberia, which cover 23% of Russia’s territory, are demonstrated in [11]; the results of the studies on parameters of harmonics for the complex loads connected to the nodes of the 110-220 kV networks are presented in [12]; the results of an analysis of harmonic active power of high-power nonlinear loads connected to the 110-220 kV networks are given in [13]. The measurements confirmed the presence of harmonics in the electrical networks. In many cases the voltage harmonic levels exceed the limits established in State standard 32144-2013 “Power quality limits in public power supply systems”. In [14] the authors indicate that 5.4% of the cost of losses due to the poor quality of electrical energy falls on the losses caused by current and voltage harmonics.
Although the parameters of harmonic conditions in electrical networks have been studied for many years, the interest to this problem does not decrease due to the growing number of nonlinear loads in the networks of different voltages and specific features of their operating conditions. The main feature is the probabilistic nature of operating parameters.
This paper presents the results of an analysis of the current, voltage and active power harmonics at the node connecting the 220 kV supply network to the large capacity nonlinear load, i.e. the pulp-and-paper mill. The operating parameters were measured in phases A, B, C of the network over 24 hours with a time interval of 1 minute. After processing the measured information, we obtained series of voltages, currents and their phase angles for harmonics 1-40 each having 1440 elements.
The current harmonics generated by the pulp-and-paper mill flow to the supply network and cause voltage distortion at its nodes. The mill is located in the region where the large number of other large capacity enterprises generating harmonics, i.e. traction substations, aluminum smelters, etc., are connected to the 220 kV network. Their current harmonics are also distributed throughout the 220 kV network and contribute to the formation of the parameters of the harmonic conditions. Consequently, the voltages at the nodes of the electrical network result from the influence of many nonlinear loads. At each node the non-sinusoidal voltage is unique since it is determined by the current harmonics flowing to the node from all nonlinear loads in the network and by the impedance of the network node.
Characteristics of the pulp-and-paper mill
The mill receives electricity from the 220 kV network. The mill uses direct-current electric motors with an automatic speed control system that drive the main process equipment. The power of the motors reaches 300 kW. Thyristor converters that have nonlinear volt-ampere characteristics are used to supply the motors with direct current.
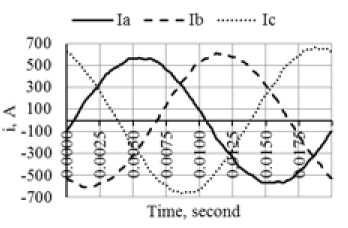
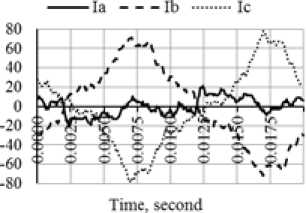
Fig. 1 shows the graphs of the fundamental frequency currents of the load for three phases. The mill has a shift schedule. In the daytime the load conditions are the maximum and at night the loads are the minimum as can be clearly seen from the graphs.
Fig. 2 presents the graphs of variation in the phase voltages at the node connecting the mill to the supply network. The voltage values lie within acceptable limits.
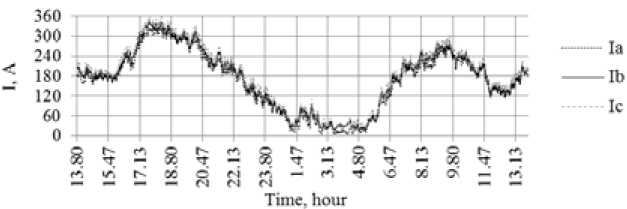
Fig. 1. Phase currents at the mill connection node
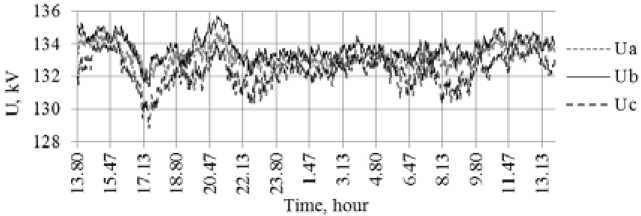
Fig. 2. Phase voltages at the mill connection node
An analysis of voltage at the node connecting the pulp-and-paper mill to the supply network
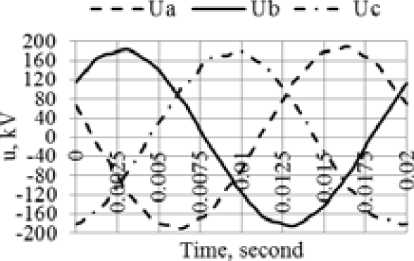
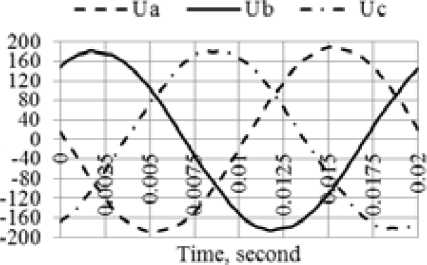
Fig. 3 shows the oscillograms of three-phase voltages for the maximum and minimum load conditions. The voltage waveforms in both conditions slightly differ from sinusoidal, which is confirmed by the values of the total harmonic distortion KU . In the maximum load conditions in phases A, B and C they are equal to 1.76%, 1.31% and 2.13% respectively for 95% of the measurement time; in the minimum load conditions – to 1.23%, 1.10% and 1.25%. The limit of 2% established in State standard 32144-2013 is exceeded in phase C in the maximum load conditions. There is also phase voltage unbalance. The maximum value of the negative sequence voltage unbalance factor recorded during the measurement was equal to 1.3% at the limit of 2%.
The analysis of the voltage harmonic values shows that some of them reach large values. Fig. 4 presents a diagram of the effective values of voltage harmonic that have the largest values in the conditions of the maximum (Umax) and minimum (Umin) loads.
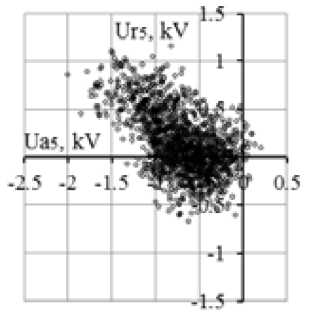
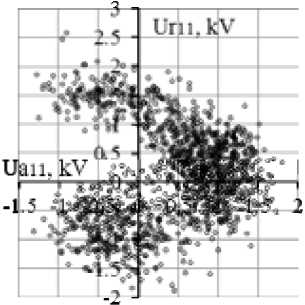
An analysis of measured information involved an analysis of phase angles for ten voltage harmonics. It was found that the phase angles range from 0 to 2π but are unevenly distributed. Phase angles of the 5-th and 11-th voltage harmonics have special distributions (Fig. 5). The notations used in the diagrams are: Ua – an active voltage harmonic, Ur – a reactive voltage harmonic. The overwhelming number of phase angles of the 5-th voltage harmonic range from π/2 to 3π/2.
The analysis of the series of measured values of voltage harmonics involved the calculation of the following statistical parameters [15]: maximum value (max), minimum value (min), mathematical mean (aver) and standard deviation (sd). Table 1 presents the results of a statistical analysis for ten odd – 41 –
a) b)
Fig. 3. Oscillograms of voltage in the conditions of a) maximum loads, b) minimum loads
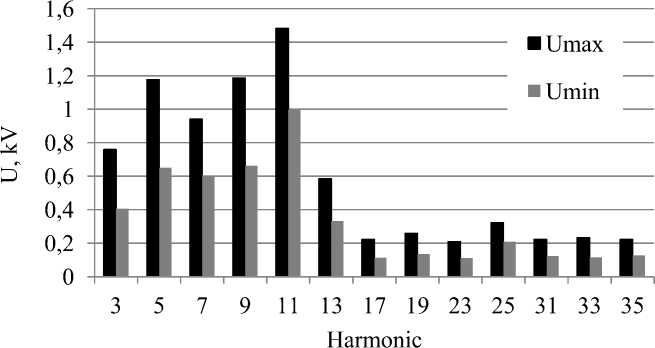
Fig. 4. Diagram of voltage harmonics
a)
Fig. 5. Diagrams of phase angles of a) 5-th and b) 11-th voltage harmonics
b)
harmonics of one phase voltage at which the limits established in State standard 32144-2013 are most often exceeded at the network nodes. The voltage harmonic values vary in the range from several volts to several kilovolts.
Histograms were constructed for the values of ten voltage harmonics given in Table 1. Then, using the Pearson criterion, they were checked for compliance with the laws of the Gaussian and Rayleigh distribution. The purpose of the check was to confirm or refute the statements made by the authors of [6] that the parameters of the harmonic conditions are in most cases distributed in accordance with – 42 –
Table 1. Statistical assessment of voltage harmonics of phase A, kV
An analysis of currents at the node connecting the pulp-and-paper mill to the supply network
Fig. 7 presents oscillograms of currents for the maximum and minimum load conditions. In the minimum load conditions the current waveforms are severely distorted.
Changes in the magnitudes of the total harmonic distortion of current K = 1^ In 11 1 - 100% are \ n = 2
presented in Fig. 8. Values K I under the minimum loads at night reach several hundreds of percentage points. During the daytime in the maximum load conditions, when the main process equipment is in operation, the value K I does not exceed 6%.
a)
Fig. 7. Oscillograms of currents in the a) maximum load conditions, b) minimum load conditions
b)
The diagram clearly shows a group of coefficients which is much higher in value than the others. These are the so-called outliers or abnormal elements [15, 16] that violate the stationarity of the series. Not always and not all abnormal elements can be determined visually. Special tests and methods are used to search for them in a series of measured parameters. These methods are the Irwin method [19], the Von Neumann test [20], the Darling test [21] and others.
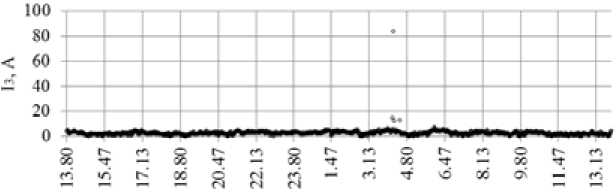
Testing of the 3-rd current harmonic using the Irwin method showed that there are 4 elements in the array of the 3-rd current harmonic, namely 862, 865, 867 and 881. One of them, namely 865, is significantly larger than the other elements. Fig. 9 shows a scatter diagram of the 3-rd current harmonic on which the abnormal elements can be seen.
The other harmonics also have abnormal currents. The analysis shows that the current of the 1-st harmonic with abnormal elements had values of less than 6.5 A. At the time point corresponding to measurement 865 the value of the 1-st current harmonic was 5.2 A.
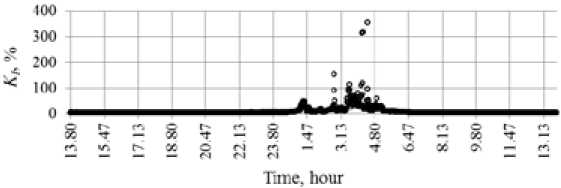
Fig. 8. Scatter diagram of the K I
Time, hour
Fig. 9. Abnormal elements of the 3-rd current harmonic
The abnormal elements distort the real picture of operation therefore they should be excluded in many cases. The analysis involved a statistical assessment of harmonics for the current of phase A of ten odd harmonics whose voltage values exceed the limits established in State standard 32144-2013 most often. The results of the calculations are given in Table 2. As can be seen from the Table, the current harmonic values vary over a wide range. Comparison of the maximum and minimum values and standard deviations indicates their wide variation.
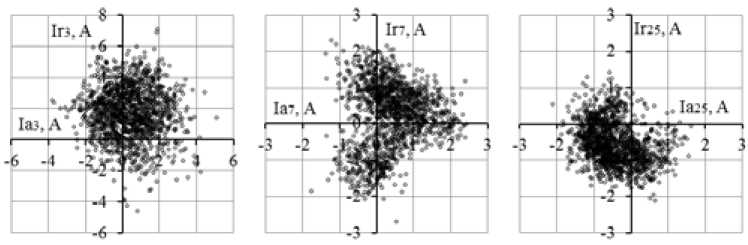
To analyze the phase angles of the current harmonics in the complex plane the scatter diagrams were constructed (Fig. 10). Active and reactive components of current harmonics were calculated using the expressions Ian = In cos φIn , Irn = In sin φIn for all 1440 measurements, where n – harmonic order. The analysis of the diagrams enables us to conclude that the phase nodes lie in the range from 0 to 2π, but are unevenly distributed across the quadrants of the complex plane, for example, in diagrams 10b) and 10c)
Histograms showing distribution of the values of the active and reactive components of the current harmonics were constructed and checked according to the Pearson criterion for the correspondence of the distributions to the Gauss and Rayleigh laws. It appeared, that the active component of the 3-rd current harmonic is distributed according to the Gauss law (Fig. 11a) and the correspondence of reactive component to the Gauss law was not confirmed by checking with the Pearson criterion (Fig. 11b).
Table 3 presents the results of the analysis of the distribution laws for ten odd harmonics: current magnitude, active and reactive components. The notations used in the Table are: G is the Gaussian distribution law, M is a mixture of several distribution laws. All three values of the analyzed currents
Table 2. Statistical assessment of current harmonics of phase A, A
|
Parameter |
Harmonic |
|||||||||
|
3 |
5 |
7 |
9 |
11 |
13 |
17 |
19 |
23 |
25 |
|
|
max |
15.12 |
3.11 |
4.65 |
1.94 |
6.01 |
4.37 |
2.34 |
1.75 |
2.14 |
4.68 |
|
min |
0.07 |
0.02 |
0.07 |
0.01 |
0.04 |
0.01 |
0.02 |
0.01 |
0.03 |
0.01 |
|
aver |
2.56 |
1.00 |
1.17 |
0.73 |
2.13 |
1.18 |
0.36 |
0.39 |
0.70 |
1.06 |
|
sd |
2.51 |
0.78 |
0.95 |
0.43 |
1.17 |
0.67 |
0.27 |
0.35 |
0.40 |
0.63 |
a)
b)
c)
Fig. 10. Diagrams of the phase shift angles for the current harmonics: a) 3-rd, b) 7-th, c) 25-th
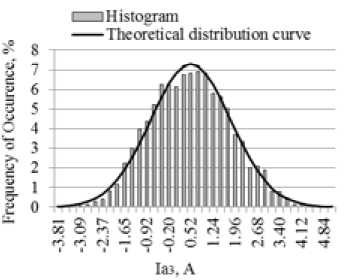
a)
Fig. 11. Distribution of values of the 3-rd current harmonic: a) active, b) reactive
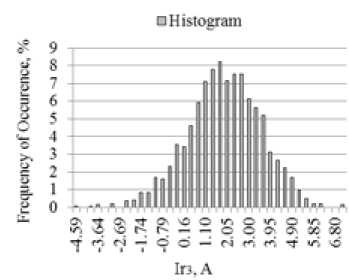
b)
are distributed according to the Gauss law only at the 7 and 13-th harmonics. At the 5, 17-th and 23-rd harmonics all three currents have mixtures of different distribution laws. At the 3-rd, 9, 11, 19 and 25-th harmonics one or two of the three values are distributed according to the Gauss law and the rest have mixtures of the known distribution laws.
To assess the effect of current harmonics on voltage harmonics, linear correlation coefficients ( rUnIn ) were calculated for phase A [15]. They are presented in Table 4.
The Chedoke scale was used to estimate the strength of a linear relationship between the current and voltage harmonics [22]. The analysis established the following degrees of correlation: no correlation (if r UnIn = 0–0.1) at the 7-th harmonic; weak correlation (if r UnIn = 0.1–0.3) at the 3-rd, 17 and 19-th harmonics; moderate correlation (if r UnIn = 0.3–0.5) – at 5, 11, 13 and 25-th harmonics; noticeable correlation (if r UnIn = 0.5–0.7) at 9-th and 23-rd harmonics. There is no strong relationship.
We can conclude that nonlinear loads connected to other nodes of the network also make a large contribution to the formation of voltage harmonics at the node to which the mill is connected.
Table 3. Distribution law harmonics current
|
Current |
Harmonic |
|||||||||
|
3 |
5 |
7 |
9 |
11 |
13 |
17 |
19 |
23 |
25 |
|
|
I n |
M |
M |
G |
— M |
— G |
— G |
M |
M |
M |
G |
|
I an |
G |
M |
G |
G |
M |
G |
M |
G |
M |
M |
|
Irn |
M |
M |
G |
G |
M |
G |
M |
M |
M |
M |
Table 4. Coefficients rUnIn for phase A
|
Correlation coefficient |
Harmonic |
|||||||||
|
3 |
5 |
7 |
9 |
11 |
13 |
17 |
19 |
23 |
25 |
|
|
r UnIn |
0.29 |
0.34 |
-0.07 |
0.51 |
0.43 |
0.43 |
0.16 |
0.22 |
0.55 |
0.31 |
An analysis of active power harmonics at the node connecting the pulp-and-paper mill to the supply network
Active powers at any harmonic were calculated as follows
P nt = U nt I nt cos φ nt , (1)
where U nt , I nt – effective values of voltage and current of the n - th harmonic measured on the interval of 1 minute, t – the number of a measurement interval, φnt – phase angle between the vectors of voltage and current of the n-th harmonic on the measurement interval t , which is calculated as φnt = φUnt – φInt.
Fig. 12 presents a plot of the active power of the 1-st harmonic. The maximum value of power reached 42.91 MW, the minimum – 0.2 MW. The magnitudes of angles φnt enable the conclusion on the direction of active power flows with respect to the node at which the measurements were made. In the event that angles φnt lie within the ranges from 0 to π/2 or from 3π/2 to 2π then the active power of harmonics flow from the network to the load and the node for the n-th harmonic is a load node. If the angles φnt lie within the range from π/2 to 3π/2 active power is directed from the load to the network and the node for the n-th harmonic is generating. The angles φ nt most often lie in the range from 0 to 2π, but for some harmonics. They are distributed in a complex plane very unevenly.
Fig. 13 presents an example of a diagram of the angle distribution φ nt of the 3-rd harmonic. For some part of the measurement time the active power of the 3-rd harmonic is directed from the network to the load and for the other part of the time from load to the network.
The measured currents, voltages and phase angles between them were used to calculate the active power of harmonics 2-40. It was established that the directions of the active power flows for
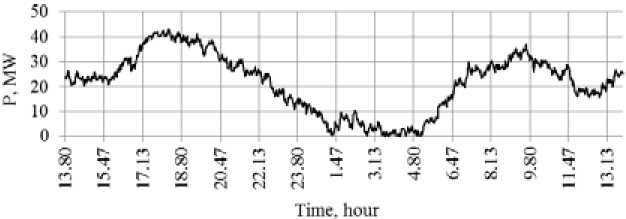
Fig. 12. A plot of the active power of the 1-st harmonic of the mill
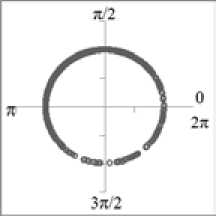
Fig. 13. Angle distribution φ nt of the 3-rd harmonic
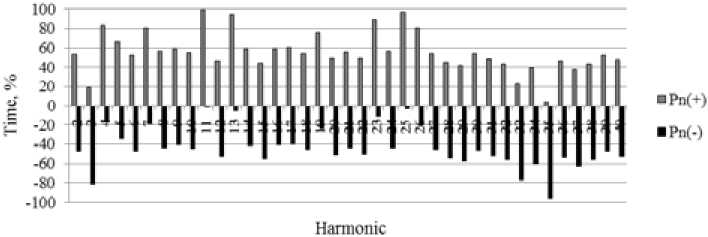
Fig. 14. Diagram of directions for the harmonic active powers
Table 5. Statistical estimates of P n (–) and P n (+) , kW
Fig. 14 demonstrates a diagram showing the amount of time during which the harmonic active power flows through the node connecting the mill to the supply network from the network to the load and vice versa. In the diagram the harmonic active power with the minus sign ( P n (–) ) is directed from the mill load to the network and with the plus sign ( Pn (+) ) – from the network to the load. As can be seen from the diagram, the directions of power from the network to the load prevail.
The magnitudes of active power of the even harmonics in both directions are very small and do not exceed 0.1 kW. Significant flows of active power in both directions are observed at some odd harmonics. The statistical characteristics of the harmonics active power are given in Table 5. At the mill connection node the active power of the 3-rd harmonic directed to the network has a larger value, while in the direction from the network to the load the 11-th harmonic active power is larger. The magnitudes of powers of odd harmonics, which are not listed in Table 5, do not exceed 0.2 kW.
When power is supplied from a source with sinusoidal voltage, the load receives the active power of the 1-st harmonic Pn (+) . Most of this power is consumed by electrical equipment to perform useful work P W . The remaining part is converted by nonlinear equipment to active powers of harmonics of orders n >1. Let us denote this power as Pn (–) . Active power of the 1-st harmonic can be represented as
Table 6. Statistical estimates of Pdt
|
Parameter |
P dt , kW |
P dt , % P Wt |
|
max |
17.25 |
6.59 |
|
aver |
4.92 |
0.08 |
P 1(+) = P W + P n (–) . (2)
Together with the active power of the 1-st harmonic the load of the mill receives active powers of orders n >1 – P n (+) from the network, which are created by nonlinear loads connected to other nodes in the network. Numbers of harmonics Pn (–) and Pn (+) can be different. Thus, the active powers P = P 1(+) + P n (+) flow to the load of the mill through the node connecting it to the network.
The total active power of the n-th harmonic for n >1, i.e. detrimental power as it is called in [2], is determined as follows
P d = P n (–) + P n (+) . (3)
Based on the expression obtained, we calculated the total values Pdt for harmonics 2-40 for all 1440 elements. Table 6 presents the statistical estimates of P dt in the measurement units of active power and in the percentage of useful power PWt . As seen from the Table, the maximum magnitudes differ greatly from the average values. An analysis of arrays P dt consisting of 1440 elements shows that some of the abnormal elements are several times larger in magnitude than the other elements of the array. They give the maximum power values. The abnormal elements were not excluded as they are taken into account by meters when measuring electrical energy. It also follows from the Table that the share of detrimental active power flowing through the node of the mill connection to the network is not large compared to the effective active power. However, it is worth noting that the Table demonstrates the results of calculations only for 24 hours of one phase of the mill electrical network.
Conclusions
-
1. The phase voltages at the mill connection node during the measurement time are within acceptable limits. The phase voltages are slightly unbalanced and their waveforms are distorted. The total harmonic distortion of voltage K U exceeds the limit only in phase C. The values of the voltage harmonics are in the range from several volts to several kilovolts. For most harmonics they have distributions that are mixtures of different distribution laws. Only the voltages of the 11 and 25-th harmonics are distributed according to the Gauss law and the 19-th harmonic is distributed according to the Rayleigh law. The phase angles of the voltage and current harmonics are in the range from 0 to 2π, however, their distribution across the quadrants of the complex plane is uneven.
-
2. Phase currents of the load during the measurement time change. They have the highest values during the daytime and the lowest – at night. At night the phase current waveforms are highly distorted. The total harmonic distortion of current K I during operation of the main process equipment does not exceed 6%. There are abnormal elements in the arrays of current harmonics. They are much larger than the rest of the elements. A small number of magnitudes of the effective current harmonics and
-
3. The values of the coefficients rUnIn indicate that nonlinear loads connected to other network nodes influence the formation of voltage harmonics.
-
4. Harmonic active powers change the flow direction during the measurement time. For some part of the time they flow from the load to the supply network and for the other part – from the network to the load. Their values range from several watts to several tens of kilowatts. Harmonic active powers that are the canonical harmonics of nonlinear equipment have the highest values.
their active and reactive components are distributed according to the Gauss law. The overwhelming majority of the distributions represent mixtures of different distribution laws.
References Specific features of harmonic conditions at the node connecting a pulp-and-paper mill to a supply network
- Zhezhelenko I.V., Sayenko Y.L. Electric losses, caused by high harmonics in electric power supply systems, Proceedings of the X Conference-Seminar International School on Non-sinusoidal Currents and Compensation 2010. Łagów, Poland, June 15-18, 2010.
- Czarnecki L.S. Working, reflected and detrimental active powers, IET Generation, Transmission & Distribution, 2012, 6(3), 233-239.
- Тимофеев Д.В. Режимы в электрических системах с тяговыми нагрузками, М.: Энергия, 1972. 296 с. .
- Emanuel A.E., Orr J.A., Cyganski D., Gulachenski E.M. A survey of harmonic voltages and currents at the customer’s bus, IEEE Trans. on Power Delivery, 1993, 8(1), 411-421.
- Chung-Hsing Hu, Chi-Jui Wu, Shih-Shong Yen, Yu-Wu Chen, Bor-An Wu, Jan-San Hwang. Survey of harmonic voltage and current at distribution substation in Northern Taiwan, IEEE Trans. on Power Delivery, 1997, 12(3), 1275-1284.
- Probabilistic Aspects Task Force of the Harmonics Working Group Subcommittee of the Transmission and Distribution Committee. Time-varying harmonics: Part I - Characterizing measured data, IEEE Trans. on Power Delivery, 1998, 13(3), 938-944.
- Nejdawi I.M., Emanuel A.E., Pileggi D.J., Corridori M.J., Archambeault R.D. Harmonics trend in USA: a preliminary survey, IEEE Trans. on Power Delivery, 1999, 14(4), 1488-1494.
- Vasconcellos A.B., T.I. R. de C. Malheiro, Castillo B.C., A.T. da Silva, Festa A.V., Gomes F.L. Analysis of power quality in a system of relay TV, Proceedings of the 14-th International Conference on Harmonics and Quality of Power. Bergamo, Italy, September 26-29, 2010.
- Фардиев И.Ш., Васильев Ю.А., Меер В.М. Энергосберегающие лампы и их влияние на электрическую сеть. Журнал «Энергетика Татарстана», 2009, 4(16), 8-12 .
- Hartungi R., Jiang L. Investigation of power quality in health care facility, Proceedings of the International Conference on Renewable Energies and Power Quality (ICREPQ’10). Granada, Spain, March 23-25, 2010.
- Боровиков В.С., Волков М.В., Иванов В.В., Литвак В.В., Мельников В.А., Погонин А.И., Харлов Н.Н. Опыт корпоративного обследования электрических сетей 110 кВ Сибири, Томск: Изд-во ТПУ, 2010. 227 с. .
- Kovernikova L.I. Results of the research into the harmonics of loads connected to the nodes of high-voltage network, Proceedings of International Conference on Renewable Energies and Power Quality (ICREPQ’14). Cordoba, Spain, April 8-10, 2014.
- Kovernikova L.I. Research into harmonic power in the high-voltage networks, Renewable Energy & Power Quality Journal of European Association for the Development of Renewable Energies, Environment and Power Quality (EA4EPQ), 2016, 1(14), 696-701.
- Targosz R., Chapman D. Application Note. Cost of poor power quality, ECI Publication No Cu0145, May, 2012.
- Кобзарь А.И. Прикладная математическая статистика. Для инженеров и научных работников, М.: ФИЗМАТЛИТ, 2012. 816 с. .
- Закс Л. Статистическое оценивание. Пер. с немецкого В.Н. Варыгина. Под ред. Ю.П. Адлера и В.Г. Горского. М.: Статистика, 1976. 598 с. .
- Айвазян С.А., Бухштабер В.М., Енюков И.С., Мешалкин Л.Д. Прикладная статистика: Классификации и снижение размерности, М.: Финансы и статистика, 1989. 607 с. .
- Королев В.Ю. ЕМ-алгоритм, его модификации и их применение к задаче разделения смесей вероятностных распределений: Теоретический обзор, М.: Изд-во ИРИ РАН, 2007. 94 с. .
- Irwin J.O. On a criterion for the rejection of outlying observations, Biometrika, 1925, 17(3-4), 238-250.
- Von Neumann J. Distribution of the ratio of the mean square successive difference to the variance, Annals of mathematical statistics, 1941, 12(4), 367-395.
- Лемешко Б.Ю., Лемешко С.Б., Постовалов С.Н., Чимитова Е.В. Статистический анализ данных, моделирование и исследование вероятностных закономерностей. Компьютерный подход, Новосибирск: Изд-во НГТУ, 2011. 888 с. .
- Шуметов В.Г., Крюкова О.А. Методология и практика анализа данных в управлении: методы одномерного и двумерного анализа, Орел: Изд-во ОФ РАНХиГС, 2013. 177 с. .
