Speckle Reduction with Edge Preservation in B-Scan Breast Ultrasound Images

Author: Madan Lal, Lakhwinder Kaur, Savita Gupta
Journal: International Journal of Image, Graphics and Signal Processing(IJIGSP) @ijigsp
Article in issue: 9 vol.8, 2016.
Free access
Speckle is a multiplicative noise that degrades the quality of ultrasound images and its presence makes the visual inspection difficult. In addition, it limits the professional application of image processing techniques such as automatic lesion segmentation. So speckle reduction is an essential step before further processing of ultrasonic images. Numerous techniques have been developed to preserve the edges while reducing speckle noise, but these filters avoid smoothing near the edges to preserve fine details. The objective of this work is to suggest a new technique that enhances B-Scan breast ultrasound images by increasing the speckle reduction capability of an edge sensitive filter. In the proposed technique a local statics based filter is applied in the non homogeneous regions, to the output of an edge preserving filter and an edge map is used to retain the original edges. Experiments are conducted using synthetic test image and real time ultrasound images. The effectiveness of the proposed technique is evaluated qualitatively by experts and quantitatively in terms of various quality metrics. Results indicate that proposed method can reduce more noise and simultaneously preserve important diagnostic edge information in breast ultrasound images.
Speckle Noise, Smoothing, Edge preservation, Breast Ultrasound (BUS) image
Short address: https://sciup.org/15014016
IDR: 15014016
Text of the scientific article Speckle Reduction with Edge Preservation in B-Scan Breast Ultrasound Images
-
I. Introduction
Breast cancer is most common disease among women all over the world. In 2016, about 246,660 new female breast cancer cases are expected in the United States only [1]. It is a second leading cause of death among women after lung cancer. Breast cancer is treated better when it is detected in early stage [2]. Medical images such as Magnetic Resonance Image (MRI), X-Ray and Ultrasound Image, are very important tools used for diagnosis of human illness like cancer. Among these, ultrasound images are more suitable for human use because of their non-invasive, portable, low cost and harmless nature. But medical ultrasound images suffer from an inevitable noise known as speckle noise. Speckle is a multiplicative noise that significantly affects the
visual interpretation and alters the diagnostic decisions [3] [19].
In order to reduce the speckle noise, it is necessary to improve the ultrasound image without destroying useful diagnostic information. Various techniques for speckle reduction have been developed [4-11], [14-16]. These techniques are divided into different categories.
-
A. Linear filters
Many speckle reduction filters in the literature use linear filtering based on local statics. These filters replace the central pixel value based on the neighborhood statics. Mean [4] and order statics filtering OSF [5] are examples of linear speckle reduction filters. In these techniques, it is assumed that the speckle noise model has a multiplicative form.
-
B. Adaptive filters
Adaptive filters are spatial domain filters that produce the noiseless regions for most homogeneous neighborhood regions and leave the edges. Lee [6], Kuan [7], Frost [8] filters are examples of adaptive filters. In these filters smoothing is performed in the regions where local variance is low.
-
C. Partial Differential Equation based filters
These filters exploit partial differential equations to define the cost function for speckle reduction. Anisotropic Diffusion AD [9] and Speckle Reducing Anisotropic Diffusion SRAD [10] are differential equation based filters. AD is a nonlinear filter which simultaneously performs noise reduction and contrast enhancement. Smoothing is carried out depending on the edges and their directions in the image. SRAD use a coefficient of variation pointing to the minimum of the cost function [22]. SRAD iteratively process the noisy image with adaptive weighting filters. The ability of partial differential equation based filters is that while smoothing they preserve important edges [17].
-
D. Transform Domain Filters
This category includes multi scale methods which use wavelets for speckle reduction. Here the input image is decomposed into detailed and approximation components and hard or soft thresholding is applied [11-12]. Threshold selection plays an important role in noise reduction [16]. Here the general assumption is that noise is modeled by Gaussian distribution after log compression. In order to relax this condition Pizurica et al. [13] proposed a wavelet-based Generalized Likelihood ratio formulation and imposed no prior on noise and signal statistics.
The motive of speckle reduction filters is smoothing of the input image with preservation of edge information because in ultrasonic images, edges contains the useful information that the experts are concerned about, but there is always a tradeoff between noise suppression and loss of information. Some filters can perform more smoothing [4-8] [15] but at the cost of edge information and others [9-11] are able to retain the important edges but with less smoothing. In this paper a technique is proposed that is able to use the combined property of both edges preserving and smoothing filters.
Speckle noise is formed due to constructive and destructive interferences of backscattered echoes from the scatteres and its presence complicates the visual inspection and further processing of BUS images. Over the years many techniques have been proposed to reduce the speckle noise [4-16] but due to its multiplicative nature, it cannot be removed completely. Efforts are still on to design the techniques which can smooth the speckled images without any loss of diagnostic information. A similar technique is proposed by Gungor and Karagoz in [14] for speckle reduction. The authors used the features of two different filters, Speckle Reducing Anisotropic Diffusion filter (SRAD) [10] and Non Local Means based Speckle filter (OBNLM) [15]. SRAD is used as an edge preserving filter and OBNLM is applied for smoothing purposes. The output of these filters is combined using the homogeneity map to produce a speckle free image. Homogeneity map is a binary image formed using the local statics of speckled input image. A window (subpart of original image) is selected manually and its local statics are calculated. Then local statics for all the image pixels using a moving window are also calculated. For each pixel location the values of statics being calculated are compared with the statics of the manually selected window. Based on these statics of two windows a binary map is generated, called as homogeneity map. These binary values of the map are used to combine the output of two different filters.
Shortcomings of the method given in [14] are:
-
• It needs human interaction for its working because for every image, user needs to select an initial window (part of the input image) manually for statics (mean, variance) calculation from speckled image.
-
• Selecting a proper size of the window is also not a trivial matter, because the whole process of homogeneity map calculation depends on the statics of the manually selected window.
-
• Another limitation is that calculation of homogeneity map also depends on the contrast of speckled input images.
To make the system independent, an automatic technique is proposed. The proposed method is independent of operators and gives better edge preserved and smoothed output.
-
III. Materials and Method
Nonlinear spatial domain speckle reduction filters perform smoothing in homogeneous regions, but evade this process near edges in order to preserve important diagnostic information. Thus non-linear filters, leave some speckle in non-homogeneous regions. The main motive of this work is to reduce this left out speckle. Therefore, a technique is proposed to further improve the B-Mode BUS images while preserving the important diagnostic information. To achieve this, initially an edge preserving filter is applied. This filter reduces the noise in homogeneous regions and retains the edges. While retaining the edges, some noise is left out near the edges. To find out the edge regions, an edge detector is applied to the output of edge preserving filter and its eight neighborhoods are selected. Then a smoothing filter is applied on this edge region. The smoothing filter reduces the noise near the edges, but at the same time it destroys some edges. Destroyed edges are recovered with the help of the original edge map from the original image.
In this work, initially Anisotropic Diffusion filter [9] is applied to enhance the speckled input BUS image. The Anisotropic Diffusion filter is one of the best, spatial domain filter used for speckle reduction in ultrasonic images [17-18], [21]. The main property of this filter is that it simultaneously reduces the noise and enhances the contrast of input image [19], but it is a nonlinear filter which smooth’s the homogeneous regions and slows down the diffusion process in non- homogeneous regions to retain the edge information.
To further enhance the input image and to reduce the left out speckle, First Order local static filter [5] is applied in the edge regions. To find the edge regions, Canny edge detector with threshold 0.25 (observed practically) is applied to the output of diffusion filter, because it is proven that Canny edge detector is a better technique than other available edge detection methods (Sobel, Laplacian of Gaussian, Prewitt, and Robert’s edge detector) [25]. The canny operator gives a binary image known as an edge map. In this edge map, white pixels represent the edges and black pixels represent the homogeneous regions. But the edge map contains the information only for the pixels that represent the edges. However the spatial domain adaptive filters left out the speckle not only on the edges but also near the edges. So to further improve the speckle reduction process, eight neighborhoods of white pixels in the edge map are used for future processing. In the second step, the local statics based filter is applied to the output of the anisotropic diffusion filter to enhance the region corresponding to eight neighborhood area of edge map. This filter eradicates speckle near the edge regions, but at the same time it also smoothed out some low gradient edges. These smoothed edges are finally recovered from the original image with the help of the original edge map.
A. Anisotropic Diffusion Filter
Anisotropic diffusion (AD) is a non linear technique used simultaneously for speckle reduction and contrast enhancement. It smoothes homogeneous regions and retain edges. The standard isotropic diffusion equation is given by “(1)”.
dg i , j , ‘i d. = div ( d V g ) (1)
Where V g is the image gradient, (ij) specifies the spatial position in artificial time parameter t, , , is the original noisy image in initial conditions in the continuous domain and d is the diffusion parameter.
Perona and Malik [9] propose a nonlinear diffusion method that is able to reduce diffusivity at the locations that have larger possibility to be edges. Authors replaced diffusion equation, “(1)”, by the introduction of a function d. t = f (| V g|) that smooth the original image and at the same time; it tries to preserve brightness discontinuities with equation “(2)”.
dg i , j , V d = div [ d i, j , t V g i, j , t ] (2)
Where K is a positive gradient threshold parameter, it is known as flow constant or diffusion constant.
Another diffusion coefficient equation is proposed in [25].
d V g | =
2IA g j l
2 + ( A gj|/K 1)2
Where K1=K/2.
Anisotropic diffusion filter is provided with two different diffusion equations, known as option1 and option2. Option1 favors high contrast edges over low contrast ones and option2 favors wide regions over smaller ones. In this work, option1 is used because it gives better quantitative results [18].
B. First Order Statistics Filter
First Order Statistics (FOS) Filter performs noise filtering on an image using local statics such as mean and variance around a pre-specified pixel neighborhood. It was first introduced by J. S. Lee [5] and was tested on synthetic aperture images (SAR) images [6] with satisfactory results. The main advantage of FOS filter is that it enhances the visual quality of a noisy input image by providing more smoothing. It can be described by using following “equation (6)”.
div [ d i,j, t V g i,j, t ]=
dd d i,j,t d gi,j,t
+
dd d i,j,t d gi,j,t
Where (i,j) are pixel coordinates. F ij is estimated noise free pixel value. G ij is noisy pixel value and G is mean of all pixels in the local moving window, including pixel G ij. Ki j is weighting factor. It is a function of local statics (mean, standard deviation and variance) in the moving window and its value lies between 0 and 1. Most of the FOS filters are implemented by using different weighting factor functions [6] [20] [23].
In the proposed work, the ratio of variance to mean of 3x3 moving window is used as a weighting factor. It is helpful in smoothing the speckle noise in non homogeneous regions. In this work “(6)” is redesigned as follows:
Where (| V g is the gradient magnitude, and d(| V g|) is an edge stopping function. Edge stopping function is also called diffusion coefficient. It stops the diffusion in the edge regions. It is chosen to satisfy d^0 when | V g|^ ™ , so that the diffusion is stopped across edges.
The choice of diffusion coefficient “(4)” can greatly affect the extent to which discontinuities are preserved. If d(| V g|), is constant at all locations, then smoothing proceeds in an isotropic manner and if d(| V g|), is allowed to vary according to the local image gradient, then it will have anisotropic diffusion.
Fij I wm + ^ w /' I wm ( I ij 1 wm ) (7)
Where, I wm is the mean and σ w2 is variance of all pixels present in the local window. I ij is the value of the center pixel in the moving window. Following equations “(8)” and “(9)” are used to find the values of local window mean and variance.
( I™ ) ij
1 w 2
w 2
ti ^ ( i - m )( j - n )
m =— w / 2 n =— w / 2
d V g | =
1 + ( V g^K )2
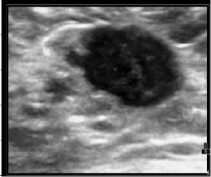
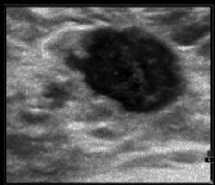
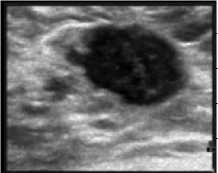
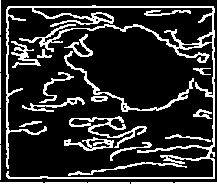
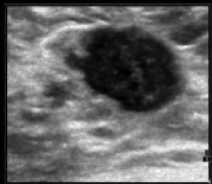
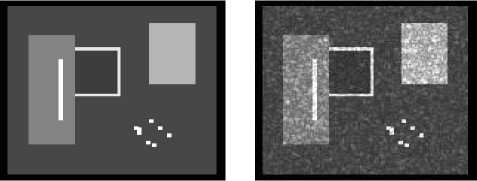
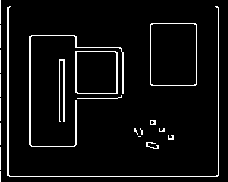
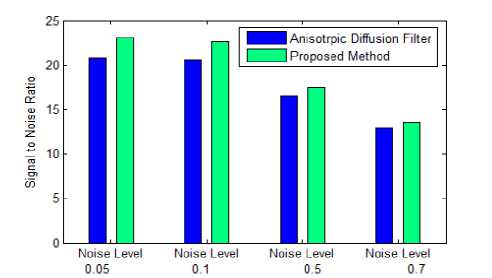
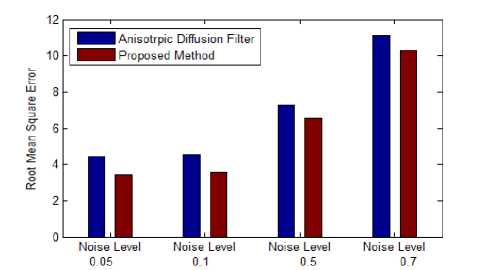
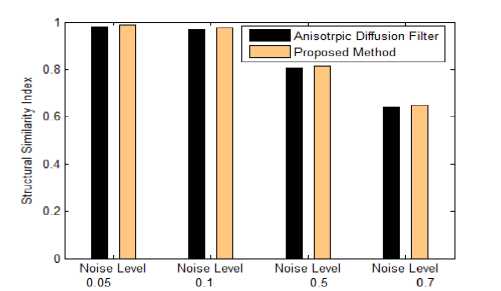
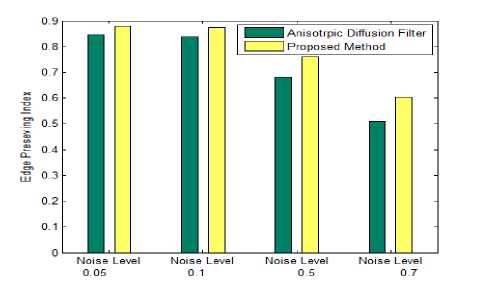
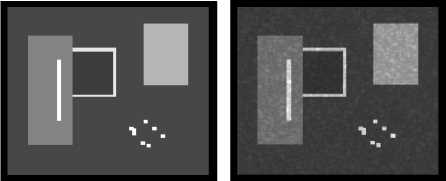
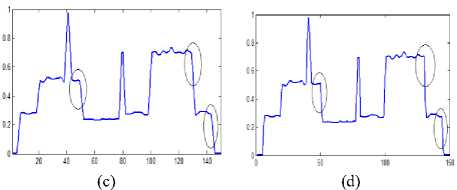
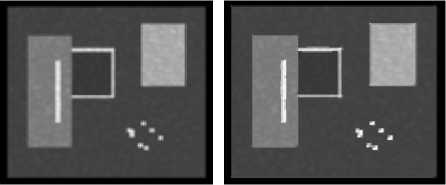
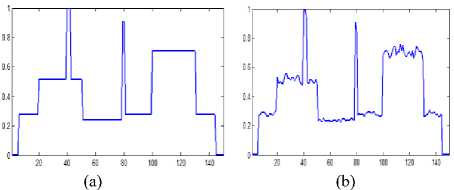
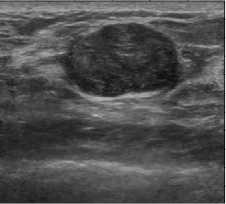
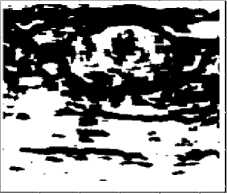
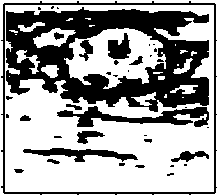
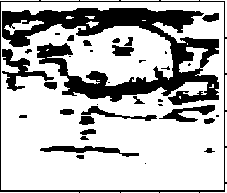
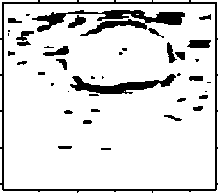
( w2 z m=—w] 2 w2 z( n =-wj 2 (i-m)( j-n) ■( wm )ij) <9> High value of weighting factor indicates the presence of non homogeneous regions in the window and low value represents the smooth area. So the change in intensity of pixel depends on the value of value of weighting factor in current window. Local statics filters are sensitive to the shape and size of moving window. In this work, 3x3 size of moving window is used because for heterogeneous regions, smaller window size is preferred and here local statics filter is applied specially in edge neighborhood regions. IV. Proposed Method An ideal filter should both reduce speckle and preserve edges. Adaptive speckle reduction filters perform the same, but when these filters try to retain the edges, some speckle is left out near the edges. A technique is proposed to reduce this left out speckle and to further improve the smoothed image without destroying important diagnostic edge information. In this work two filters are selected, Anisotropic Diffusion filter and Local Statics based filter. Anisotropic Diffusion filter enhances the image and also retain the important edges. As Anisotropic Diffusion is an adaptive filter, it slows down the smoothing process upon the occurrence of edges in the input image. Due to this adaption nature, some speckle still remains in the edge regions. To reduce this leftover speckle, First Order Statics filter, known as the modified local statics filter is applied in the edge regions. Modified local statics filter performs smoothing in the edge regions, but at the same time it destroys some low gradient edges. To retain the information about destroyed edges, an edge map is used that is produced by applying the Canny edge operation on the output of AD filter. Following steps are used to find the proposed output. Step 1. Input speckled B-Mode BUS IMAGE. Step 2. Apply Anisotropic Diffusion filter for image smoothing and store its output as IMAGE1. Step 3. Apply canny edge detector on the enhanced image (IMAGE1) to find the edge map EDGE1. Step 4. Find the eight neighborhoods of edge map and store it as EDGE2. Step 5. Apply First Order Statics filter to corresponding locations of eight neighborhood edge map (Edge2) in the output of Anisotropic Diffusion filter image (IMAGE1) and store its result as IMAGE2. Step 6. Superimpose the edge map EDGE1 to find the final output. If EDGE1(i,j)== 1 Then FINAL(i,j)=IMAGE(i,j) Else FINAL(i,j)=IMAGE2(i,j) Step7. End Edge map EDGE1, is generated by applying Canny edge detector on the output of AD filter. Edge map is a binary image containing one values corresponding to edges and zeros corresponding to homogeneous regions. EDGE2 is derived from EDGE1 by setting the eight neighboring pixels to one in the edge map EDGE1. Fig.1. Flowchart for proposed method In the second step, the local static filter is applied to the output of the AD filter in the regions corresponding to ones of EDGE2 and stored its result as IMAGE2. To recover the destroyed edges by local statics filter in IMAGE2, edge map EDGE1 is used to combine original input image (IMAGE) and output of the local statics filter (IMAGE2) and final image (FINAL) is generated. FINAL is the desired output that is a better smoothed and edge preserved image. (a) (b) (c) (d) (e) Fig.2. (a) Original BUS Image (b) Speckle simulated image with noise value=0.3 (c) Output of Anisotropic Diffusion filter (d) Corresponding edge map (e) Eight neighborhoods edge map (f) Final combined output image. (f) V. Experiment Results and analysis The proposed technique is implemented using Matlab (2012a). To check the performance, noise free synthetic test image is downloaded from [28]. A model, given by Aleksandra Pizurica [13] is used to simulate the speckle noise of variance 0.7 in the test image. Downloaded test image and its corresponding speckled image are shown in the Fig.3. (a) (b) (d) Fig.3. (a) Synthetic test Image (b) Speckle simulated image with variance=0.7 (c) edge map of speckled image (d) Eight neighborhood map of original edge map. Method is also applied on real time BUS Images and downloaded BUS Images from [26-27] containing benign and malignant tumors. A cumulative code is developed to implement the edge preserving filter “(3)”, smoothing filter “(7)” and to combine the output of these filters using an edge map. The method is evaluated experimentally and its quantitative results are recorded in Table1. A. Quality Metrics To evaluate the performance, image quality metrics, Signal to Noise Ratio (SNR), Root Mean Square Error (RMSE), Structured Similarity Index (SSI) [17] and Edge Preservation Index (EPI) are used [11]. • Signal to Noise Ratio SNR is a measurement of distortion. It shows the success of noise reduction filter, especially in homogeneous regions. It is calculated as: SNR = 1Glog10 Where is the variance of noise free original image and is the variance of error. The value of SNR should be high for good quality image. • Mean Square Error (MSE) The mean square error between the original image f (m, n) and the reconstructed image g (m, n) is given by MN MSE = EE( f(m, n) - g(m, n) )2 (11) MXN m=1 „=1 Here M x N represents the size of the image. MSE measures the average of the squares of the errors. A very small value of MSE mean that the image is very close to the original. • Root Mean Square Error (RMSE) The root mean square error is the square root of mean square error and its value should be minimal for better quality of image. • Structural similarity index Structural similarity index is used to measure similarity between two images. The measure between two images X and Y of common size is calculated as: SSIM = (2^X ^Y+ 2.55)(2CTXY+7.65) (12) (Д^ + ^ + 2.55) (^Y + ^Г + 7.65) Where µx, µy are mean of X and Y.σ2x is variance of X and σ2y is variance of Y. σxy is the covariance of X and Y. The result of SSIM lies between -1 and 1. SSIM is a measure, which indicates the ability of a filter to preserve details and structures of interest in a noisy image. • Edge Preservation Index EPI is used to calculate edge preserving ability of a filter [11]. It is calculated as: Epi= E(aI-M -AF ) ^(ai -aI )2 ^(af -af )2 Results show that the proposed method gives better results for all quality metrics at all noise levels (σ=0.05 to σ=0.9). As the smoothing filter is applied in the eight neighborhood area of the edge map, it is able to reduce the noise near the edges which is ignored by the Anisotropic Diffusion filter. Table 1 show that the values of SNR are more for proposed technique and it indicates better smoothness. Whereas values of RMSE are comparatively less, that is also desirable. SSIM represents the structural similarity between original and processed image and EPI indicates the edge preserving capability of a filter. Values for both these parameters should lie between zero and one and values near one indicate better results which are given by the proposed method. To further demonstrate the results graphically, bar graphs are used. Fig.4(a-d), shows the graphical representation of SNR, PSNR, SSIM and EPI values between Anisotropic Diffusion filter and Proposed method at different noise levels ( σ=0.05,0.1,0.5,0.7). The graph shows that the Proposed Method gives better results for all quality metrics at different noise levels. Where ΔI and ΔF are high pass filtered versions of the image I and F, obtained with a 3x3 pixel standard approximation of Laplacian operator. The larger value of EPI means more ability to preserve edges. B. Quantitative Results In Table 1, values of quality metrics are recorded after applying, Anisotropic Diffusion filter and Proposed method on the test image shown in Fig3 (a) with varying noise levels. (a) Table 1. show the Values of various quality parameters for Anisotropic Diffusion Filter and Proposed Method at different noise levels. Standard Deviation Method SNR RMSE SSIM EPI σ=0.05 AD 20.8435 4.4345 0.9796 0.8466 Proposed 23.0371 3.4482 0.9865 0.8797 σ=0.08 AD 20.7434 4.4868 0.9748 0.8427 Proposed 22.8199 3.5397 0.9817 0.8761 σ=0.1 AD 20.6136 4.5564 0.9703 0.8387 Proposed 22.6942 3.5821 0.9764 0.8726 σ=0.3 AD 18.7665 5.6346 0.9020 0.7741 Proposed 20.1678 4.7984 0.9092 0.8294 σ=0.5 AD 16.5723 7.2574 0.8083 0.6807 Proposed 17.4668 6.5337 0.8156 0.7617 σ=0.7 AD 14.5109 9.2084 0.7177 0.5870 Proposed 15.2499 8.4591 0.7258 0.6775 σ=0.9 AD 12.8648 11.1269 0.6395 0.5081 Proposed 13.5509 10.2859 0.6493 0.6026 (b) (c) (d) Fig.4. Bar Graphs representing quality metric values between Anisotropic Diffusion Filter and Proposed method at different noise levels (σ=0.05, 0.1, 0.5, 0.7) (a) Signal to Noise Ratio (b) Root Mean Square Error (c) Structural Similarity Index and (d) Edge Preserving Index To show the edge preservation ability, image profiles of the original image, speckle simulated image, Anisotropic Diffusion filters output image and proposed method’s output image are shown in Fig.6. To calculate the image profile, “improfile” function present in the Matlab library is used. This function retrieves intensity values of pixels along a line. To maintain the similarity, a fixed reference line (X1=1, Y1=65, X2=150, Y2=65) is used for all the images. In Fig.6 (d), circular regions show that the proposed method preserve the important edges. (a) (b) Fig.6. Image profile of (a) Test Image (b) Noisy image with noise value =0. 3 (c) Output image given by the Anisotropic Diffusion filter (d) Output image of Proposed method along the line (X1=1,Y1=65,X2=150,Y2=65) C. Comparison with the method given by M.A.Gungor et.al [14]. In [14] authors used homogeneity map method to reduce the speckle noise in ultrasound images. In this technique, two filters are used; Speckle Reducing Anisotropic Diffusion (SRAD) filter and Non-Local Means-based Speckle (OBNLM) filter. Edge preserving filter (SRAD) is applied in the edge regions and smoothing filter (OBNLM) is applied in the homogeneous regions. The final output of the method [14] depends on the structure of homogeneity map. Homogeneity map has black and white pixels and these pixels are used to combine the output of two filters. Black pixels of the map represent the edge regions and white pixels represent the homogeneous regions of the input speckled image. But the calculation of homogeneity map depends on the smoothing factor (SF). It is calculated by comparing local statics of moving window and statics of a pre-defined window. If Ratio1 is the ratio of variance to mean of predefined homogeneous region and Ratio2 is the ratio of variance to mean of a moving window. Then a pixel is set in the homogeneity map, If the following condition is satisfied. (c) (d) Ratio!<= Ratio 2+Ratio 2* SF (14) As shown in the Fig.7(c-f) slight change in the smoothing factor has considerable effect on the generation of homogeneity map; this in turn changes the final output. Fig. 7(a-b) shows the input BUS image and its corresponding speckled image with a noise value (σ =0. 3) and Fig 7(c-f) represents the homogeneity map for different smoothing factor values (SF=0.001, 0.1, 0.5 0.9). Fig.5. (a) Synthetic test Image (b) Speckle simulated images with σ=0.2 (c) Anisotropic diffusion filters output (d) proposed methods output (a) (b) ( c) (d) (e) Fig.7. (a) Input BUS Image (b) Speckle simulated image with noise value=0.3. Homogeneity maps for different for smoothing factors © SF=0.001 (d) SF=0.1 (e) SF=0.5 (f) SF=0.9 (f) Homogeneity maps (Fig.7(c-f)) are generated by comparing the local statics (ratio of variance to mean) of a predefined homogeneous window of speckled input image to the local statics of all the pixels neighboring windows of size 11 x 11 for of the input image. To maintain the uniformity, the same predefined homogeneous window of size 11x11 is used for the calculation of different maps. . As the structure of homogeneity map changes with minor changes in the smoothing factor, different or incorrect maps may be generated from input images of different contrasts. This drawback is removed in the proposed method. In this method edge map is used instead of homogeneity map and construction of edge map does not depend on contrast or smoothing parameter of input image. Also, no manual window selection is required for map calculations so it is an automatic method. VI. Conclusion In this paper, an improved technique is suggested that is able to produce more smoothed and edge preserved breast ultrasound images. In this technique, two filters are used, an edge preserving filter and a smoothing filter. Initially, a standard, spatial domain edge preserving filter (Anisotropic Diffusion filter) is selected for enhancement of speckled input images. Then an edge map is generated using the Canny edge operator. A smoothing (refined local static) filter is applied in the eight neighboring regions of edge map to the output of AD filter. The local statics filter is a linear filter and it is able to smooth the heterogeneous regions, which are otherwise left out by the adaptive filter, but at the same time, it smoothed out some low gradient edges. Finally, the original edge map is used to retain the information about these smoothed edges from the input image. Proposed method is evaluated qualitatively and quantitatively using quality metrics. Results show that the technique is able to reduce more noise and simultaneously preserve the important edge information in B-scan BUS images. Acknowledgements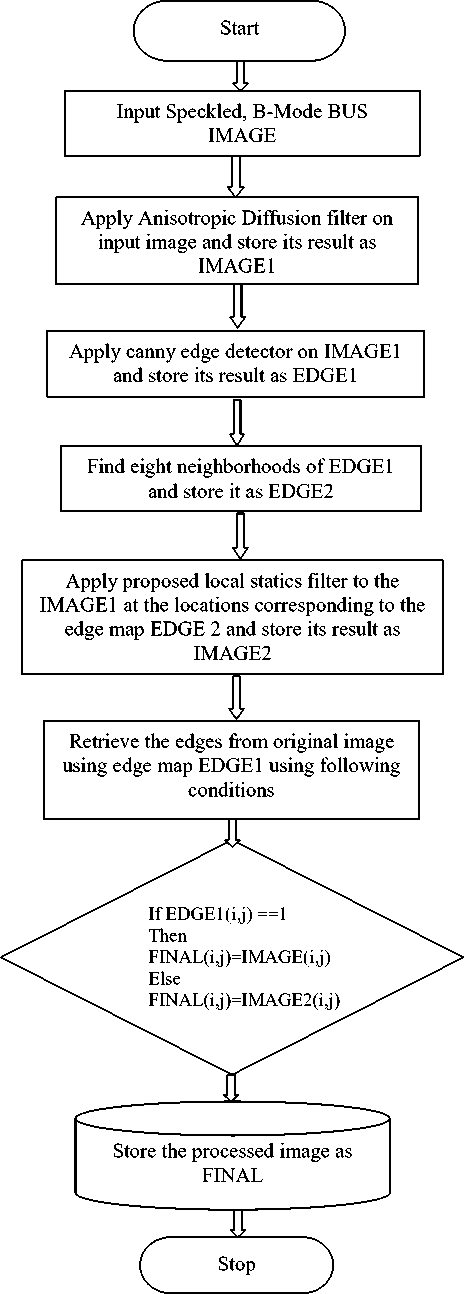


References Speckle Reduction with Edge Preservation in B-Scan Breast Ultrasound Images
- Cancer facts and figures by American Cancer Society (2016).
- R. Shivaramakrishna, R. Gordan, "Detection of breast cancer at smaller size can reduce the likelihood of metastatic spread: A quantitative analysis", Acad. Radiology. Vol.4 (1), pp. 8-12,1997.
- R.G. Dantas, E.T. Costa, S. Leeman, "Ultrasound speckle and equivalent scatterers", J. Ultrasonic. Vol. 43, pp. 405–420, 2005.
- Gonzalez RC, Woods RE. Digital Image Processing. 3rd edition , Pearson Education Ins, 2008.
- J.S. Lee, "Refined filtering of image noise using local statistics," Comput. Graphics Image Process, vol. 15, pp. 380–389, 1981.
- Lee JS. "Speckle analysis and smoothing of synthetic aperture radar images". Computer Graphics, Image Processing; Vol.17:,pp.24-32,1981.
- Kuan DT, Sawchuk AA, Strand TC, and Chavel P. "Adaptive restoration of images with speckle". IEEE Transactions on Acoustics, Speech and Signal Processing Vol.35 (3), pp. 373-383, 1987.
- Frost VS, Stiles JA, Shanmuggam KS, and Holtzman JC. "A model for radar images and its application for adaptive digital filtering of multiplicative noise". IEEE Transactions on Pattern Analysis and Machine Intelligence. Vol.4 (2), pp. 157-165,1982.
- Perona P, Malik J. , "Scale-space and edge detection using anisotropic diffusion." IEEE Transactions on Pattern Analysis and Machine Intelligence.Vol.12 (7), pp. 629-639, 1990.
- Y. Yongjian, S.T. Acton, "Speckle reducing anisotropic diffusion", IEEE Trans.Image Processing. Vol. 11 (11) pp. 1260–1270,2002.
- S. Gupta, L. Kaur, R. C. Chauhan, and S. C. Saxena, "A versatile technique for visual enhancement of medical ultrasound image," Journal of Digital Signal Processing, Elsevier, vol. 17, pp. 542-560, January 2007.
- A. Dixit, P. Sharma, "A Comparative Study of Wavelet Thresholding for Image Denoising", I.J. Image, Graphics and Signal Processing, Vol.46, pp.39-46,2014.
- A. Pizurica, A.M. Wink, E. Vansteenkiste, W. Philips, J. Roerdink, "A review of wavelet denoising in MRI and ultrasound brain imaging", Current Medical Imaging Reviews. Vol. 2 (2), pp. 247–260,2006.
- M. A. Gungor, I. Karagoz, "The homogeneity map method for speckle reduction in diagnostic ultrasound images", Vol.68, pp. 100-110, 2015.
- P.Coupe, P.Hellier, C.Kervrann, C.Barrilot, "Non local means speckle filtering for speckle reduction", IEEE transactions on speckle filtering, Vol.18, pp.2221-2229, 2009.
- A. Pizurika, W. Philips, I. Lemahieu, M. Acheroy, "A versatile wavelet domain noise filtration technique for medical imaging", IEEE Transaction on medical imaging. Vol 22, No 03, 2003.
- M Lal, L. Kaur, "Comparative analysis of B-Mode Breast Ultrasound Image Enhancement Techniques", International Journal of Computer Applications.Vol.131 (17), pp. 36-40. 2015.
- Cristina Stolojescu-Crisan, "A Comparison of Speckle Reduction Techniques in Medical Ultrasound Imaging". Applied Medical Informatics, Vol.36 (2), pp. 43-50, 2015
- M. Lal, L.Kaur, "Automatic seed point selection in B-Mode breast ultrasound images", presented at 50th golden jubilee annual convention organized by Computer Society of India. 02-05 December, 2015.
- C.P. Loizou, C.S. Pattichis, C.I. Christodoulou, R.S.H. Istepanian, M. Pantziaris, and A. Nicolaides "Comparative evaluation of despeckle filtering in ultrasound imaging of the carotid artery," IEEE Trans. Ultrason. Ferroelectr. Freq. Control, vol. 52, no. 10, pp. 1653–1669, 2005.
- B.K.Singh,K.Verma,A.S.Thoke, "Objective and Optical Evaluation of Despeckle Filters in Breast Ultrasound Images", IETE Technical review,Vol.32 No.5 pp.1-15.2015.
- A. A. Mahmoud, S. EL Rabaie, T. E. Taha, O. Zahran, F. E. Abd El-Samie, "Comparative Study of Different Denoising Filters for Speckle Noise Reduction in Ultrasonic B-Mode Images", I.J. Image, Graphics and Signal Processing. Vol.2, pp.1-8,2013.
- D.T. Kuan, A.A. Sawchuk, T.C. Strand, and P. Chavel, "Adaptive restoration of images with speckle," IEEE Trans. Acoust., vol. 35, pp. 373–383, 1987.
- Black M, Sapiro G, Marimont D, Heeger D. Robust anisotropic diffusion. IEEE Transactions on Image Processing .vol.7(3), pp.421-432,1998.
- D. Poobathy, R. Manicka Chezian, "Edge Detection Operators: Peak Signal to Noise Ratio Based Comparison", I.J. Image, Graphics and Signal Processing.Vol.10.pp-55-61,2014.
- Ultrasound Cases Information, http://www.ultrasoundcases.info/
- Ultrasound Images, http://www.ultrasound-images.com/breast.htm
- http://telin.ugent.be/~sanja/.
