Speech Enhancement based on Wavelet Thresholding the Multitaper Spectrum Combined with Noise Estimation Algorithm

Author: P.Sunitha, K.Satya Prasad
Journal: International Journal of Image, Graphics and Signal Processing @ijigsp
Article in issue: 9 vol.11, 2019.
Free access
This paper presents a method to reduce the musical noise encountered with the most of the frequency domain speech enhancement algorithms. Musical Noise is a phenomenon which occurs due to random spectral speaks in each speech frame, because of large variance and inaccurate estimate of spectra of noisy speech and noise signals. In order to get low variance spectral estimate, this paper uses a method based on wavelet thresholding the multitaper spectrum combined with noise estimation algorithm, which estimates noise spectrum based on the spectral average of past and present according to a predetermined weighting factor to reduce the musical noise. To evaluate the performance of this method, sine multitapers were used and the spectral coefficients are threshold using Wavelet thresholding to get low variance spectrum .In this paper, both scale dependent, independent thresholdings with soft and hard thresholding using Daubauchies wavelet were used to evaluate the proposed method in terms of objective quality measures under eight different types of real-world noises at three distortions of input SNR. To predict the speech quality in presence of noise, objective quality measures like Segmental SNR ,Weighted Spectral Slope Distance ,Log Likelihood Ratio, Perceptual Evaluation of Speech Quality (PESQ) and composite measures are compared against wavelet de-noising techniques, Spectral Subtraction and Multiband Spectral Subtraction provides consistent performance to all eight different noises in most of the cases considered.
Speech Enhancement, Wavelet thresholding, Multitaper Power Spectrum, Noise power estimation, smoothing parameter, SNR, threshold
Short address: https://sciup.org/15016082
IDR: 15016082 | DOI: 10.5815/ijigsp.2019.09.05
Text of the scientific article Speech Enhancement based on Wavelet Thresholding the Multitaper Spectrum Combined with Noise Estimation Algorithm
Published Online September 2019 in MECS
Speech is a basic way of communicating ideas from one person to another. This speech is degraded due to background noise .To reduce this background noise numerous speech enhancement algorithms were available, among them spectral subtractive algorithms are more popular because of their simple implementation and their effectiveness. In these algorithms Noise power spectrum is subtracted from the noisy power spectrum by assuming the noise spectrum is available. These methods introduce musical noise due to inaccurate estimate of noise. These spectral subtractive algorithms works well in stationary noise but they fails in non-stationary noise. This led to the use of low variance spectral estimation methods because spectral estimation plays a key role in speech enhancement algorithms. To reduce the variance an average of estimate can be calculated across all frequencies. To improve the speech quality and intelligibility in presence of highly non stationary noise, a speech enhancement algorithm requires noise estimation algorithms which update the noise spectrum continuously. Most of the speech enhancement applications in non-stationary scenarios use noise estimation methods algorithms which track the noise spectrum continuously. Now, researchers focus their attention to improve the speech quality and intelligibility using efficient noise estimation algorithms. Estimate of noise signal strongly depends on the smoothing parameter. If its value is too large i.e closer to one results in over estimation of the noise level. Generally, smoothing parameter is set to be small during speech activity to track the non-stationary of the speech. This makes the smoothing parameter as time and frequency dependent, taking into the consideration of speech presence or absence probability. Numerous noise estimation algorithms are available in literature. One among them is minimum statistics algorithm, proposed in [1] estimates the noise by considering the instantaneous SNR of speech using smoothing parameter and bias correction factor. It tracks the minimum over a fixed window and updates the noise PSD. The performance of this method was tested under non-stationary noise it results in large error and it is unable to respond for fast changes in increasing levels of noise power. Martín .R implemented spectral subtraction with minimum statistics and its performance was evaluated in terms of both objective and subjective measures. This was compared against spectral subtraction method that uses voice activity detection which results in improved speech intelligibility measures [2].Another variant of minimum statistics suggested in [3] implements estimates noise by continuous spectral minimum tracking in sub bands. In this method a different approach was used to obtain spectral minimum, by smoothing the noisy speech power spectra continuously using a non-linear smoothing rule. This non-linear tracking provides continuous smoothing over PSD without making any distinction between speech presence and absence segments. The shortcoming of this was when noise power spectrum increases, then the noise estimate increases irrespective of changes in the noise power level. Similarly when the noisy power is decreasing then the noise power is decreasing .This will results in overestimation of speech during speech presence regions i.e clipping of speech. This method was evaluated in terms of objective and subjective quality measures it shows its superior performance over Minimum statistics algorithm. The non-uniform effect of noise on the speech spectrum affects few frequency components severely than others. This led to the use of time recursive noise estimation algorithm which updates the noise spectrum when the effective SNR in a particular band is too small [4]. In this method noise spectrum is estimated as a weighted average of past and present estimates of noisy power spectrum depending on the effective SNR in each frequency bin .This algorithm works well in tracking the non-stationary noise in case of multitalker babble noise. Another type of recursive algorithm ,which uses a fixed smoothing factor, but the noise spectrum should be updated based on the comparison of the estimated a-posteriori SNR over a threshold[5].If this a-posteriori SNR is larger than the threshold indicates that speech presence and no update is required for noise spectrum. Otherwise it is treated as a speech absence segment, which requires a noise updating. This method is well known as weighted spectral averaging. In this method the threshold value, have a significant effect on the noise spectrum estimation .If the threshold value is too small noise spectrum is underestimated, conversely the threshold value is too high then the spectrum is over estimated. Improvements to the Minimum statistics was suggested in [6] by using optimal smoothing for noise power spectral density estimation. Cohen proposed noise estimation algorithm, which uses time-frequency dependent smoothing factor which requires continuous updating depending on the speech presence probability in each frequency bin .Speech presence probability was calculated as the ratio of the noisy power spectrum to its local minimum [6].This local minimum is computed considering the smoothed noisy PSD, over a fixed window by sample wise comparison of noisy PSD. This has a short coming ,it may lag when the noise power is raising from the true noise PSD .To address this shortcoming, a different approach was suggested in[8,9] uses continuous spectral minimal tracking and frequency dependent threshold was used to identify the speech presence segments .This method was evaluated in terms of subjective preference tests over other noise estimation algorithms like MS and MCRA. This method shows better performance .Further refinement to this algorithm was reported in [10] i.e noise power spectrum estimation in adverse environments by Improved Minima Controlled Recursive Averaging (IMCRA).This method involves two steps smoothing and minimal tracking .Minimal tracking provides Voice Activity Detection in each frame whereas smoothing excludes strong speech components. Speech presence probability is calculated using a –posteriori and a-priori SNRs. This method yields in lower values of error for different types of noise considered.
The structure of the paper is as follows, Section II provides Literature review , Multitaper spectral estimation and spectral refinement is given in Section III ,noise estimation by weighted spectral averaging technique was presented in section IV ,section V presents proposed speech enhancement method, results and discussion in VI and finally section VII gives conclusion.
-
II. Literature Review
This section presents literature review on spectral subtractive type algorithms for single channel enhancement techniques. In the past, number of researchers proposed different speech enhancement methods. Most of them are based on Spectral Subtraction (SS), Statistical Model based, Sub space algorithms and Transform based methods. One of the popular noise reduction method which is computationally efficient and less complexity for single channel speech enhancement is Spectral subtraction proposed by Boll S.F for both Magnitude and Power Spectral Subtraction which itself creates a bi-product named as synthetic noise[17].A significant improvement to spectral subtraction with over subtraction factor and spectral floor parameter to reduce the musical noise given by Berouti [19]is Non –Linear Spectral subtraction . Multi Band Spectral Subtraction (MBSS) proposed by S.D. Kamath with multiple subtraction factors in non-overlapping frequency bands [18] .Ephraim and Malah proposed spectral subtraction with MMSE using a gain function based on priori and posteriori SNRs[20].Spectral subtraction based on perceptual properties using masking properties of human auditory system proposed by Virag [21].Another method in spectral subtraction with Wiener filter to estimate the noise spectrum is extended spectral subtraction by Sovka [22]. Spectral Subtraction algorithm based on two-band is Selective spectral subtraction described by He,C.and Zweig,G. [23].Spectral subtraction with Adaptive Gain Averaging to reduce the overall processing delay given by Gustafsson et al[24].A frequency dependent spectral subtraction is non-linear spectral subtraction (NSS) method conferred by Lockwood and Boudy [25].The spectral subtractive type algorithms works well in case of additive noise but fails in colored noise. To overcome this problem Hu and Loizou proposed a Speech enhancement technique based on wavelet thresholding the multitaper spectrum [11] and its performance is evaluated in terms of objective quality measures.
-
III. Multitaper Spectral Estimation And Spectral Refinement
Due to sudden changes and sporadic behavior, Speech signal can be modeled as a non- stationary signal. As time evolves the statistics like mean, variance, co-variance and higher order moments of a non-stationary signal changes over time. Spectral analysis plays a major rule in speech enhancement techniques to get accurate noise estimation. FFT method is widely used to get power spectrum estimation in most of the speech enhancement algorithms especially in spectral subtractive type methods. The estimated power spectrum obtained by FFT is reduced by variance of the estimate and energy leakage across frequencies which create bias. To avoid leakage, multiply the signal in time domain with a suitable window which having less energy in side lobes. Type of window affects the noise estimate in speech enhancement algorithms, hence selection of desirable window which provides an accurate noise estimation plays a significant role in Speech enhancement process .Generally Hamming window is preferable with less energy in side lobes but it effects the estimate by reducing leakage but not the variance. In most of the speech enhancement algorithms noise estimate is obtained by using suitable windows which reduce the bias but not the variance. The variance can be reduced by taking multiple estimates from the sample which can be achieved by using tapers. Hu and Loizou [11] used these multi-tapers to get low variance spectral estimate ,further the spectrum was refined using wavelet thresholding ,Finally this was used to improve the quality of speech signal in case of highly non-stationary noise. Results shows that this method has superior performance in terms of quality measures with high correlation between subjective listening test and objective quality measures. Speech enhancement techniques find wide range of applications like hearing aids to personal communication, teleconferencing, Automatic Speech Recognition (ASR), Speaker Authentication and Voice operated Systems.
The multitaper spectrum estimator is given by
Sm(to) =1Ep=oSmtt ()(1)
With
Spmt() = |№>bp(m)%(m)e*|2
Here data length is given by N and bp is the p th sine taper used for spectral estimate [12] and bp is given by bp(m) = I-2- sin.лр(т+1),m = 0,.N - 1(3)
-
p N+1N+1
Further refinement of spectrum is obtained by applying wavelet thresholding techniques smt(m;x
^^^--(КХ-(4)
а (Ш )
Where v()) is the ratio of the estimated multitaper spectrum to the true power spectrum .Taking logarithm on both sides, we get logSmt() = log S ()) + logv(w)(5)
From this equation , we conclude that sum of the true log spectrum and noise can be treated as log of multitaper spectrum. If L is at least equivalent to 5 then logv()) will be nearer to normal distribution and the random variable n()) is given by
n() = logv()) - 0(L) + log(L) (6)
Z ()) is defined as
-
Z()) = logS mt ()) - 0(L) + log(L). (7)
The idea behind multitaper spectral refinement [11] can be summarized as
-
1. Obtain the multitaper spectrum of noisy speech using orthogonal sine tapers by equation1 .
-
2. Apply Dabauchies Discrete Wavelet Transform to get the DWT coefficients.
-
3. Perform thresholding procedure on the DWT coefficients.
-
4. Apply Inverse Discrete Wavelet Transform to get the refined log spectrum.
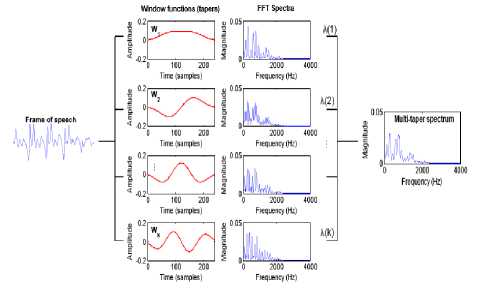
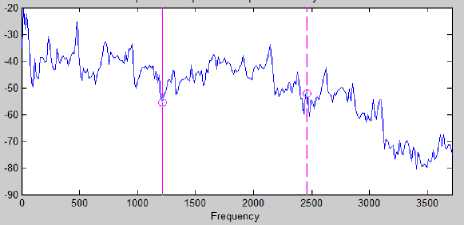
Fig.1. Multiple window method for spectrum estimation by individual windows.
(a)
(b)
(c)
Fig.3. (a),(b) and (c) Spectrum obtained by N=1,2,3.’N’ is the number of tapers
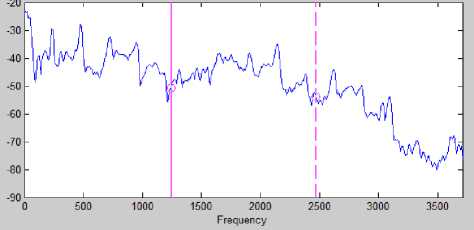
Fig.4. Final spectrum obtained by averaging
-
IV. Noise Estimation By Weighted Spectral Averaging
Noise estimation algorithms works on the assumption that the duration of analysis segment is too long enough that it should contain both low energy segments and speech pauses .Noise present in analysis segment is more stationary than speech. This paper uses noise estimation based on the variance of the spectrum suggested in [12].The noise spectrum updating will take place when the magnitude spectrum of noisy speech falls within a variance of the noise estimate. The noise spectrum was updated based on the following condition.
|S m£U ,K)| - a d (A,K) < eVVa^K) (8)
Where Vаr d (Л, K)represents the instantaneous variance of the noise spectrum and е is a adjustable parameter, |5 m£ (A,K)| is multitaper magnitude spectrum and a d (Л, K) is the estimate of the noise PSD .The variance of the noise spectrum was evaluated using the recursive equation
V ar d (Л, K) = 5 Vard (Л - 1, K)
+ (1-5)[|5 m£a ,K)|-ada,K)] 2 (9)
Where 6 is a smoothing parameter. ‘X, is a frame index and ‘K’ is a frequency bin .The noise estimation algorithm can be summarized as if
If
|S m£ (Z,K)| -ff d (Л- 1,K) < eVVar d (Z-l.K)
a d (Л, K) = a a d (Л -1, K) + (1 - a)|S m£ (Л, K)|(9)
VardU,K) = 6 Vard(A - 1,K) + (1 - 6)[|S m£U ,K)|
-a d (Z,K)] 2
Else
(7 d (Л,K) = (7(Л-1,K) (11)
This paper uses this weighted spectral averaging method for noise estimation from noisy power spectrum using the parameters 6=a=0.9 and е=2.5.
-
V. Proposed Method
The implementation details of speech enhancement method can be given as follows:
-
1. Obtain the multi taper estimate of the Noisy speech using sine tapers using equation1
-
2. Perform spectral refinement with the help of wavelet thresholding procedure, which involves Forward Discrete Wavelet Transform (FDWT), Thresholding and Inverse Discrete Wavelet Transform (IDWT).In this paper Dabauchies wavelets were used at level 5 decompition by using both soft and hard thresholding.
-
3. Compute Z(w) from the equation (6) and apply Discrete Wavelet Transform to Z(w) then threshold the multitaper spectrum for further refinement of spectrum and the refined log spectrum .
-
4. Estimate of the noise can be evaluated using weighted spectral recursive averaging algorithm discussed in section IV.
-
5. Perform multitaper spectral subtraction between the refined log spectrum of noisy speech and noise spectrum to get an estimate of Clean Speech spectrum .
S £ mt(u) - S "m£ (w) - S ™£ (w)
-
(12) Where ‘ β’ is spectral floor parameter .
-
6. Finally the enhanced speech Signal can be reconstructed using Inverse Discrete Fourier Transform and overlap- add method.
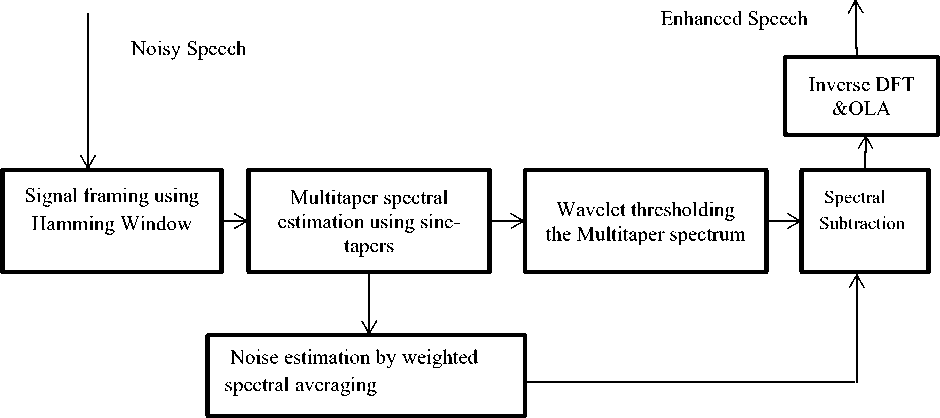
Fig.5. Block diagram of proposed method
and it results in negative values which are rounded as
,^JS^-S™, if §7 > S T x { p§r, if §r< ST,
-
VI. Results And Discussion
Assessment of speech enhancement techniques can be done either by using objective quality or subjective listening tests. Comparative analysis of original speech and processed speech signals by a group of listeners is known as subjective listening test based on human auditory system.. Which involves a complex process and it is difficult to identify the persons with good listening skills. While objective evaluation is done on mathematical comparison of clean and enhanced signals .In order to calculate the objective measures, the speech signal is first divided into frames of duration of 10-30 msec. This result in a single measure which gives the average of distortion measures calculated for all the processed frames. This section gives the performance analysis of the proposed method by using four numbers of bands. Simulations were performed in the MATLAB environment. NOIZEUS is used as a speech corpus which is available at [15] and used by the most of the researchers, containing 30 sentences of six different speakers, three are male and other three are female speakers originally sampled at 25 KHz and down sampled to 8 KHz with 16 bits resolution quantization. Clean Speech is distorted by eight different real-world noises (babble, airport, station, street, exhibition, restaurant, car and train) at three distinct ranges of input SNR (0dB, 5dB, 10dB). In this algorithm speech sample is taken from a male speaker, English sentence is ”we can find joy in the simplest things”. This paper presents the performance evaluation based on different quality measures which are segmental-SNR, Weighted Slope Spectral Distance
(WSSD) [13], Log Likelikelihood Ratio, Perceptual Evaluation of Speech Quality (PESQ) [14]and three different composite measures[13].
-
A. Segmental SNR (seg-SNR)
To improve the correlation between clean and processed speech signals summation can be performed over each frame of the signal [13] this results in segmental SNR .The segmental Signal-to-Noise Ratio (seg-SNR) in the time domain can be expressed as
V Nm+N-1 „2
CMP — _yM-1]nn ^n=NM x (n) /i-ix
'■ - M ZM=0 log 10 ^NmvN-i(x(”)-$(”))2 (14)
Here x(n) shows the original speech signal. x(n) is the processed speech signal, frame length is given by N and the number of frames is given by M. The geometric mean of all frames of the speech signal is seg-SNR [10], whose value was limited in the range of [-10, 35dB]
-
B. Log Likelihood Ratio (LLR)
This measure was based on LPC analysis of speech signal.
LLR(o;,a , )-loa(^|) (15)
\ахкхах/ ax , alg are the LPC coefficients of the original and processed signals. Rx is the autocorrelation matrix of the original signal .In LLR denominator term is always lower than numerator therefore LLR is always positive [13] and the LLR values are in the range of (0-2).
-
C. Weighted Slope Spectral Distance(WSSD)
This measure can be evaluated as the weighted difference between the spectral slopes in each band can be computed using first order difference operation[13].Spectral slopes in each band of original and processed signals are given by
WSSD = l^-i
X f=i W (j,m)(x x (j,m)-X y (j,m))2
T^WUm)
-
D. Perceptual Evaluation of Speech Quality (PESQ)
One among the objective quality measures which provides an accurate speech quality recommended by ITU_T [14] which involves more complexity in computation. A linear combination of average asymmetrical disturbance A ind and average disturbance D ind is given by PESQ.
PESQ=4.754-0.186D ind -0.008 A ind (17)
-
E. Composite Measures
Linear combination of existing objective quality measures results in a new measure [10].This can be evaluated by using linear regression analysis. This paper uses the multiple linear regression analysis to obtain the following new composite measures [13].These composite measures were measured on a five-point scale.
-
(i) Signal Distortion(C sig ): The linear combination of PESQ, LLR and WSSD measures results in a new composite measure named as Signal Distortion [13].This is evaluated using the following equation
C sig =3.093-1.029*LLR+0.603*PESQ-0.009*WSSD
-
(ii) Noise intrusiveness(C bak ): The linear combination of PESQ, seg-SNR and WSSD measures results in anew composite measure named as noise Distortion [13]. This is evaluated using the following equation.
C bak =1.634+0.478*PESQ+0.007*WSSD+0.063*seg-SNR
-
(iii) Overall Quality (C ovl ): Overall Quality is formed by Linear combination of LLR ,PESQ and WSSD measures and is given by
C ovl =1.594+0.805*PESQ-0.512*LLR-0.007*WSSD
Scale of signal degradation, background intrusiveness and overall quality measures are shown in table 1,2,3.
-
Table 1. Scale of Signal Distortion
5-No degradation, very natural
4-little degradation, fairly natural
3-Somewhat degraded, somewhat natural
2-fairly degraded, fairly unnatural
1-very degraded, very natural
-
Table 2. Scale of Background Intrusiveness
5-not observable
4-somewhat observable
3-observable but not intrusive
2-Somewhat intrusive
1-Very intrusive
-
Table 3. Scale of Overall quality
5-excellent
4-good
3-fair
2-poor
1-bad
To obtain objective quality measures for the proposed method first the multitaper spectrum was obtained using sine tapers. Further spectral refinement is achieved through wavelet thresholding the multitaper spectrum .Then noise spectrum is estimated using weighted spectral averaging. The results were compared against Wavelet de-noising using hard thresholding (WDH) and soft thresholding (WDS) suggested in [16], Spectral subtraction(SS) [17] and Multi Band Spectral Subtraction (MBSS) [18].
Table 4. Objective quality measures Segmental SNR(seg_SNR),Log Likelihood Ratio(LLR),Weighted Slope Spectral Distance (WSSD),Perceptual Evaluation of Speech Quality(PESQ)
|
Type of noise |
I/P SNR |
Parameter |
|||||||||||||||||||
|
Seg-SNR |
LLR |
WSSD |
PESQ |
||||||||||||||||||
|
WDH |
WDS |
SS |
MBSS |
PM |
WDH |
WDS |
SS |
MBSS |
PM |
WDH |
WDS |
SS |
MBSS |
PM |
WDH |
WDS |
SS |
MBSS |
PM |
||
|
Airport Noise |
0dB |
-3.87 |
3.37 |
1.93 |
-2.18 |
- 1.31 |
3.03 |
2.68 |
1.78 |
1.1 |
1.33 |
121.38 |
116.38 |
94.84 |
57.04 |
72.85 |
1.69 |
2.03 |
1.60 |
1.86 |
2.16 |
|
5dB |
-2.12 |
-1.50 |
0.63 |
-1.12 |
1.18 |
2.67 |
2.14 |
1.24 |
0.69 |
0.84 |
117.61 |
112.61 |
75.18 |
52.75 |
54.46 |
1.85 |
2.26 |
2.28 |
2.44 |
2.74 |
|
|
10dB |
-0.5 |
0.00 |
3.72 |
1.18 |
4.16 |
2.05 |
1.88 |
0.98 |
0.64 |
0.87 |
104.95 |
99.95 |
64.84 |
45.73 |
38.75 |
1.94 |
2.39 |
2.30 |
2.55 |
2.85 |
|
|
Babble Noise |
0dB |
-4.23 |
3.73 |
1.98 |
-2.60 |
- 1.32 |
3.08 |
2.83 |
1.93 |
1.13 |
1.42 |
125.39 |
120.39 |
97.13 |
60.98 |
72.33 |
1.79 |
2.09 |
1.24 |
1.82 |
2.12 |
|
5dB |
-2.25 |
-1.75 |
0.15 |
-0.54 |
0.48 |
2.73 |
2.47 |
1.57 |
0.93 |
1.17 |
111.92 |
106.92 |
79.71 |
46.24 |
53.93 |
1.89 |
2.25 |
1.94 |
2.23 |
2.53 |
|
|
10dB |
-0.84 |
-0.34 |
3.18 |
0.58 |
3.00 |
2.19 |
1.85 |
.95 |
0.61 |
0.81 |
103.99 |
98.99 |
66.14 |
39.79 |
40.08 |
1.99 |
2.34 |
2.45 |
2.71 |
3.01 |
|
|
Car Noise |
0dB |
-3.41 |
2.91 |
1.33 |
-2.45 |
- 0.28 |
3.11 |
2.88 |
1.98 |
1.16 |
1.50 |
119.39 |
114.39 |
84.67 |
49.74 |
74.63 |
1.82 |
2.19 |
1.55 |
1.75 |
2.05 |
|
5dB |
-1.65 |
-1.15 |
1.48 |
-0.04 |
2.46 |
3.06 |
2.53 |
1.63 |
0.97 |
1.26 |
107.48 |
102.48 |
72.63 |
40.57 |
56.71 |
1.96 |
2.29 |
2.24 |
2.30 |
2.6 |
|
|
10dB |
-0.26 |
0.24 |
4.21 |
1.57 |
4.97 |
2.22 |
1.99 |
1.09 |
0.71 |
0.96 |
99.52 |
94.52 |
59.08 |
34.65 |
44.72 |
2.04 |
2.39 |
2.63 |
2.62 |
2.92 |
|
|
Exhibition Noise |
0dB |
-3.12 |
2.50 |
-1.57 |
-2.16 |
- 1.11 |
2.25 |
2.91 |
2.01 |
1.23 |
1.51 |
119.98 |
114.98 |
95.41 |
50.03 |
64.58 |
1.76 |
2.22 |
1.48 |
1.65 |
1.95 |
|
5dB |
-1.21 |
-0.71 |
1.01 |
-0.28 |
1.39 |
2.09 |
2.86 |
1.96 |
0.96 |
1.30 |
112.02 |
107.02 |
82.29 |
42.81 |
57.69 |
1.87 |
2.36 |
1.95 |
2.21 |
2.51 |
|
|
10dB |
0.95 |
1.45 |
4.03 |
0.93 |
4.08 |
1.89 |
2.02 |
1.12 |
0.73 |
1.09 |
100.85 |
95.85 |
69.44 |
44.05 |
53.41 |
1.95 |
2.44 |
2.15 |
2.48 |
2.78 |
|
|
Restaurant Noise |
0dB |
-4.38 |
3.88 |
2.52 |
-3.29 |
- 1.60 |
3.06 |
2.05 |
1.15 |
0.9 |
1.23 |
130.07 |
125.07 |
102.00 |
67.00 |
68.85 |
1.83 |
2.16 |
1.22 |
2.01 |
2.31 |
|
5dB |
2.48 |
2.98 |
0.12 |
-2.18 |
0.37 |
2.97 |
1.89 |
0.99 |
0.88 |
1.06 |
116.18 |
111.18 |
82.29 |
59.13 |
54.89 |
1.83 |
2.27 |
2.07 |
2.18 |
2.48 |
|
|
10dB |
-0.83 |
-0.33 |
3.05 |
-0.01 |
3.35 |
2.31 |
1.69 |
0.79 |
0.58 |
0.68 |
111.48 |
106.48 |
70.98 |
48.61 |
42.77 |
1.97 |
2.35 |
2.47 |
2.65 |
2.95 |
|
|
Station Noise |
0dB |
-2.63 |
2.13 |
1.-14 |
-3.51 |
- 2.35 |
3.26 |
2.86 |
1.96 |
1.07 |
1.24 |
114.53 |
109.53 |
94.79 |
77.95 |
68.19 |
1.76 |
2.23 |
1.47 |
1.75 |
2.05 |
|
5dB |
-2.52 |
-2.02 |
0.62 |
-0.54 |
1.22 |
2.23 |
2.77 |
1.87 |
0.99 |
1.23 |
114.44 |
109.44 |
77.77 |
44.26 |
59.15 |
1.93 |
2.23 |
2.17 |
2.19 |
2.49 |
|
|
10dB |
-0.42 |
0.08 |
3.50 |
1.50 |
4.48 |
1.78 |
2.11 |
1.21 |
0.73 |
1.23 |
102.57 |
97.57 |
67.98 |
42.53 |
45.36 |
2 |
2.37 |
2.47 |
2.59 |
2.89 |
|
|
Street Noise |
0dB |
-3.67 |
3.-17 |
2.03 |
-2.75 |
- 1.29 |
3.06 |
3.06 |
2.10 |
1.17 |
1.60 |
121.71 |
116.71 |
94.79 |
55.37 |
63.32 |
1.81 |
2.16 |
1.39 |
1.76 |
2.06 |
|
5dB |
-1.31 |
-0.81 |
0.01 |
-1.95 |
- 0.28 |
2.44 |
2.03 |
1.13 |
0.88 |
1.02 |
108.6 |
103.60 |
68.45 |
49.25 |
45.87 |
1.91 |
2.33 |
2.06 |
2.14 |
2.44 |
|
|
10dB |
0.43 |
0.93 |
4.31 |
-0.15 |
3.65 |
2.34 |
1.58 |
0.68 |
0.54 |
0.66 |
100.35 |
95.35 |
44.37 |
34.56 |
31.21 |
1.99 |
2.40 |
2.57 |
2.59 |
2.89 |
|
|
Train Noise |
0dB |
-2.61 |
2.-11 |
1.-51 |
-1.96 |
- 0.25 |
3.03 |
2.86 |
1.96 |
1.12 |
1.59 |
118.65 |
113.65 |
81.56 |
53.74 |
59.97 |
1.69 |
2.21 |
1.02 |
2.09 |
2.39 |
|
5dB |
-1.77 |
-1.27 |
0.95 |
0.01 |
1.41 |
2.67 |
2.24 |
1.34 |
0.96 |
1.70 |
111.42 |
106.42 |
70.41 |
41.94 |
53.12 |
1.85 |
2.31 |
1.98 |
2.13 |
2.43 |
|
|
10dB |
-0.07 |
0.43 |
3.81 |
1.16 |
4.39 |
2.05 |
2.14 |
1.24 |
0.67 |
1.05 |
104.18 |
99.18 |
55.20 |
37.36 |
40.78 |
1.94 |
2.39 |
2.23 |
2.51 |
2.81 |
|
Speech Enhancement based on Wavelet Thresholding the Multitaper Spectrum Combined
with Noise Estimation Algorithm
Table 5. Composite measures(C sig, C bak, C ovl) for eight different types of noises
|
Type of noise |
I/P SNR |
Parameter |
||||||||||||||
|
C sig |
C bak |
C ovl |
||||||||||||||
|
WDH |
WDS |
SS |
MBSS |
PM |
WDH |
WDS |
SS |
MBSS |
PM |
WDH |
WDS |
SS |
MBSS |
PM |
||
|
Airport Noise |
0dB |
-0.10 |
0.51 |
1.88 |
2.52 |
2.37 |
1.66 |
1.85 |
1.67 |
1.99 |
2.20 |
1.40 |
1.85 |
1.55 |
2.11 |
2.57 |
|
5dB |
0.40 |
1.24 |
2.87 |
3.33 |
3.39 |
1.76 |
1.99 |
2.25 |
2.36 |
2.53 |
1.71 |
2.31 |
2.42 |
2.81 |
3.02 |
|
|
10dB |
1.21 |
1.70 |
2.73 |
3.51 |
3.57 |
1.89 |
2.14 |
2.45 |
2.61 |
2.86 |
2.10 |
2.54 |
2.39 |
2.97 |
3.60 |
|
|
Babble Noise |
0dB |
-0.13 |
0.36 |
1.49 |
2.43 |
2.26 |
1.67 |
1.85 |
1.44 |
1.92 |
2.15 |
1.45 |
1.82 |
1.15 |
2.03 |
2.47 |
|
5dB |
0.42 |
0.94 |
2.29 |
3.02 |
2.93 |
1.82 |
2.02 |
2.03 |
2.34 |
2.54 |
1.71 |
2.13 |
1.95 |
2.56 |
3.03 |
|
|
10dB |
1.10 |
1.71 |
3.23 |
3.69 |
3.71 |
1.92 |
2.12 |
2.60 |
2.69 |
2.78 |
2.07 |
2.53 |
2.74 |
3.16 |
3.45 |
|
|
Car Noise |
0dB |
-0.08 |
0.42 |
2.03 |
2.45 |
2.11 |
1.73 |
1.94 |
1.83 |
1.97 |
2.18 |
1.46 |
1.88 |
1.64 |
2.03 |
2.38 |
|
5dB |
0.16 |
0.95 |
2.57 |
3.01 |
2.85 |
1.88 |
2.08 |
2.36 |
2.40 |
2.49 |
1.60 |
2.14 |
2.28 |
2.56 |
2.94 |
|
|
10dB |
1.14 |
1.64 |
3.20 |
3.58 |
3.46 |
1.98 |
2.18 |
2.78 |
2.74 |
2.65 |
2.09 |
2.50 |
2.83 |
3.07 |
3.27 |
|
|
Exhibition Noise |
0dB |
0.76 |
0.40 |
1.78 |
2.32 |
2.13 |
1.70 |
1.95 |
1.72 |
1.94 |
2.32 |
1.85 |
1.89 |
1.45 |
1.92 |
2.82 |
|
5dB |
1.06 |
0.61 |
2.20 |
3.00 |
2.75 |
1.81 |
2.08 |
2.09 |
2.37 |
2.50 |
2.02 |
2.02 |
1.91 |
2.56 |
3.04 |
|
|
10dB |
1.42 |
1.62 |
2.75 |
3.39 |
3.17 |
1.92 |
2.19 |
2.41 |
2.57 |
2.81 |
2.19 |
2.52 |
2.32 |
2.89 |
3.61 |
|
|
Restaurant Noise |
0dB |
-0.12 |
1.16 |
1.75 |
2.72 |
2.60 |
1.66 |
1.86 |
1.48 |
1.92 |
2.20 |
1.49 |
2.28 |
1.42 |
2.26 |
2.60 |
|
5dB |
0.09 |
1.51 |
2.47 |
2.92 |
3.00 |
1.76 |
2.00 |
2.04 |
2.12 |
2.47 |
1.54 |
2.44 |
2.10 |
2.46 |
2.96 |
|
|
10dB |
0.90 |
1.81 |
3.05 |
3.61 |
3.79 |
1.86 |
2.07 |
2.49 |
2.56 |
2.76 |
1.99 |
2.61 |
2.62 |
3.07 |
3.28 |
|
|
Station Noise |
0dB |
0.50 |
0.51 |
1.61 |
2.30 |
0.50 |
1.74 |
1.99 |
1.57 |
1.70 |
2.24 |
1.33 |
1.91 |
1.33 |
1.89 |
2.43 |
|
5dB |
0.93 |
0.60 |
2.71 |
2.93 |
2.80 |
1.82 |
2.00 |
2.33 |
2.32 |
2.54 |
2.00 |
1.96 |
2.32 |
2.49 |
3.03 |
|
|
10dB |
1.54 |
1.48 |
2.83 |
3.52 |
3.16 |
1.94 |
2.15 |
2.51 |
2.72 |
2.86 |
2.29 |
2.42 |
2.52 |
3.06 |
3.58 |
|
|
Street Noise |
0dB |
-0.06 |
0.20 |
1.54 |
2.40 |
2.12 |
1.71 |
1.91 |
1.48 |
1.91 |
2.42 |
1.48 |
1.76 |
1.25 |
2.00 |
2.70 |
|
5dB |
0.76 |
1.48 |
2.49 |
2.98 |
3.10 |
1.85 |
2.09 |
2.18 |
2.19 |
2.49 |
1.88 |
2.42 |
2.13 |
2.50 |
2.67 |
|
|
10dB |
0.98 |
2.06 |
3.52 |
3.74 |
3.88 |
1.95 |
2.18 |
2.86 |
2.62 |
2.75 |
1.99 |
2.71 |
2.98 |
3.14 |
3.31 |
|
|
Train Noise |
0dB |
-0.07 |
0.46 |
1.60 |
2.66 |
2.36 |
1.67 |
1.96 |
1.50 |
2.13 |
2.20 |
1.40 |
1.90 |
1.15 |
2.30 |
2.57 |
|
5dB |
0.46 |
1.22 |
2.34 |
2.96 |
2.33 |
1.80 |
2.06 |
2.13 |
2.36 |
2.53 |
1.71 |
2.30 |
2.02 |
2.50 |
3.02 |
|
|
10dB |
1.22 |
1.44 |
2.96 |
3.53 |
3.34 |
1.90 |
2.14 |
2.57 |
2.64 |
2.86 |
2.10 |
2.41 |
2.50 |
2.98 |
3.60 |
|
(a)
(b)
(c)
(d)
(e)
(f)
(g)
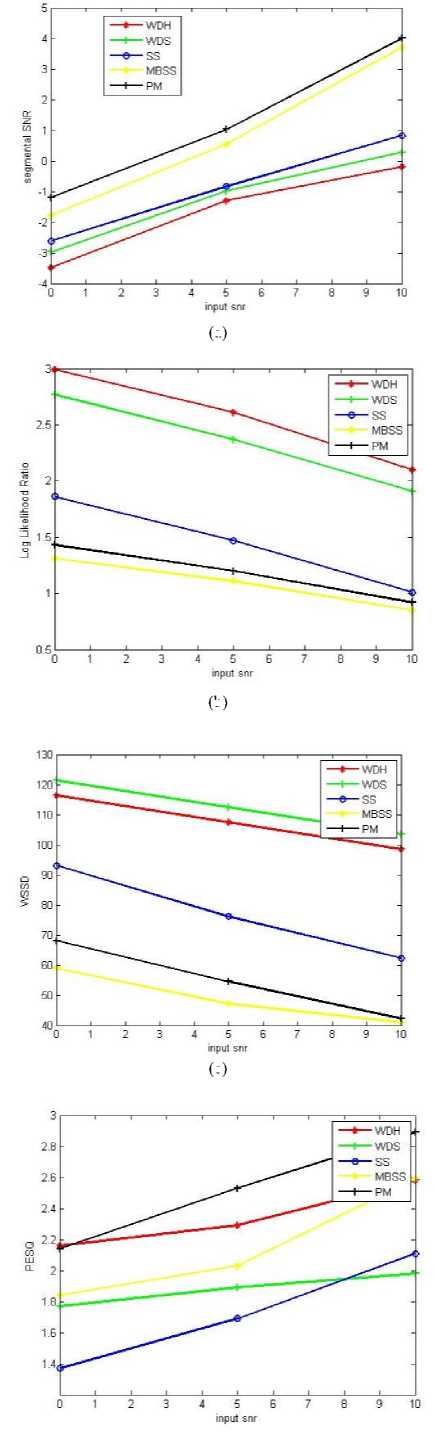
Fig.6. a)Segmental SNR b)Log Likelihood Ratio c)Weighted spectral slope distance d)PESQ e)Signal Distortion (C sig ) f) Background intrusiveness (C bak) g) Overall quality (C ovl) measures against input SNR.
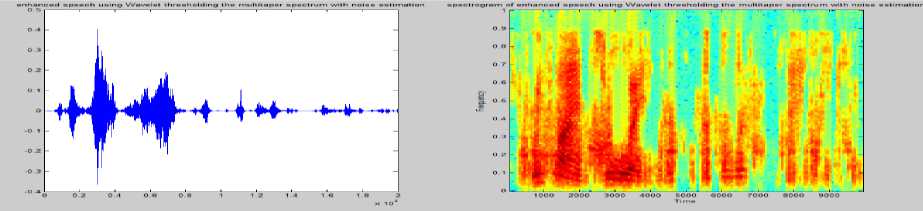
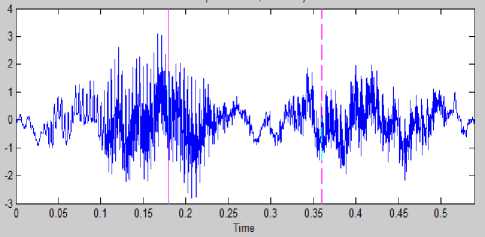
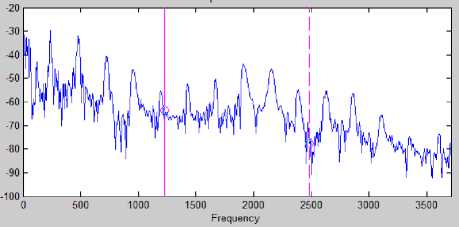
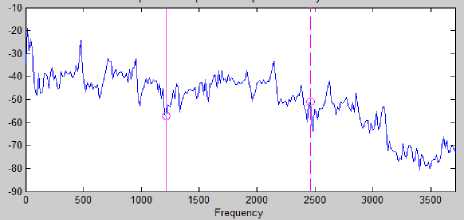
Fig.7. Time domain and spectrogram representation of Clean Speech noisy speech and enhanced speech signals by SS[17],MBSS[18],WDH,WDS[16] ,Wavelet thresholding the multi taper spectrum[11] and proposed method.
-
VII. Conclusion
References
References Speech Enhancement based on Wavelet Thresholding the Multitaper Spectrum Combined with Noise Estimation Algorithm
- R.Martin, “An efficient algorithm to estimate the instantaneous SNR of speech signals”, proceedings of Euro speech ,Berlin,pp.1093-1096,1993.
- R.Martin, “Spectral subtraction based on minimum statistics, Proceedings of European Signal Processing,U.K,pp.1182-1185,1994.
- G.Doblinger, “Computationally efficient speech enhancement by spectral minima tracking in sub bands”, proceedings of Euro speech ,Spain, pp:1513-1516,1995.
- H.Hirch, and C.Ehrlicher, “Noise estimation techniques for robust speech recognition”, proceedings of IEEE International Conference on Acoustic Speech Signal Processing, MI, pp.153-156,1995.
- R.Martin, “Noise Power Spectral Density Estimation based on Optimal Smoothing and Minimum statistics”, IEEE Transactions on Audio, Speech Processing pp.504–512, 2001.
- I.Cohen, “Noise Estimation by Minima controlled recursive averaging for robust speech enhancement”, IEEE Signal Processing. Letter, pp.12–15,2002
- I.Cohen, “Noise spectrum Estimation in adverse environments: Improved Minima controlled recursive averaging”, IEEE Transactions on Audio, Speech Processing, pp.466-475,2003.
- L.Lin ,W.Holmes and E.Ambikairajah , “Adaptive noise estimation algorithm for speech enhancement”,Electron .Lett,754-555,2003
- Loizou, R.Sundarajan,Y. Hu,”Noise estimation Algorithm with rapid Adaption for highly non-stationary environments “Proceedings on IEEE International Conference on Acoustic Speech Signal Processing,2004.
- Loizou, R.Sundarajan, “A Noise estimation Algorithm for highly non-stationary Environments”. Speech Communication,48,Science Direct , pp.220-231,2006.
- Yi.Hu ,P.C .Loizou.,"Speech enhancement based on wavelet thresholding the multitaper spectrum”, IEEE Transactions on Speech and Audio Processing,pp.59-67,2004.
- C.Ris and S.Dupont, “Assessing local noise level estimation methods: Applications to noise robust ASR”, Speech Communication, pp.141-158,2001.
- Yi.Hu ,P.C .Loizou.,"Evaluation of objective Quality Measures for Speech Enhancement " ,IEEE Transactions on Audio, Speech and Language Processing pp.229-238,Jan.2008.
- ITU_T Rec, “Perceptual evaluation of speech quality(PESQ), An objective method for end to end speech quality assessment of narrowband telephone networks and speech codecs”., International Telecommunications Union ,Geneva Switzerland, February 2001.
- A Noisy Speech Corpus for Assessment of Speech Enhancement Algorithms. https: // ecs.utdallas.edu/ Loizou /speech/noizeous.
- DL.Donoho, “De-noising by soft thresholding “,IEEE Trans.Inform.Theory,41(3), 613627,1995.
- Boll,S.F, “Suppression of acoustic noise in speech using spectral subtraction”. IEEE Transactions on Acoustics Speech and Signal Processing, 1979,27(2), 113–120.
- Kamath S., Loizou P., “A multiband spectral subtraction method for enhancing speech corrupted by colored noise”, Proc .IEEE Intl. Conf. Acoustics, Speech, Signal Processing, 2002.
- Berouti, M. Schwartz, R., Makhoul, J., "Enhancement of Speech Corrupted by Acoustic Noise”, Proc ICASSP 1979, pp.208-211
- Emphraim,Y. andMalah,D. ‘Speech enhancement using a minimum mean square error short time spectral amplitude estimator,IEEE Trans. Acoustics, Speech and Signal Processing, 1984 ,32(6)1109-1121.
- Virag,.N, Single channel speech enhancement based on masking properties of the human auditory system, IEEE Trans. Speech Audio Processing,1997(3),126-137.
- Sovka,P.Pollak, P.,Kybic,J. Extended spectral subtraction, proceedings on European conference on Signal Processing Communication, 1996, Trieste,Italy ,pp.963-966.
- He,C.and Zweig,G. “Adaptive two –band spectral subtraction with multi window spectral subtraction”, proceedings on IEEE Conference on Acoustics, Speech and Signal Processing, 1999, Phoenix, AZ,pp.793-796.
- Gustafsson,H., Nordholm,S. and Claesson,I. ”Spectral Subtraction using Reduced delay convolution and adaptive averaging”,2001, IEEE Trans. Speech Audio Processing,9(8),799-807.
- Lockwood,P.and Boudy,.J, “Experiments with a non-linear spectral subtractor(NSS),Hidden Markov Models and the projections, for roboust recognition in cars, Speech Communication11(2-3),215-228.
