Stabilogram mPCA Decomposition and Effects Analysis of Several Entries on The Postural Stability

Author: Dhouha MAATAR, Zied LACHIRI, Régis FOURNIER, Amine NAIT-ALI
Journal: International Journal of Image, Graphics and Signal Processing(IJIGSP) @ijigsp
Article in issue: 5 vol.4, 2012.
Free access
This paper presents an analysis of stabilogram using the modified Principal Component Analysis (mPCA) decomposition which will be employed to highlight the effects of different aspects on the human postural stability. The aim of this study is to analyze stabilogram center of pressure time series using the mPCA decomposition method. The mPCA is a decomposition method applied to a complex signal. It decomposes the stabilogram, considered as an additive model, into three components: trend, rambling and trembling. The study of the trace of analytic trembling (respectively of rambling) in the complex plan highlights a unique rotation center. So the phase is defined and two parameters are extracted: the area of the circle in which 95% of the trace's data points are located and the angular frequency. In this study 25 healthy volunteers (average age 31± 11 years) are required to stand upright on an electromagnetic platform either with eyes closed or open and with feet outspread or tighten. Experimental results show the efficiency of the parameter area to identify the effect of visual, proprioceptive and directional entries on the postural stability. These results are able to discriminate between control and young groups and indicate a less well-controlled posture for control subjects (34.5± 7.5y) relatively to young subjects (22.5 ±2. 5y). Results serve also to display that female subjects are more stable than males, that fat subjects are more stable than thin and that tall subjects are more stable than small.
Decomposition, mPCA phase, Rambling, Stabilogram, Trembling, Trend
Short address: https://sciup.org/15012298
IDR: 15012298
Text of the scientific article Stabilogram mPCA Decomposition and Effects Analysis of Several Entries on The Postural Stability
The analysis of postural control is very advantageous especially in medical field because it can prevent some postural pathology such as falls problem which is considered as a serious problem especially in the elderly population [1, 2].
The postural system is ensured by several sensory systems, including vestibular, visual, and proprioception systems [3]. These sensory systems can be affected by aging and so can cause impairment in the ability to maintain equilibrium [4].
Therefore it is very important to analyze the postural measures to detect if the impairment in postural control ability is pathological. The evaluation of the postural sway can be enforced by a static test. This test performs postural equilibrium in a static position and use a platform based on magnetic field [5, 6].
Using this platform allows the extraction of the center of pressure (COP)’s displacement of a subject, which can be used to quantify the postural stability. The stabilogram, which is the representation of the COP time series in anteroposterior (AP) and mediolateral (ML) direction, is deduced from this measure.
The analysis of the characteristics of the stabilogram requires the extraction of some specific parameters. As the stabilogram seems to be the result of superposition of many signals with different characteristics and as it is known as to be nonlinear and non-stationary signal [7], several studies used specific methods to transform or to decompose the complex signal which is the stabilogram into signals less complex and easier to handle and to extract parameters.
Standard Fourier measures, like mean power frequency (MPF), is used to observe the changes effected by the vision on the CoP dynamics [8]. The changes of standard Fourier measure which is the Fourier spectra of the stabilogram is quantified in the study [9].
The study [10] used information time-frequency based on wavelet analysis. It decomposes the orientation signal into wavelet approximation and wavelet detail; they study these signals to discriminate chronic ankle instability.
The wavelet analysis is used to decompose the stabilogram into approximation and detail signal; the energy content in each of these signals is studied to distinguish between elderly and young and display the effect of vision in the different timescales [11]. Although the importance of results deduced from standard Fourrier analysis, the analysis shows relatively large error bars and does’nt examine the CoP signal at the different timescale. While the wavelet analysis provides information regarding the several timescales that constitute the CoP signal and show less error bars [11].
The studies [1, 12, 13, 14] uses the Empirical Mode Decomposition (EMD) to decompose the non linear signal as stabilogram into the intrinsic mode functions (IMF). It is deduced that the trace of the Hilbert Huang Transformation (HHT) in the complex plane of each IMF has a circular form and that the area of the circle is an indicator of the postural stability [1, 12, 13]. It is also showed that this indicator is able to discriminate between elderly and control subjects [1]. This method is powerful to analyze nonstationary univariate and bivariate time series and is able to able to extract the oscillations in different adaptive time scales from the stabilogram [1].
In spite of interesting results provided by Wavelet analysis and EMD method, the components resulted from both methods don’t provide a real physical meaning. In this work, we used the mPCA technique to decompose the stabilogram into (trend, rambling, trembling) [13]. These components are less complex than the stabilogram and each of the components have a physical meaning and contains information characterizing the postural control dynamics. In this study, a special interest is given to the phase related to both trembling and rambling. From the phase we can extract important parameter such as the area of the circle in which 95% of the data points are located and the angular frequency.
The feature area describes the quality of equilibrium and allows discriminating between control and young groups. It displays also the effect of visual and proprioceptive entries, the direction and gender on the postural control.
This paper is organized as follows: the description of the platform and the experimental protocol are presented in section 2. The mPCA decomposition method and the analysis phase are presented in section 3.
In section 4, we described the parameters. Finally, our results and discussions are presented in section 5.
-
II. Materials and methods
The electromagnetic device is based on the use of pulsed magnetic fields. It consists of an antenna with three coils stuck on the earth and a receiver with also three coils that measures simultaneously the three components of electromagnetic signal sprung from the antenna. The device content also an electromagnetic sensor that must be placed on the mass center of subject and indicate the three-dimensional position and orientation of COP.
The coordination between the transmission and the reception part is ensured by the acquisition board linked to the PC [5] (Fig.1). The interface of the acquisition board manipulation and the calculations are performed usingMatlab.
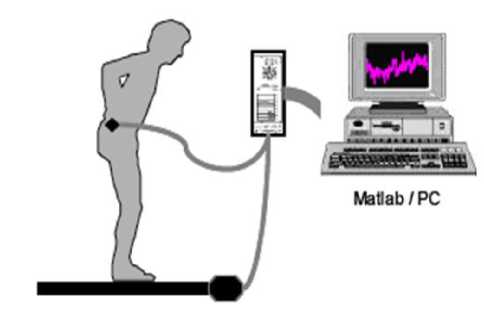
Figure 1. Electromagnetic platform [5]
Due to the use of the electromagnetic field to measures positions, the sensors used are oversensitive to the electromagnetic perturbation especially if metallic object or computers screens with cathodic tube intercept this field. So, the measures obtained present errors due to sensors response nature and the electromagnetic field distortion caused by the environment nature. Because of this distortion we have designed a special equipment calibration in order to correct the field deformation [6].
The calibration phase is fundamental to estimate and correct the error of measures caused by electromagnetic field distortion. This step, allow to collect stabilogram signal measures with a known minimal allowed error.
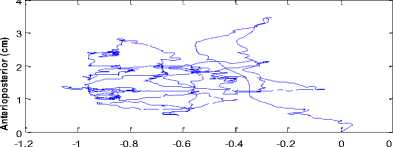
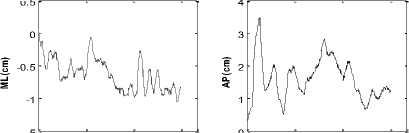
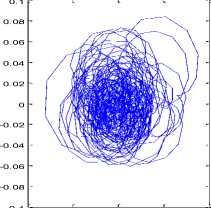
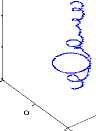
After calibration and correction phases, one can measure the postural stability in the horizontal plane with a known error. Therefore, the obtained stabilograms represent COP time series in mediolateral (ML) and anterioposterior (AP) directions [13] (Fig.2).
Mediolateral (cm)
(b)
(c)
-0 5
-1
time(s)
time(s)
-1.5
Figure 2. Displacement of the center of pressure in (a)the horizontal plane(b) mediolatéral (ML) direction and (c)Anteroposterior (AP) displacement
-
A. Subjects
Twenty five healthy volunteers (8 females and 17 males) participated in the stabilogram acquisition. Each subject provides his Information namely: name, age, height, weight. The subject’s ages vary between 19 years and 42 years; weights are between 52 and 105 kg and heights vary between 160cm and 192cm.
-
B. Experimental protocol
The experiments were performed with subjects placed onto the platform, standing upright with arms by their sides.
In order to display the influence of visual and proprioceptive entries on the postural stability, four types of measures are evaluated for every subject.
V The first measure is tested by keeping foot outspread and opened eyes fixing a point placed on the wall in front of the subject (FO_EO),
V The second measure is evaluated with tighten foot and opened eyes (FT_EO),
V The third measure is with outspread foot and closed eyes (FO_EC),
V The last is measured with tightened foot and closed eyes (FT_EC).
Each group of these four types of measures is gathered in a set and for each subject we extract multiple sets of constitutes a database. During 30 seconds of the recording process, subjects must respect the conditions listed previously by preventing any abnormal moving.
Each recorded signal is sampled at 60Hz. In fact, the frequency band corresponding to the human voluntary movements of limbs is located between 3 and 5 Hz, whereas, when considering involuntary trembling, the frequency band is located between 8 and 10 Hz.
-
III. Signal Decomposition
The stabilogram is regarded as a non-stationary signal having a complex structure. So, it can be considered as the result of a superposition of a set of signals having various properties.
These signal are easier to handle than the stabilogram that is a complex signal and unlike the other decomposition method, the component resulting have a physical meaning.
These signals can be differentiated by temporal and dimensional characteristics.
The mPCA decomposition, as it is developed in [5], is set up after two steps:
In a first time, we realized a first decomposition allowing the decomposition of the stabilogram into a determinist signal having slow fluctuations (trend + rambling) and a chaotic signal (trembling). This is realized by time estimation from the signal then a representation in the phase’s space and finally, a projection in the first principal axis.
Secondly, to separate the trend and rambling of the determinist signal resulting from the first decomposition, it was sufficient to search a polynomial approximation.
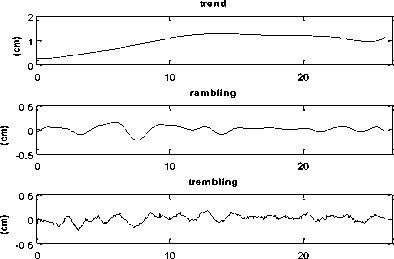
Consequently, the resulting is the decomposition of the signal into three distinct components, namely (Fig. 3):
-
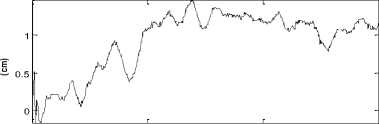
• Trend: the displacement of the principal segment of the considered body.
-
• Rambling around trend: characterized by a low frequency and a determinist oscillations,
-
• Trembling around rambling: this signal presents a complex structure having a chaotic nature.
signal
tim e (s )
Figure 3. Stabilogram decomposition
This decomposition can be either for ML or AP stabilogram and is insured by the projection into principle components to analyze and extract the most useful information from the postural signal.
-
A. Instantaneous phase estimation
For a given real signal s(t) we can consider an analytic signal defined as :
Z ( t ) = s ( t ) + i . h ( t ) ( 1 )
s(t) is the original signal and h(t) is the Hilbert transform of the signal s(t). It is defined as:
h ( t ) = 1 P . V + α s ( τ ) d τ (2)
π -α t -τ where P.V is the Cauchy principle value [12].
(b)
h(cm) -5 -2 s(cm)
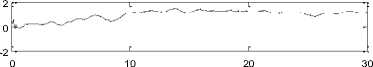
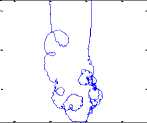
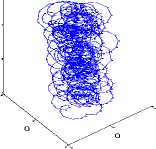
Figure 4. (a)Trace of a stabilogram s(t), (b) Trajectory in the complex plan (s,h ,t), (c) Projection in the plan (s,h)
(c)
(cm)
(a)
0 10 20 30
tim e (s)
As shown in figure.4, one can notice that the trajectory in the complex plan doesn’t show a unique rotation center but a multiplicity of centers. Consequently, the phase cannot be defined. Furthermore, the analytic signal can be expressed as:
Z ( t ) = a ( t ). e * ( t ) (3 )
Where a(t) is the amplitude of z(t) and ф ( t ) is the instantaneous phase defined as:
ф ( t ) = arctan(-^(-)) (4)
s ( t )
From the instantaneous phase we obtain instantaneous signal frequency f(t) defined as :
f ( t ) = ±
2 n dt the
It would appear that a(t) and ф(t) are mainly a local phenomenon, but computing a(t) and ф(t) requires the full signal. Hence, instantaneous phase and amplitude are actually global properties. In order to use this unique definition of instantaneous phase and frequency, we have to use a signal having a complex plan trajectory with a unique rotation center.
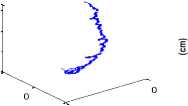
The mPCA decomposition allows us to decompose the stabilogram into various signals, including the trembling signal. The complex plan trajectory of the trembling (either rambling) highlights a unique rotation center (respectively Fig.5 and Fig .6).
This property is similar to that obtained for IMFs [1, 13]. Therefore, the trembling (either rambling) signal allows having a specific phase related to this component.
(a)
(b)
-0.1 -0.05 0 0.05 0.1
(cm)
Figure 5. (a)Trajectory in the complex plan (s,h ,t) and (b)projection
0.1
h(cm) —0.1 —o.i s (cm)
in the plan (s,h) related to trembling
-
IV. Parameter calculation
0.25
0.2
0.15
0.1
0.05
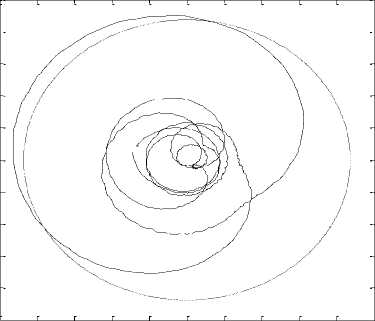
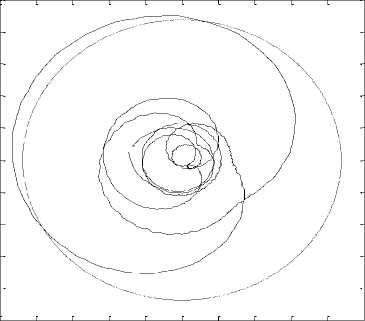
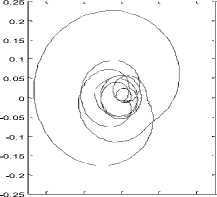
From the property of having a unique rotation center from the trembling and rambling trajectory, one can define a specific parameter that is the area of the circle in which 95% of the data points are located [1] (Fig.7).
-0.05
-0.1
-0.15
-0.2
-0.25
-
-0.25 -0.2 -0.15 -0.1 -0.05 0 0.05 0.1 0.15 0.2 0.25
0.25
0.2
0.15
0.1
0.05
(cm)
Figure 7. Trace of rambling’s projection in the plan (s, h)and area of the circle in which 95% of the data points are located
Based on the property of the unique rotation center, the trace of the instantaneous phase of trembling (or rambling) signal presents a linear regression (Fig.8).
-0.05
-0.1
-0.15
-0.2
-0.25
-
-0.25 -0.2 -0.15 -0.1 -0.05 0 0.05 0.1 0.15 0.2 0.25
0.5
(cm)
Figure 8. Trace of the instantaneous phase and linear regression of rambling
(a )
h ( cm )
-0.5 -0.5
0.5
-0.2 -0.1 0 0.1 0.2
(cm)
Figure 6. (a)Trajectory in the complex plan (s,h ,t) and (b)projection in the plan (s,h) related to rambling
s(cm)
The proper phase can be estimated from the trace by a linear regression. The slope of the regression presents the proper angular frequency associated to the trembling signal. So the average frequency can be calculated as the value of the linear regression slope divided by 2π. Generally we can define the trembling (or rambling) phase as:
Ф к ( t ) = ® k . t + F k ( t ) (6)
Where ^ is proper angular frequency and Fk ( t ) is the phase fluctuation.
The parameters, area of the circle in which 95% of the data points are located (Su) and the angular frequency (puls) are calculated for AP and ML directions, for the
four measures situations (FO_EO, FO_EC, FT_EO, FT_EC) and for both trembling and rambling. So for each COP signal, a total of 8 values are calculated: 4 parameters for AP direction (area of the circle related to trembling (Su_tr), area of the circle related to rambling (Su_ra), angular frequency related to trembling (puls_tr) and finally angular frequency related to rambling (puls_ra)) and the same 4 parameters for ML direction. So for every subject’s we calculated the mean of all stabilograms values for each parameter .
-
V. Results and discussions
The statistic analyses are performed by ANOVA tests. The results concerning the parameter angular frequency are unable to differentiate between subject groups, so, no further analyses are performed for angular frequency. The results performed for the parameter area highlight various effects of different aspects.
-
A. Visual entries effects
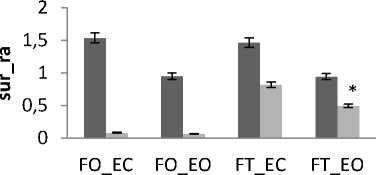
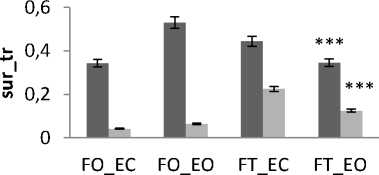
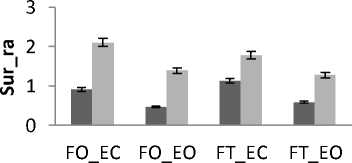
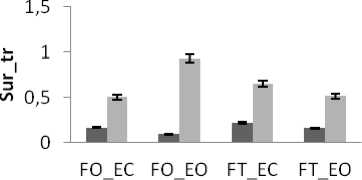
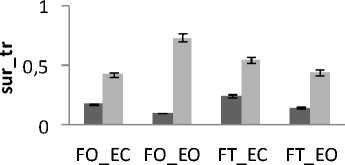
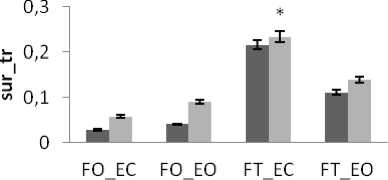
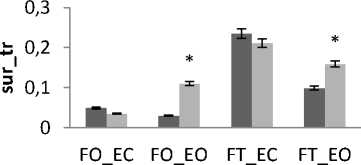
Independently of age and gender, there is a difference in area’s values between all subjects for both trembling and rambling for all situations for AP and ML (Fig.9). The areas values for both trembling and rambling (surf_tr and surf_ra) was greater for closed eyes (EC) than for opened eyes (EO) and this is available for both situations FO and FT and both directions ML and AP.
These increases in the values of surf_tr and surf_ra are indicative of degradation in the balance due to the effect of visual entry on postural stability. So we are less stable with opened eyes than with closed eyes. This finding agree with the studies [15, 16] showing that the postural stability is better with opened eyes than closed eyes according to the postural Romberg test. This is also in line with the study [17] who studied the parameter of auto-regressive (AR) model to display the role of visual input to postural control system, they find that the absence of vision information reflect alterations in the performance of maintaining postural control.
The effect of vision on the postural control is explained in previous study by the relationship between muscular activity and CoP displacement. It is hypothesized that visual input decreases the stiffness of the musculoskeletal system [18].
-
B. Proprioceptive entry effects
For both directions ML and AP and both visual conditions (EC or EO), the areas values for both trembling and rambling (surf_tr and surf_ra) was greater for outspread feet (FO) than for tighten feet (FT). This result display the effect of proprioceptive entry in the control of postural stability that is in accordance with human physiological nature: The postural stability is better maintained with outspread feet position than with tighten feet position. This is in agreement with the finding of the study [19] showing that average preferred foot position was 0.17 m between heel centers, with an angle of 14 degrees between the long axes of the feet and that foot placement influences stabilizing reactions. It is found also that the inner feet distance have a stabilizing effect [20]. This in is explained by the fact that the increase of the distance between feet serves the increase of support base, so this induced an improvement in orthostatic equilibrium.
Generally and as showed in the results (Fig.9), the greatest areas values for both directions are related to the situation (FT_EC). So, this situation corresponds to the worst situation to maintain postural equilibrium. The poorest areas values for both directions are related to the situation (FO_EO). It is the best situation to maintain equilibrium. The ANOVA applied shows significant differences between the 4 situations especially with rambling in the two directions ML and AP (Fig.9.b) (P <0.001).
-
C. Directional specificity effects
The results show that areas values in ML direction are greater than in AP direction (Fig.9). So, in AP direction, subjects can better control their stability as recall that the experimental conditions include that the subject stand upright and looking a visual target in front of him. So AP is the direction of his head and gaze. It is noticed so that the direction of head and gaze is the direction where body sways less. In fact, this is in line with the study [21] showing that the stabilizing effect of vision is present in the direction of stimulus observation which is the direction of gaze/head, irrespective of trunk observation. Similarly, the study [22] finds that fluctuations in the direction perpendicular to the target’s plane may grow reflecting weaker visual control of posture. It is showed that directional postural responses occur in the direction of either head and or gaze orientation during standing and walking [23]. So the position of head and eyes provides a viewer-centered frame of reference for the control of posture and locomotion.
In dead, if we look the areas values in AP direction, it is notable that with the situations of outspread feet (FO_EO and FO_EC) areas values are very poor. This reflects a high ability to maintain equilibrium in AP direction with outspread feet [19].
-
D. Age effects
The healthy subjects are divided into two groups according to their ages: control subject’s mean age is 22.5 ± 2. 5y and adult subject’s mean age is 34.5 ±7. 5y.
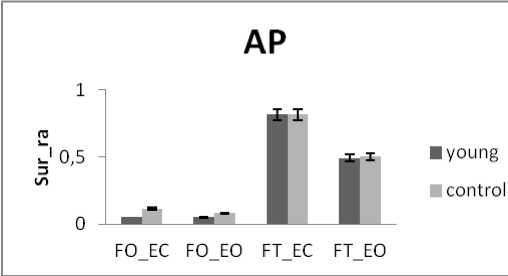
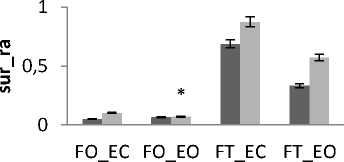
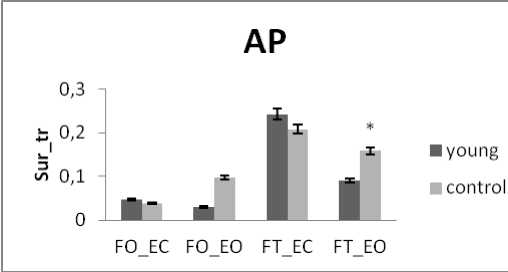
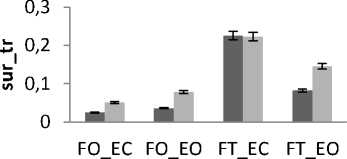
There is a significant difference in areas values between groups for rambling and trembling for all situations and for AP and ML (Fig.10). The areas are greater for control subjects than for young subjects (except two cases for trembling in AP with YF). These increases in the values of areas with age are indicative of impairment in the stability due to effect of age. This result is in agreement with previous studies showing that stability decreases with age: more aged less stable.
This is in line with the studies [4, 24] showing that there is impairment in postural stability due to aging but they suggest that it is after the age of 60 years that vision become more important and noticeable for postural stability. Similarly, the study [1], decomposing the stabilogram into IMFs by the EMD, studied the parameter circle using in this study to show that there is a less-well controlled posture for elderly. It is explained that the postural system is affected by several sensory systems (somatosensory, vestibular and visual) [4]. As aging is associated with degradation in the function of these factors, this causes impairment in the ability to maintain equilibrium. The study [25] explained that Aging is also associated with diminished muscle strength and mass; this is responsible of the degradation in maintaining stability for the elderly.
-
E. Gender effects
The healthy subjects are now divided into two groups according to their gender. Female subject’s (mean age is 24.5 ± 5.5y and males subject’s mean age is 31 ± 11y.
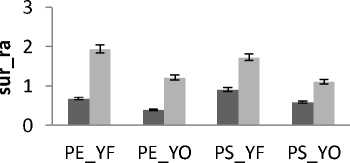
In all areas results there is a significant difference between female and male for rambling and trembling for all situations and for AP and ML (Fig.11). The areas are greater for male than for female. These increases in the values of areas indicate that female subjects are more stable than males. This is in agreement with the finding of several previous studies.
Is examine body-sway measurements of 60 subjects exposed to high energy intermittent noise are examined and this shows that men seem to sway more than women J Juntunen et al [26]. It is also found that men sway more than women [27].
It is suggested that the poorer stability of men compared to women is possibly due to their different anthropometric [28].
However, several studies failed to find stability relationship with gender [15, 29].
-
F. Anthropometric factors effects
It is known that body characteristics affect postural stability.
The study [30] showed that height and weight are identified as important factors affecting standing posture equilibrium and studied the body morphology characteristics, as global factor to display the effects on the stability equilibrium. It is display that the differences in body characteristics influenced the boundaries of individual postural stability, and this may affect the selection of motor strategies to maintain postural balance control [31]. The study [32] displays also that anthropometric factors affect stabilometric parameters. The basic factors from anthropometric body characteristics are the height, weight and foot size
-
1) Weight effects
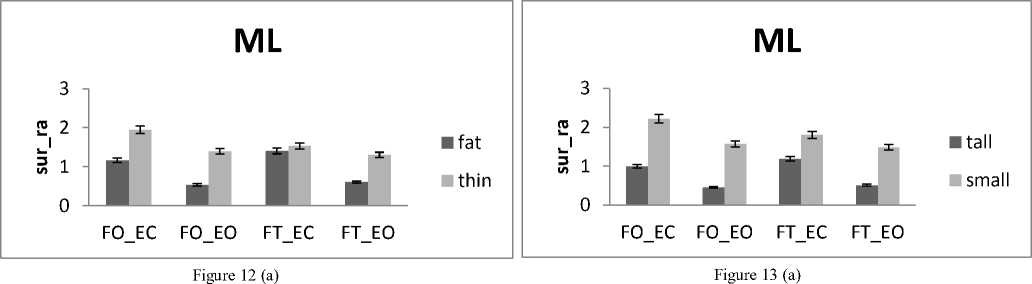
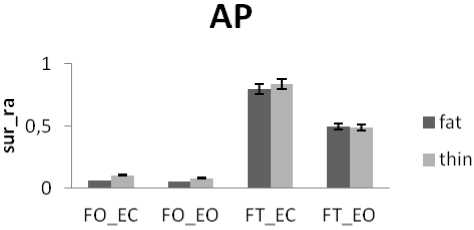
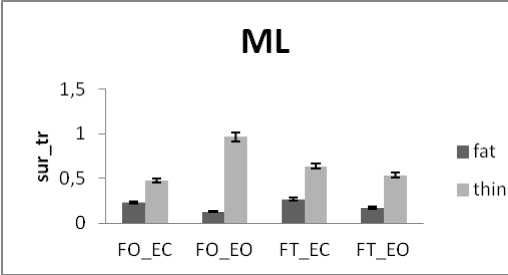
The subjects are now divided into groups according to their weight: Fat group (13 subjects with weight varying between 72 and 105 kg) and thin group (12 subjects with weight varying between 52 and 66 kg) noting that no subject is suffering from obesity. In all areas results there is a significant difference between thin and fat for rambling and trembling for all situations and for AP and ML (Fig.12).
The areas are greater for thin than for fat. These increases in the values of areas indicate that fat subjects are more stable than thin. This is in line with the study [33] finding that small body mass is associated with a poorer posture control. However, when the weight increase exceeds certain limits especially with obese subjects this is no longer available. So for obese person, a decrease in balance stability is strongly correlated to an increase in body weight [34].
-
2) Height effects
The healthy subjects are now divided into two groups according to their height: Tall group (14 subjects with height varying between 174 and 192 cm) and small group (11 subjects with height varying between 160 and 172cm). In all areas results there is a significant difference between female and male for rambling and trembling for all situations and for AP and ML (Fig.13).
The areas are greater for small than for tall. These increases in the values of areas indicate that tall subjects are more stable than small. This is in agreement with the finding of the study [35] displaying that short body height and knee height is one reason for the increased risk for falls and so a reason of balance degradation. Similarly, it is suggested that the largest body displacement amplitude is for small subjects [36].
This finding can be explained by the fact that the support surface size or foot size is related to height: an increase in height is associated generally to increase in the support surface area and consequently, this causes an increase in the ability to maintain stability control.
all subjects
(a)
all subjects
(b)
Figure 9. The average mean values of surface for all subjects for the 4 situations (FO_EO, FO_EC, FT_EO, FT_EC) for AP and ML displacement ; (a) for rambling ; (b) for trembling. Data are mean and 95% confidence intervals.The asterisk denotes significant differences * P<0.05; ** P<0.01; *** P<0.001 between the 4 situations for the same direction.
ML
ML
-
■ young
-
■ control
-
■ female
-
■ male
Figure 10. (a)
Figure 11 (a)
AP
-
■ female
-
■ male
Figure 10. (b)
Figure 11. (b)
ML
ML
■ young
control
■ female
■ male
Figure 11. (c)
Figure 10. (c)
AP
-
■ female
■ male
Figure 10. (d)
Figure 11. (d)
Figure 10. The average mean values of surface for young and control subjects for the 4 situations (FO_EO, FO_EC, FT_EO, FT_EC) for (a) rambling in ML displacement ; (b) rambling in AP displacement ; (c) trembling in ML displacement and (d) trembling in AP displacement.
Data are mean and 95% confidence intervals. The asterisk denotes significant differences * P<0.05; ** P<0.01; *** P<0.001 between the young and control
Figure 11. The average mean values of surface for female and male subjects for the 4 situations (FO_EO, FO_EC, FT_EO, FT_EC) for (a) rambling in ML displacement ; (b) rambling in AP displacement ; (c) trembling in ML displacement and (d) trembling in AP displacement.
Data are mean and 95% confidence intervals. The asterisk denotes significant differences * P<0.05; ** P<0.01; *** P<0.001 between the female and male
AP
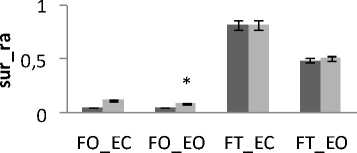
Figure 13 (b)
Figure 12 (b)
ML
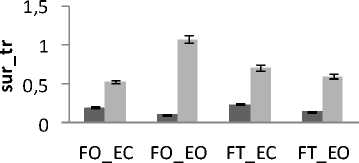
Figure 13 (c)
■ tall
■ small
Figure 12 (c)
АР
AP
-
■ fat
-
■ thin
-
■ tall
-
■ small
Figure 12 (d)
Figure 13 (d)
Figure 12. The average mean values of surface for fat and thin subjects for the 4 situations (FO_EO, FO_EC, FT_EO, FT_EC) for (a) rambling in ML displacement ; (b) rambling in AP displacement ; (c) trembling in ML displacement and (d) trembling in AP displacement. Data are mean and 95% confidence intervals. The asterisk denotes significant differences * P<0.05; ** P<0.01; *** P<0.001 between the fat and thin
Figure 13. The average mean values of surface for tall and small subjects for the 4 situations (FO_EO, FO_EC, FT_EO, FT_EC) for (a) rambling in ML displacement ; (b) rambling in AP displacement ; (c) trembling in ML displacement and (d) trembling in AP displacement.
Data are mean and 95% confidence intervals. The asterisk denotes significant differences * P<0.05; ** P<0.01; *** P<0.001 between the tall and small
-
VI. conclusion
In this study, we used the mPCA decomposition to extract from the stabilogram three components: trend rambling and trembling.
The study of the trajectories in the complex plan of rambling and trembling displays that they both admit a unique rotation center so that the original signal presents multitude centers.
The existence of this unique center of rotation allows defining a parameter corresponding to the surface containing 95% of the data points are located.
This parameter is considered as an efficient informer of the postural equilibrium; it shows the impact of visual, proprioceptive and directional entries, age, gender, anthropometry inputs in the context of postural balance maintaining.
It appears that the mPCA method associated to the extraction of phase information related to rambling and trembling components seems to be very promising in postural analysis. Especially since, it decomposes the complex signal stabilogram into less complex signals and easier to handle and unlike other decomposition method, the resulting components have physical meaning.
References Stabilogram mPCA Decomposition and Effects Analysis of Several Entries on The Postural Stability
- H Amoud, H Snoussi, .D Hewson and J Duchêne, Univariate and Bivariate Empirical Mode Decomposition for Postural Stability Analysis, accepted to EURASIP Journal on Advances in Signal. Processing, 2008.
- M Hytonen, I Pyykko, H Aalto H, J Starck, Postural control and age, Acta Otolaryngol (Stockh) 113: 119-122, 1993.
- P.M Gagey, B Weber, Entrées du système postural fin, ED. MASSON,1995.
- RA Du Pasquier, Y Blanc, M Sinnreich, T Landis, P Burkhard, FJG Vingerhoets: The effect of aging on postural stability: a cross sectional and longitudinal study. Clin Neurophysiol 33: 213-218, 2003.
- R Fournier, E Deléchelle, and J Lemoine, Décomposition et analyse du signal stabilométrique, 18e colloque GRETSI'01, Toulouse, 10-13, 2001.
- R Fournier, E Deléchelle, and J Lemoine, Méthodes de calibrage d'un système électromagnétique pour l'étudeet l'évaluation de mesure posturale, Revue I.T.B.M.,R.B.M. 2002 ; 23 : 303-315. Editions scientifiques et médicales ELSEVIER SAS.
- J.P Carroll and W Freedman., Nonstationary properties of postural sway, Journal of Biomechanics, vol. 26, no. 4-5, pp.409–416, 1993.
- JR Davis, AD Campbell, AL Adkin, MG Carpenter, The relationship between fear of falling and human postural control, Gait Posture 29:275–279, 2009.
- P Perrin, D Deviterne, F Hugel, C Perrot, Judo, better than dance, develops sensorimotor adaptabilities involved in balance control. Gait Posture 15:187–194, 2002.
- A.Martínez-Ramírez , P. Lecumberri , M. Gómez, M. Izquierdo, Wavelet analysis based on time–frequency information discriminate chronic ankle instability, Clinical Biomechanics, 25 : 256–264, 2010.
- J.R Chagdes, S Rietdyk, M Hadded Jeff, N Zelaznik Howard, A Raman, K Rhea Christopher , A Silver Tobin., Multiple timescales in postural dynamics associated with vision and a secondary task are revealed by wavelet analysis, Experimental brain research, vol. 197, no3, pp. 297-310, 2009.
- H Amoud, H Snoussi, D .Hewson and J Duchêne., Hilbert-Huang Transformation: Application to Postural Stability Analysis, IEEE EMBC, Lyon, Aug. 2007.
- R Fournier, Thèse de doctorat de l'université Paris XII, Analyse stochastique modale du signal stabilométrique. Application à l'étude de l'équilibre chez l'Homme. Octobre 2002.
- N.E Huang, Z Shen, SR Long, M.L.C., Shih, H.H., Q.N Zheng, Yen, N.C., Tung, C.C. and Liu, H.H. The empirical mode decomposition and the Hilbert spectrum for nonlinear and non-stationary time series analysis, Proc. Roy. Soc. LOND A MAT, 454, pp. 903-995, 1998.
- FO Black, C Wall, H Rockette and R Kitch, Normal subject postural sway during the Romberg Test, Am J Otolaryngol, 3: 309–318. 1982.
- TT Le , Z Kapoula, Role of ocular convergence in the Romberg quotient, Gait and posture ISSN 0966-6362, vol. 27, no3, pp. 493-500, 2008.
- H Tanaka, M Nakashizuka, T Uetake and T Itoh, The effect of visual input on postural control mechanisms: an analysis of center-of-pressure trajectories using the auto regressive model. J.Human Ergol., 29: 25-50, 2000.
- JJ Collins, Cj De Luca, The effects of visual input on open-loop and closed-loop postural control mechanisms. Exp Brain Res.; 103: 151-163, 1995.
- WE McIlroy, BE Maki, Preferred placement of the feet during quiet stance: development of a standardized foot placement for balance testing, .Clin Biomech, 12:66–70, 1997.
- A Mouzat, M Dabonneville, D Roux, N Borges and P Bertrand, Position des pieds et paramètres
- stabilométriques, Staps, 67, p.59-69, 2005.
- A Berencsi , M Ishihara, K Imanaka ,The functional role of central and peripheral vision in the control of posture, Human Movement Science 2, 689–709, 2005.
- R Balasubramaniam , M.A Riley, M.T Turvey, Specificity of postural sway to the demands of a precision task, Gait and Posture 11, 12–24, 2000.
- Y Ivanenko , R Grasso and F Lacquaniti, Effect of gaze on postural responses to neck proprioceptive and vestibular stimulation in humans. Journal of Physiology , 519.1, pp. 301—314, 1999.
- D. Abrahamova, F. Hlavacka. Age-Related Changes of Human Balance during Quiet Stance. Physiol. Res. 57: 957-964, 2008.
- MM Porter, AA Vandervoort, J Lexell: Aging of human muscle: structure, function and adaptability. Scand J Med Sci Sports 5: 129-142, 1995.
- J Juntunen , J Ylikoski, M Ojala, E Matikainen, M Ylikoski and E Vaheri, Postural body sway and exposure to high-energy impulse noise. Lancet 11: 261-264, 1987.
- M Ojala, E Matikainen and J Juntunen, Posturography and the dizzy patient: a neurological study of 133 patients. Acta Neurol Scand 80:118–122, 1989.
- TL Kinney LaPier, S Liddle and C Bain, A comparison of static and dynamic standing balance in older men versus women. Physiotherapy Canada 49: 207–213, 1997.
- PA Hageman, JM Leibowitz, D Blanke, Age and gender effects on postural control measures, Arch Phys Med Rehabil, 76:961-965, 1995
- P Allard, ML Nault, S Hinse, R LeBlanc, H Labelle, Relationshipbetween morphologic somatotypes and standing posture equilibrium. Ann Hum Biol ;28:624–33, 2001.
- MH Woollacott, A Shumway-Cook, Changes in posture control across the life span- A systems approach. Phys Ther 70: 799-807, 1990.
- L Chiari, L Rocchi, A Capello, Stabilometric parameters are affected by anthropometry and foot placement. Clin Biomech.,17:666-677, 2002.
- P Era, M Schroll, H Ytting, I Gause-Nilsson, E Heikkinen & B Steen, Postural balance and its sensory – motor correlates in 75-year-old men and women: A cross-national comparative study. J Gerontol: Medical Sciences 51A: M53-M63, 1996.
- O Hue, M Simoneau, J Marcotte, F Berrigan, J Doré, P Marceau, S Marceau, et al. Body weight is a strong predictor of postural stability. Gait & Posture, 26(1), 32-38, 2007.
- JW Davis, PD Ross, MC Nevitt, RD Wasnich, Risk factors for falls and for serious injuries on falling among older Japanese women in Havaii. J Am Geriatr Soc 47: 792-798, 1999.
- W Berger, M Trippel, M Discher, V Dietz, Influence of subjects height on the stabilization of posture. Acta Otolaryngol (Stock);112:22–30, 1992.
