Статистические исследования солнечных вспышек малой мощности. Распределения вспышек по площади, яркости и баллам
Автор: Боровик А.В., Жданов А.А.
Журнал: Солнечно-земная физика @solnechno-zemnaya-fizika
Статья в выпуске: 1 т.3, 2017 года.
Бесплатный доступ
Создана электронная база данных для 123801 солнечных вспышек, произошедших на Солнце с 1972 по 2010 гг. Основу составили каталоги Solar Geophysical Data (SGD) и квартального бюллетеня (Quarterly Bulletin on Solar Activity). С помощью разработанного пакета программ проведена предварительная статистическая обработка данных. Первые результаты позволили выявить ряд новых особенностей в распределении параметров солнечных вспышек, отличных от полученных ранее. Установлено, что более 90 % всех происходящих на Солнце вспышек имеют малую мощность. Самый многочисленный класс составляют вспышки балла SF (64 %). Вспышечная активность показывает хорошо выраженную цикличность и высокую корреляцию с числами Вольфа. Самые высокие коэффициенты корреляции имеют вспышки классов площади S и 1. Существует также высокая корреляция между отдельными классами вспышек: S и 1, 1 и (2-4). Полученные ранее [Mitra et al., 1972] результаты, свидетельствующие о превалировании на Солнце вспышек балла SN (47 %) и существовании значимых пиков в распределении для вспышек баллов SN и 1N, не подтвердились. Распределение числа солнечных вспышек с ростом оптического балла имеет плавный спад без существенных отклонений. С ростом оптического балла происходит постепенное перераспределение вспышек в сторону увеличения класса яркости. Большее число вспышек баллов SN и 1N, присутствующее на распределениях [Mitra et al., 1972], по всей вероятности, связано с недостаточной статистикой.
Солнечная активность, вспышки
Короткий адрес: https://sciup.org/142103630
IDR: 142103630 | УДК: 523.98 | DOI: 10.12737/22486
Текст научной статьи Статистические исследования солнечных вспышек малой мощности. Распределения вспышек по площади, яркости и баллам
Spatial and temporal parameters of solar flares in the optical wavelength range were studied in detail as early as in years of foundation of the international flare patrol, during extensive research into global geophysical processes under IGY programs. Observations were made in the Нα, H, and K CaII lines and to a lesser extent in other Balmer lines. Patrol observation was largely carried out in the Нα line (λ=6563 Å). Most stations employed devices and instruments with different optical characteristics: spectroheliographs (spectrohelioscopes), Lyot filters with a passband from 0.5 to 0.75 Å. Not all stations used automated filming and standardized measurement methods.
The first, introduced in 1956, international classification divided solar flares by classes, depending on the area of a chromospheric region covered by a flare. In 1966, a new classification was established, under which the flare importance was determined from the total energy W , emitted in the Нα line:
W=S0It, where S0 is the flare area, corrected for foreshortening at the moment of maximum brightness; I is the intensity; t is the duration.
According to a new optical classification, flares fell into five classes: S, 1, 2, 3, 4 (Table 1). The flare area was expressed in square degrees (sq. deg), parts per million of solar disk (pmd) or parts per million of hemisphere (pmh). In the disk center, 1 sq. deg=97 pmd.=48.5 pmh. Each area class was subdivided into three brightness classes: F (faint flares), N (normal), and B (bright). This classification has been widely accepted up to now.
Table 1
Classification of solar flares by observations in the Нα line
|
Intensity |
Area, sq. deg. |
||||
|
≤ 2.0 |
2.1–5.1 |
5.2–12.4 |
12.5–24.7 |
> 24.7 |
|
|
Faint (F) |
S |
1 |
2 |
3 |
4 |
|
Normal (N) |
S |
1 |
2 |
3 |
4 |
|
Bright (B) |
S |
1 |
2 |
3 |
4 |
Solar flares of importance 2B and higher are generally geoeffective, especially if accompanied by type II and IV radio bursts. Many geophysical phenomena are also conditioned by flare X-rays. X-ray flare importance is determined from direct measurements of the maximum flux in a range 1–8 Å aboard GOES satellites [Sotnikova, 2010].
In processing compositional data from the international flare patrol, researchers encountered a great number of difficulties [Warwik, 1965; Smith, Smith, 1966; Kopetskaya, Kopetsky, 1971; Ward et al., 1973]. Because of different approaches and methods, differences in areas reached 100% in 30 % of cases and about 500 % in 5 % of cases [Rossada 1977]. This was due to the fact that some stations determined the flare area at the level of plage brightness, while others took into account only the brightest areas. Errors also occurred in correcting the area for foreshortening:
S0=Smessec θ, where S0 is the corrected area; Smes is the area measured at the moment of maximum flare brightness; θ is the geocentric angle between the solar disk center and the flare. Since flares are not flat formations, this formula could be used up to θ=65°. After 65°, the correction became unreliable, especially for small flares. For flares over 2 sq. deg. in area, calculations up to θ≈72° were made by the formula
S0/Smes=(cos θ+ksin θ), where k=0.2 (the coefficient increases with Smes, reaching 0.5 for large flares). To improve the reliability of calculations, plots of flares that occurred with the same frequency in the center and on the edge of the solar disk, as well as other criteria were leveraged too.
The result of the determination of flare intensity depended crucially on spectral purity of a monochromator: the ratio of central wavelength to passband width at the 1 / 2 intensity level. At that time, a desired spectroscopic purity was provided by spectrohelioscopes (spectroheliographs) and birefringent filters (BF). The latter gave high temporal resolution, and due to their small dimensions and ease of operation they were most often used for patrol observations. In these filters, the flare intensity substantially depended on the angle of inclination of the filter to the telescope axis, lineshifter position, as well as on the passband contour. With a passband of 0.5 Å, the flare intensity was approximately by 20 % higher than that with 0.7 Å [Abramenko et al., 1960]. Flare intensity measurements at the stations agreed well provided that image scales, passband form and width coincided. In other cases, correction coefficients (station equation) were introduced.
Besides errors introduced by instruments, photometry and measuring techniques, a significant role in determining flare parameters was played by the subjective factor. The light curve of a flare is known to have a sharp increase and gradual decrease. The onset of a flare is determined with high confidence. It is rather difficult to define when the flare reaches its maximum brightness or ends completely: some areas fade quickly, others continue to “burn” for a long time. As a result, there were large differences in determining flare duration at different stations.
Over the past two decades, the solar astronomy instrumentation has well advanced. New telescopes were put into operation, instrumental resolution was improved, and measurement efficiency and accuracy increased significantly. New, large CCD-cameras (4 megapixels and more) used in astronomy stimulated observations in the Нα line. Since 1996, these observations have been carried out in the Big Bear Observatory (Big Bear, USA) and in the Hiraiso Solar Terrestrial Research Center (Japan). The CCD-cameras in their characteristics are vastly superior to photodetectors: they have a large dynamic range of signal amplitude, high photometric accuracy, small exposure, and allow real-time digitalization of information, its transfer and processing via modern computer systems.
The distribution of solar flares by area, brightness, and importance in the optical wavelength range was most thoroughly studied in [Mitra et al., 1972]. The findings are given in [Altyntsev et al., 1982]. Then, a similar analysis was made for individual flare classes [Temmer et al., 2001]. Since no detailed research has been done in this area over the past few decades, we set a goal of clarifying statistical characteristics of solar flares, using data from the international flare patrol for the last three solar cycles (21–23).
DATABASE
Extensive information about events that occur on the Sun is held in archives of national and foreign observatories: CAO Solar Data Bulletin for 1958–1995, IZMIRAN databases (flares for solar cycles 23 and 24 with the X-ray importance M1-X>17.5), catalogs of flares with long (over 4 hours) attenuation of soft X-rays [Antalova 1987], catalogs of large proton events, etc. In the optical wavelength range, the most complete databases of solar flares are catalogs of Solar Geophysical Data (SGD) and Quarterly Bulletin on Solar Activity. According to the modern flare classification, SGD provides data obtained from 1975 to 2010; the Quarterly Bulletin, from 1972 to 1989. To perform a statistical analysis of the largest number of flares and reduce the effect of data irregularity, we have supplemented SGD to 1972 with flares from the Quarterly Bulletin.
The vast majority of reports (66.6%) in SGD catalogs and Quarterly Bulletin on Solar Activity have been produced by four stations (Figure 1):
Holloman Solar Observatory (HOLL), Air Force Base, New Mexico, USA;
Learmonth Solar Observatory (LEAR), Australia;
Ramey Solar Observatory (RAMY), Puerto Rico;
Rothney Astrophysical Observatory (CULG), Canada.
In the initial phase of the study, observations from all the stations are used. The data were processed by a specially designed software package. We rectified errors, misprints, inaccuracies found in the catalogs. Duplication of the same events was eliminated. We accounted for cases when the stations did not report on the area class, brightness class, time of flare onset, maximum, end, etc. As a result, we created an electronic database containing 123 801 flares, 110 778 of which are low-power, 11280 have area class 1, and 1743 have class 2 and higher.
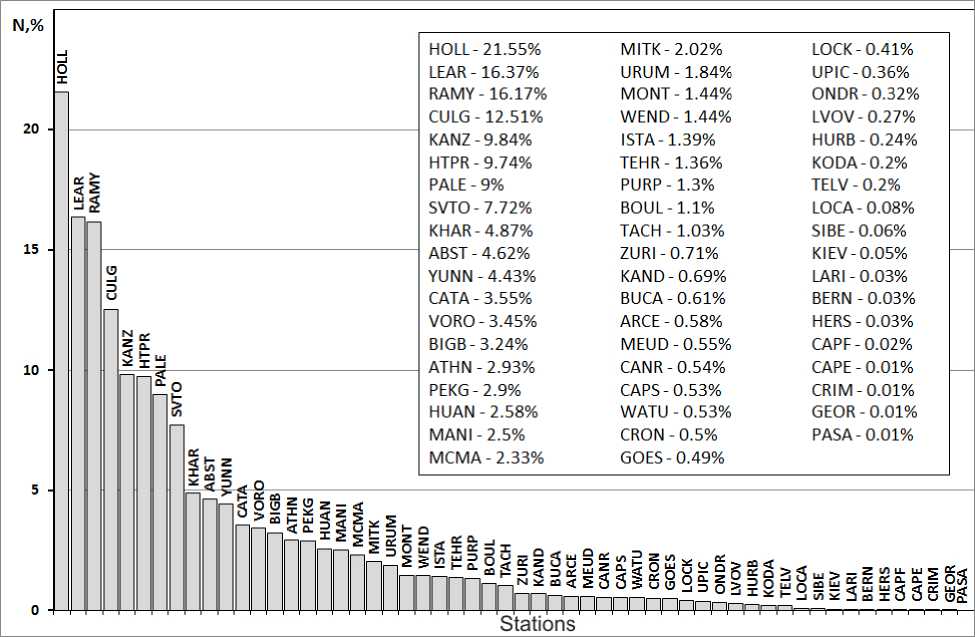
Figure 1. Distribution of solar flares by stations (in percent)
DISTRIBUTION OF S, 1, 2–4 SOLAR FLARES IN SOLAR CYCLES 21-23
Figure 2 shows the distribution of solar flares by months from 1972 to 2010.
Table 2 and Figures 3–5 provide insight into the distribution of S, 1, and 2–4 flares in solar cycles 21–23.
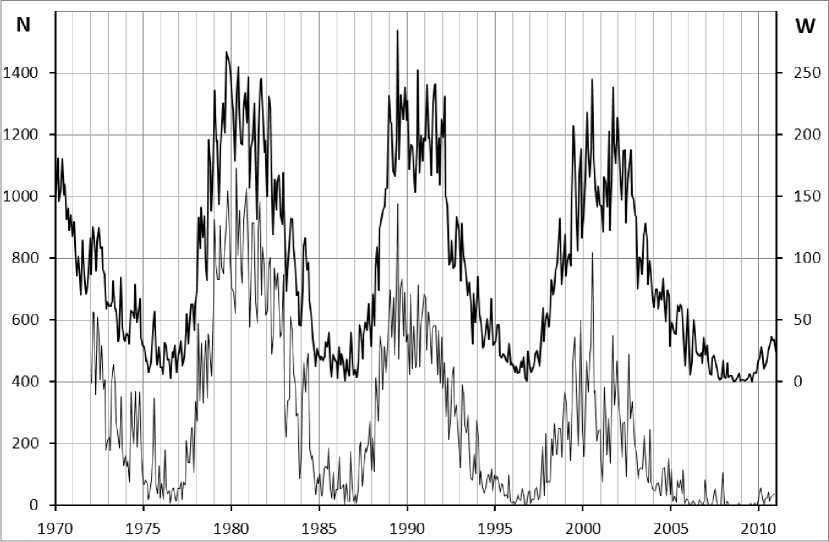
Figure 2. Distribution of solar flares by months (1972–2010): N is the number of flares. The top plot shows Wolf numbers W
Table 2
|
cycle 21 |
cycle 22 |
cycle 23 |
|
|
class S |
46 945 |
31 833 |
20 032 |
|
class 1 |
5526 |
3331 |
1666 |
|
Class (2–4) |
696 |
565 |
410 |
|
Σ |
53 167 |
35 729 |
22 108 |
The most active with respect to the number of solar flares was solar cycle 21. The distributions and data in the table suggest that flares of all the classes reveal a well-defined cyclicity and high correlation with Wolf numbers W . The correlation coefficients are given in Table. 3.
Table 3
|
cycle 21 |
cycle 22 |
cycle 23 |
1972–2010. |
|
|
W ↔S |
0.96 |
0.94 |
0.89 |
0.89 |
|
W ↔1 |
0.90 |
0.90 |
0.83 |
0.83 |
|
W ↔(2–4) |
0.77 |
0.77 |
0.67 |
0.76 |
|
S↔1 |
0.90 |
0.92 |
0.90 |
0.91 |
|
S↔(2–4) |
0.76 |
0.76 |
0.75 |
0.74 |
|
1↔(2–4) |
0.87 |
0.86 |
0.82 |
0.83 |
Class S and 1 flares have the highest correlation coefficients. There is also a high correlation between individual flare classes: S↔1 and 1↔(2–4).
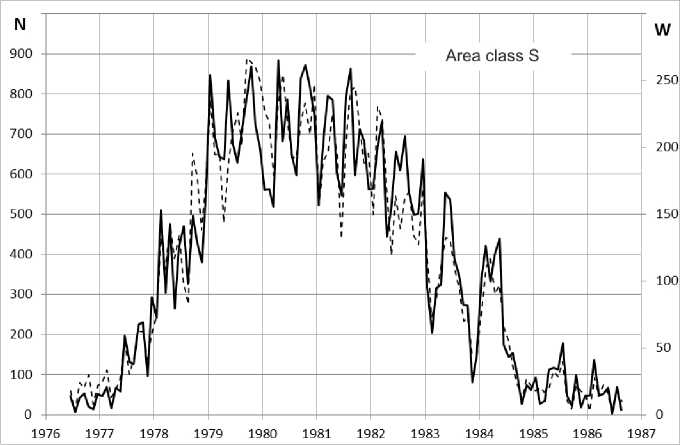
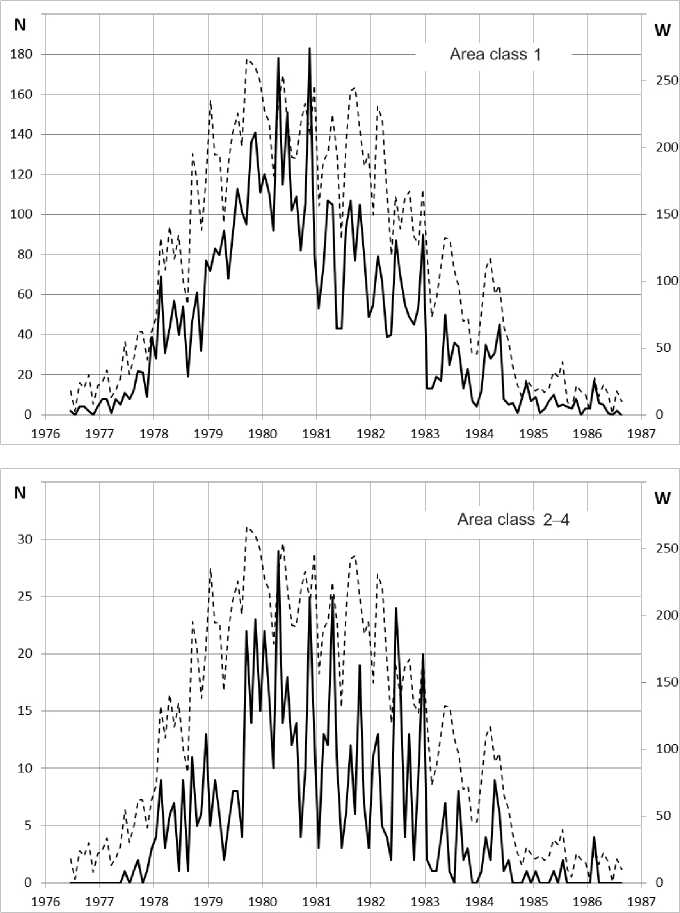
Figure 3. Distribution of S, 1, 2–4 flares by months in solar cycle 21 (June 1976 – September 1986). The dashed line indicates Wolf numbers W
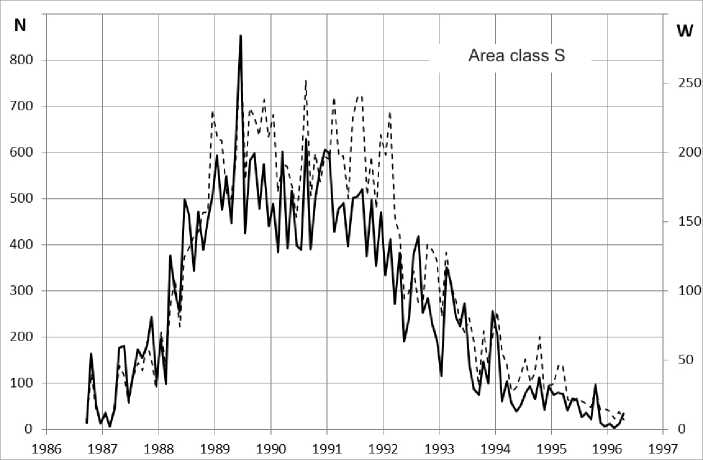
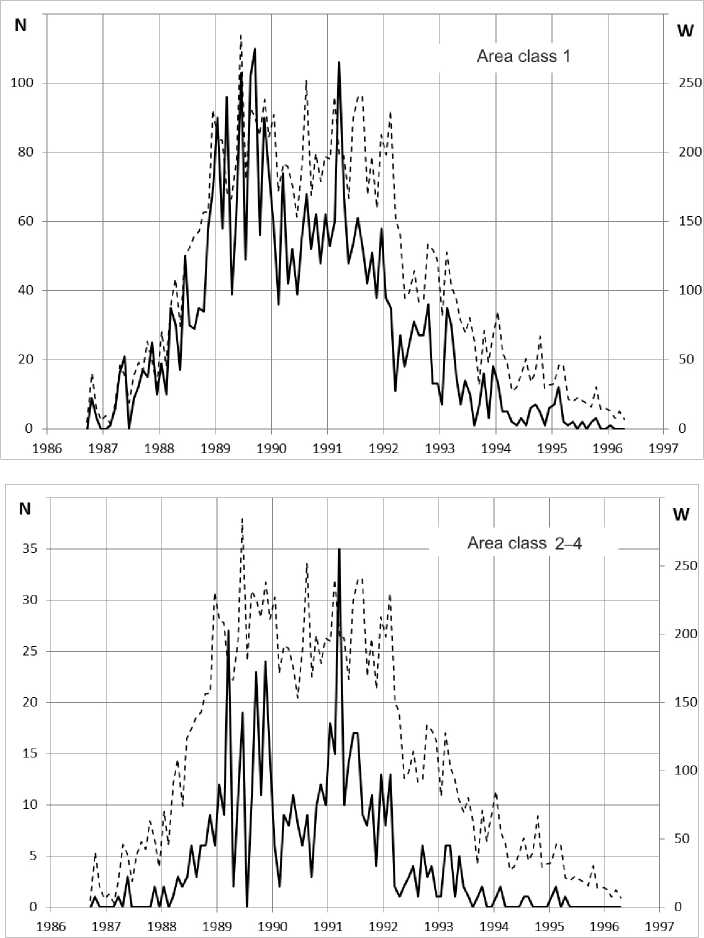
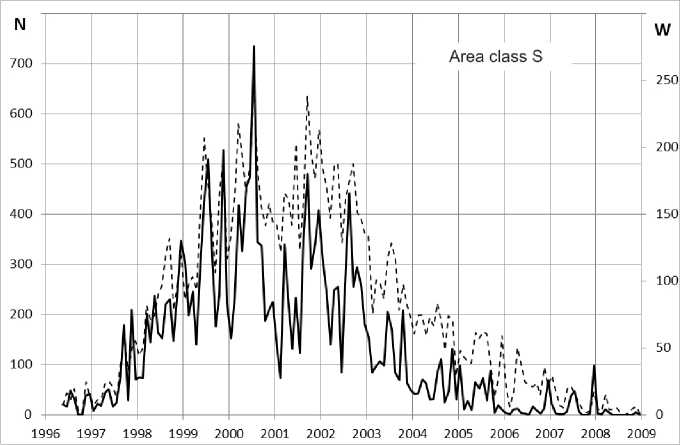
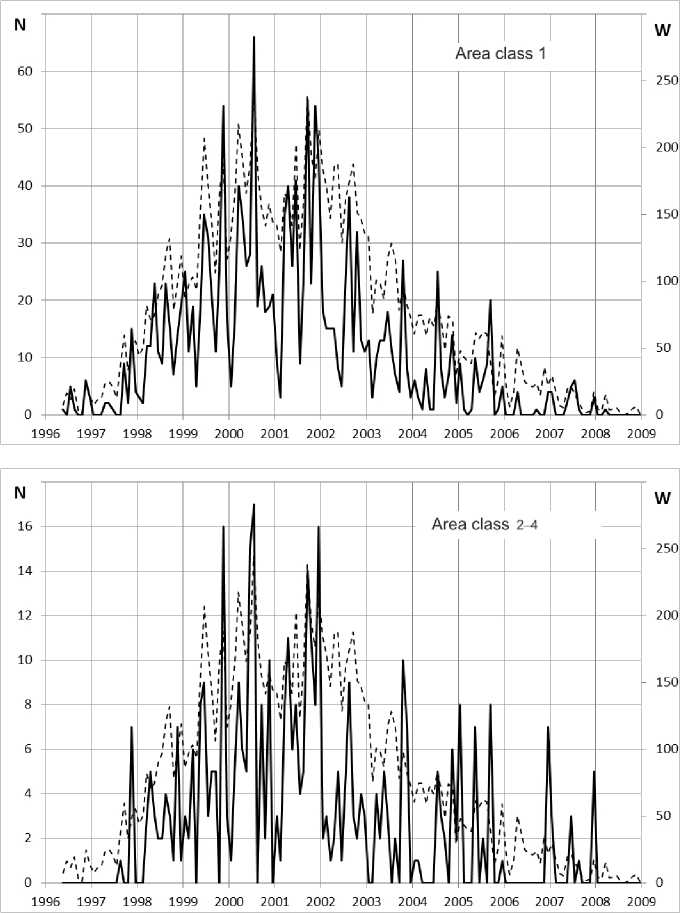
Figure 5 . Distribution of S, 1, 2–4 solar flares by months in solar cycle 23 (May 1996 – January 2009)
AREA DISTRIBUTION OF SOLAR FLARES
To study statistical characteristics of solar flares, data have been rigorously selected. Because of possible errors in determining the area class near the edge of the solar disk, we excluded S and 1 solar flares that occurred 65° farther from the central meridian from the database. Solar flares of larger area classes (2, 3, and 4) were not left out. Presumably it is not difficult to determine the area class for them. We also excluded the solar flares that had poor quality images (in SGD, the flares are marked with number 1 on three-point scale), and the flares whose parameters were evaluated visually.
In SGD catalogs, all reports on the same flare are generally combined into separate groups with the same number. At the beginning of each group, the most probable flare parameters obtained by averaging data from all the stations, included in the group, are presented (see the description of SGD tables).
There were about 40 thousands of such groups for the period under study. We have abandoned the use of generalized data. In the groups, the same selection criteria as for all flares were employed. Of the remaining stations, preference was given to the station that was ranked higher in the number of reports (Figure 1). As a result of the selection, the total number of flares is 98 225, 88 518 flares are class S, 8012 are class 1, 1509 flares are class 2, and 186 flares are classes 3 and 4 (Table 4).
Table 4
|
F |
N |
B |
Σ |
|
|
S |
62 814 |
21 354 |
4350 |
88 518 |
|
1 |
2591 |
3569 |
1852 |
8012 |
|
2 |
220 |
598 |
691 |
1509 |
|
3–4 |
17 |
36 |
133 |
186 |
|
Σ |
65 642 |
25 557 |
7026 |
98 225 |
Area distributions of flares are shown in Tables 4 and 5. In Table 5, the Roman numeral I marks the results obtained in [Mitra et al., 1972] for 8230 flares; II, the results obtained in [Temmer et al., 2001] from SGD data for 1975–1999 for S, 1, and >1 flares; III, our own results (shown in bold in figures). In Figure 6 and in all subsequent figures, the distributions derived in [Mitra et al., 1972] are indicated by a dashed line; data acquired in [Temmer et al., 2001] are bracketed and in some figures are shown by a thin line.
Table 5
|
cd "о cd |
Frequency of occurrence with respect to brightness classes, % |
Σ, % |
||||||||||
|
F |
N |
B |
||||||||||
|
I |
II |
III |
I |
II |
III |
I |
II |
III |
I |
II |
III |
|
|
S |
27.3 |
59.30 |
63.95 |
47.4 |
26.15 |
21.74 |
7.7 |
3.87 |
4.43 |
82.4 |
89.32 |
90.12 |
|
1 |
2.3 |
2.35 |
2.64 |
9.7 |
5.32 |
3.63 |
3.7 |
1.84 |
1.89 |
15.7 |
9.52 |
8.16 |
|
2 |
0.1 |
0.09 |
0.22 |
0.7 |
0.50 |
0.61 |
1 |
0.57 |
0.70 |
1.8 |
1.16 |
1.54 |
|
3–4 |
– |
0.02 |
0.02 |
0.04 |
0.11 |
0.14 |
0.1 |
0.19 |
||||
|
Σ, % |
29.7 |
61.74 |
66.83 |
57.8 |
31.97 |
26.02 |
12.5 |
6.29 |
7.15 |
|||
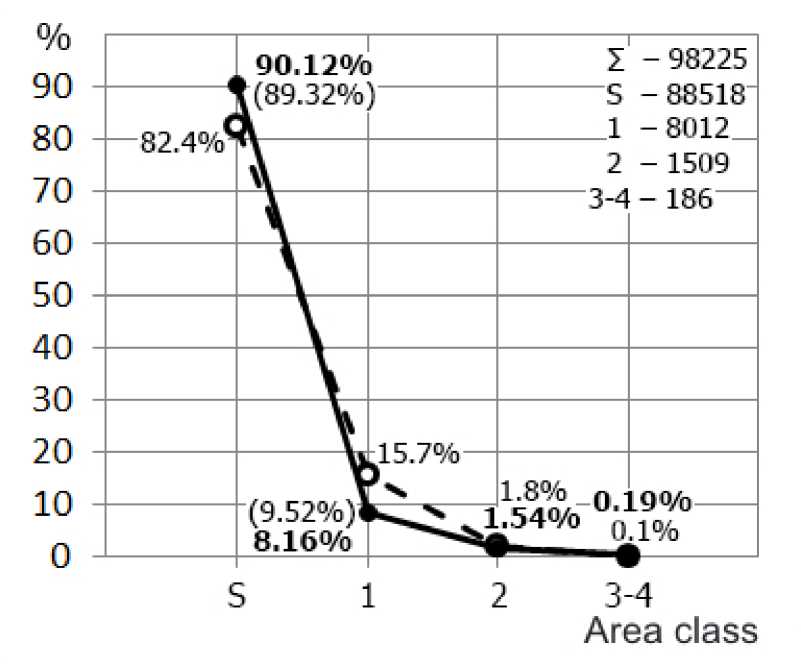
Figure 6. Area distribution of solar flares
The results indicate that S flares make up the vast majority (90.1%) of the total number of flares (98 225). This is 7.7 % higher than the value obtained in [Mitra et al., 1972] and almost coincides with the data acquired in [Tem-mer et al., 2001]. The number of class 1 flares is 7.5 % smaller than in [Mitra et al., 1972]; class 2 ones, 0.3 % smaller, and classes 3 and 4, 0.09 % larger. Compared to [Temmer et al., 2001] for the class 1 flares, the result is 1.4% lower. The ratios between individual area classes with respect to the number of flares are as follows: N S / N 1 =11.0; N S / N 2 =58.7; N S / N 3–4 =475.9; N 1 / N 2 =5.3; N 1 / N 3–4 =43.1; N 2 / N 3–4 =8.1.
The ratios have been obtained by dividing the number of flares of one class by the number of flares of another class (Table 4).
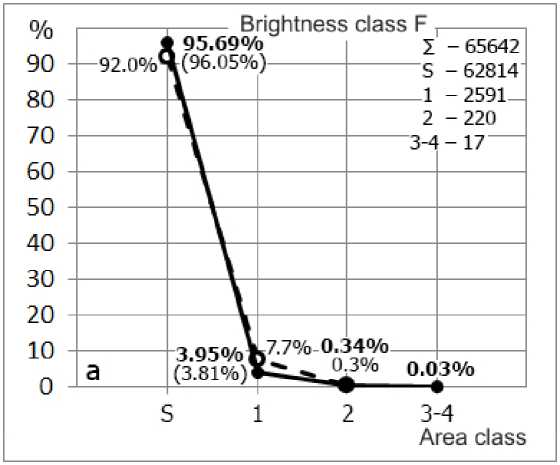
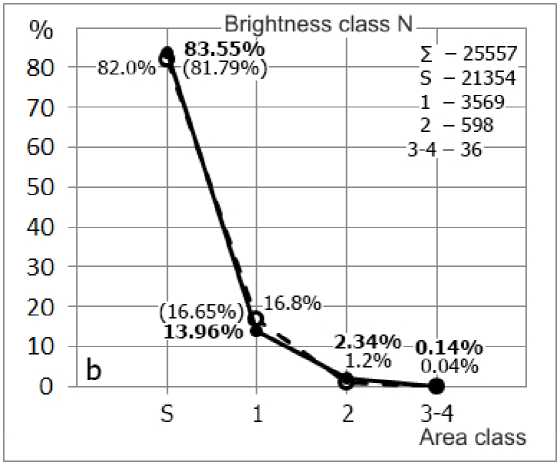
Figure 7 (Tables 4, 6) presents distributions of flares by areas for each brightness class F, N, B.
In the brightness class F, distribution curves show a fairly steep decrease. As class B is approached, the curves gradually straighten out and become flatter due to increasing number of bright flares having large area classes. In general, the character of these curves is almost identical to the distributions obtained in [Mitra et al., 1972]. Small changes occur in the brightness class F (Figure 7, a ): the number of S flares increases by 3.7%, and the number of class 1 flares decreases by virtually the same amount. Differences in brightness classes N and B (up or down) are within 0.1–3.2% (Figure 7, b , c ).
For S flares, the data from [Temmer et al., 2001] practically coincide with our findings. The number of class 1 flares (normal N and bright B) is about 3 % larger, which is closer to the results obtained in [Mitra et al., 1972].
a
b
c
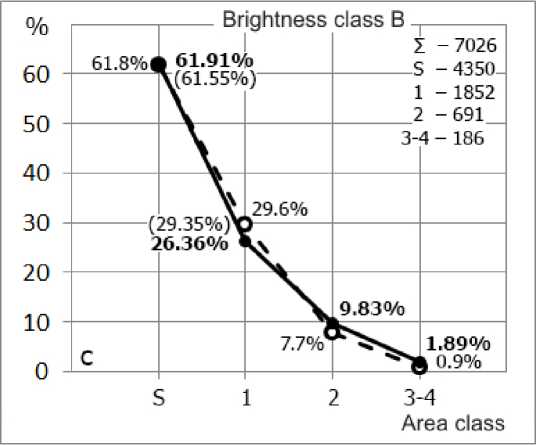
Figure 7. Area distribution of solar flares: for the brightness class F ( a ), for the brightness class N ( b ); for the brightness class B ( c )
Table 6
|
cd "о cd
|
Brightness class |
||||||||
|
F |
N |
B |
|||||||
|
I |
II |
III |
I |
II |
III |
I |
II |
III |
|
|
S |
92.0 |
96.05 |
95.69 |
82.0 |
81.79 |
83.55 |
61.8 |
61.55 |
61.91 |
|
1 |
7.7 |
3.81 |
3.95 |
16.8 |
16.65 |
13.96 |
29.6 |
29.35 |
26.36 |
|
2 |
0.3 |
0.14 |
0.34 |
1.2 |
1.56 |
2.34 |
7.7 |
9.10 |
9.83 |
|
3–4 |
– |
0.03 |
0.04 |
0.14 |
0.9 |
1.89 |
|||
BRIGHTNESS DISTRIBUTION OF SOLAR FLARES
Significant differences from previously obtained results have been found in brightness distributions of solar flares. According to [Mitra et al., 1972], moderately bright flares of class N dominate on the Sun (Figure 8).
From our results it follows that faint flares (class F) most frequently occur on the Sun. With increasing brightness, the number of flares drops sharply. This is confirmed by the data from [Temmer et al., 2001]. The difference between F and N flares is about 5%.
Ratios between the number of flares in respective brightness classes are as follows: N F / N N =2.6; N F / N B =9.3;
N N / N B =3.6
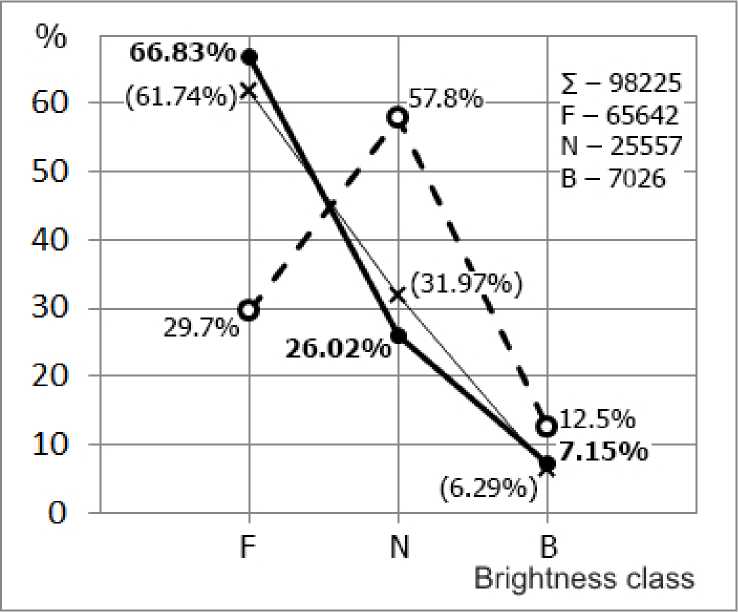
Figure 8. Brightness distribution of solar flares for 1972–2010
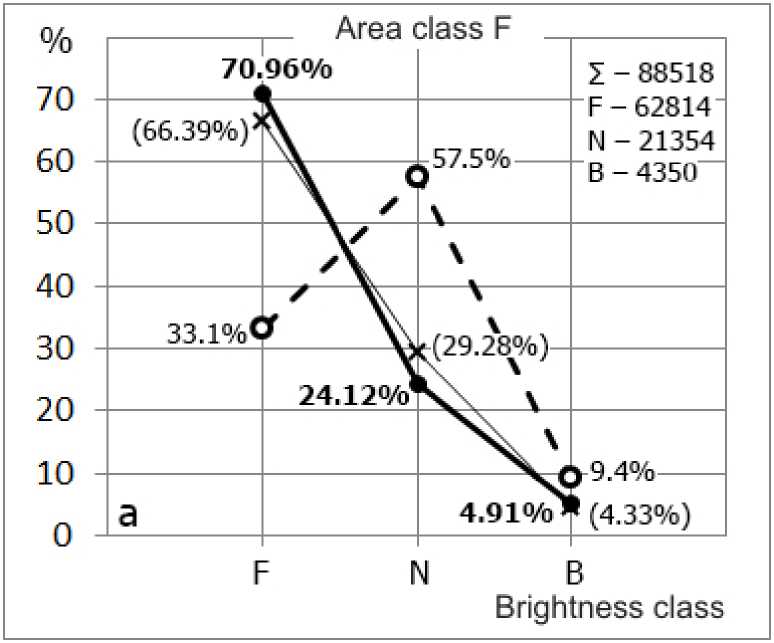
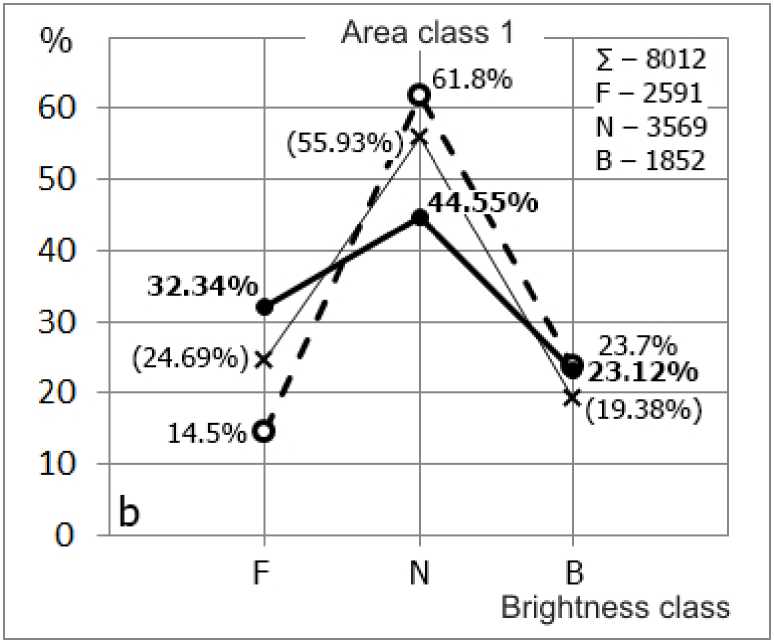
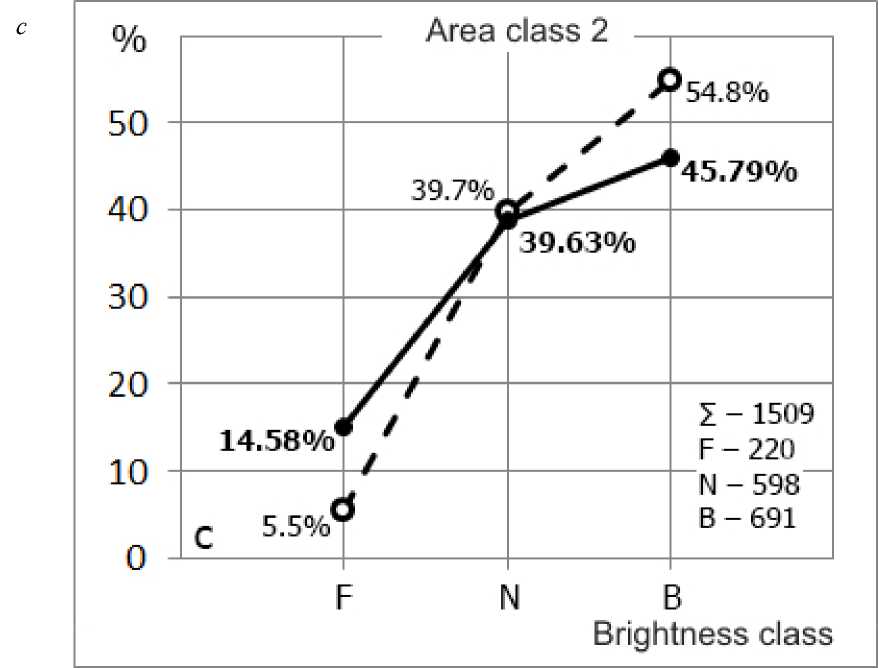
Significant differences were also obtained in the brightness distribution of flares within each area class (Figure 9, Table 7).
a
b
d
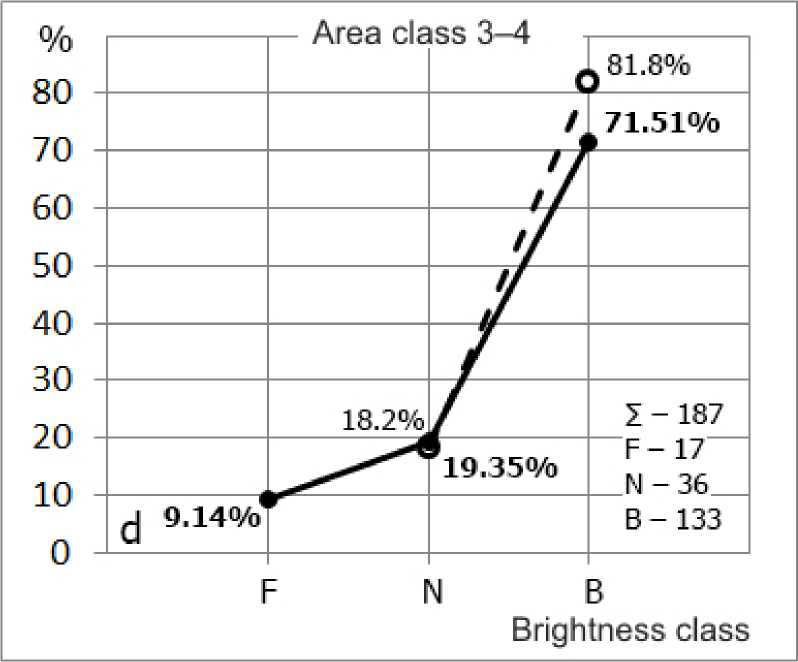
Figure 9 . Brightness distribution of S flares ( a ); class 1 flares ( b ); class 2 flares c ; class 3–4 flares ( d )
Table 7
|
о со cd tip "у m |
Area class |
|||||||||
|
S |
1 |
2 |
3–4 |
|||||||
|
I |
II |
III |
I |
II |
III |
I |
III |
I |
III |
|
|
F |
33.1 |
66.39 |
70.96 |
14.5 |
24.69 |
32.34 |
5.5 |
14.58 |
– |
9.14 |
|
N |
57.5 |
29.28 |
24.12 |
61.8 |
55.93 |
44.55 |
39.7 |
39.63 |
18.2 |
19.35 |
|
B |
9.4 |
4.33 |
4.91 |
23.7 |
19.38 |
23.12 |
54.8 |
45.79 |
81.8 |
71.51 |
As compared to the data acquired in [Mitra et al., 1972], F flares occur 2.1 times more often; N flares, on the contrary, 2.4 times less often. Bright, B flares are 1.9 times less frequent. For S flares, the resulting histogram indicates that the number of flares from class F to class B falls sharply. The peak, seen in the distribution derived in [Mitra et al., 1972] (Figure 9, a ) for N flares, is completely absent.
This is confirmed by the results received in [Temmer et al., 2001], which give values of about 5 % lower for F flares, 5 % higher for N flares, and have almost no difference with those obtained for B flares. The ratio between the number of flares in respective brightness classes are as follows : N SF / N SN =2.9; N SF / N SB =14.3; N SN / N SB =4.9.
For other area classes, the resulting histograms, in general, behave similarly, except for some quantitative indices.
For class 1, the number of N flares is considerably higher than that for classes F and B, and is 44.55 % (17.1 % lower than those obtained in [Mitra et al., 1972], and 11 % lower than the results received in [Temmer et al., 2001]). The number of bright flares is 9.3 % less than that of faint flares and 21.4 % less than that of normal ones.
For class 2, the number of faint flares is about 2.7 times smaller than that of normal flares and 3.1 times smaller than that of bright flares (according to [Mitra et al., 1972], the number of bright flares is 1.4 times larger than that of normal ones).
For classes 3–4, B flares are most frequent (71.51 %), N flares are about four times more rare. Faint, F flares account for only 9.1 %. According to [Mitra et al., 1972], bright flares make up 81.8 %; normal flares, 18.2 %, but no information is given about F flares.
DISTRIBUTION OF SOLAR FLARES BY IMPORTANCE
Figure 10 illustrates the distribution of flares by importance in accordance with the optical classification of 1966 (Table 4).
The distributions display a tendency for reduction of the number of flares with increasing optical importance. According to the distribution [Mitra et al., 1972], as in the case of the brightness distribution of flares, SN flares predominate on the Sun (47.4 %). There is also a significant peak for 1N (9.7 %) and a slight excess of the number of flares for 2B (1 %) and (3–4) B (0.11 %). The obtained results suggest that there is no maximum for SN flares; the most numerous class comprises SF flares (63.95 %). The number of flares from SF to 1F drops sharply. For 1N there is a slight increase in the number of flares (3.63 %), but it is 2.7 times smaller than that in [Mitra et al., 1972] and 1.5 times smaller than that in [Temmer et al., 2001].
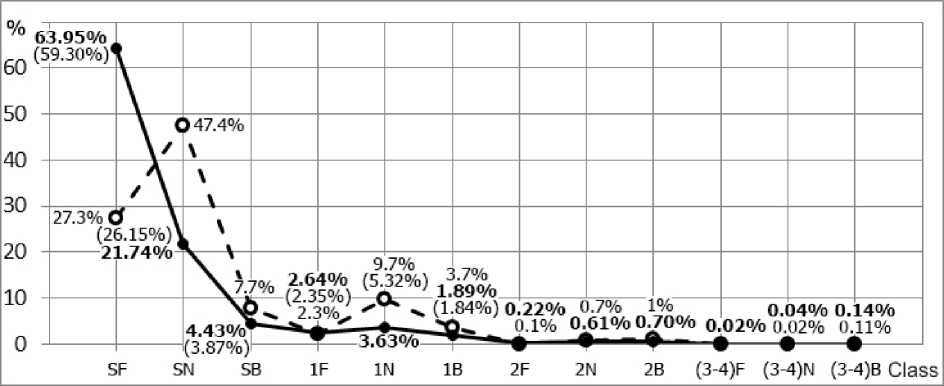
Figure 10. Distribution of solar flares by importance
Table 8
|
г* |
SF |
SN |
SB |
IF |
IN |
IB |
2F |
2N |
ZB |
(3-4)F |
(3-4)N |
(з^)в |
|
SF |
2.942 |
14.440 |
24.243 |
17.600 |
33.917 |
285.518 |
105.040 |
90.903 |
3694.941 |
1744.833 |
472.286 |
|
|
SN |
0.340 |
4.909 |
8.242 |
5.983 |
11.530 |
97.064 |
35.709 |
30.903 |
1256.118 |
593.167 |
160.556 |
|
|
SB |
0.069 |
0.204 |
1.679 |
1.219 |
2.349 |
19.773 |
7.274 |
6.295 |
255.882 |
120.833 |
32.707 |
|
|
IF |
0 041 |
0.121 |
0.596 |
0726 |
1.399 |
11.777 |
4333 |
3.750 |
152.412 |
71 972 |
19.481 |
|
|
IN |
0.057 |
0.167 |
0.820 |
1.377 |
1.927 |
16.223 |
5.968 |
5.165 |
209.941 |
99.139 |
26.835 |
|
|
IB |
0.029 |
0.087 |
0.426 |
0.715 |
0.519 |
8.418 |
3.097 |
2.680 |
108.941 |
51.444 |
13.925 |
|
|
2F |
0.004 |
0.010 |
0.051 |
0.085 |
0.062 |
0.119 |
0.368 |
0.318 |
12.941 |
6.111 |
1.654 |
|
|
2N |
0.010 |
0.028 |
0.137 |
0.231 |
0.168 |
0.323 |
2.718 |
0.865 |
35.176 |
16.611 |
4.496 |
|
|
2B |
0011 |
0.032 |
0.159 |
0.267 |
0.194 |
0.373 |
3.141 |
1.156 |
40.647 |
19.194 |
5.195 |
|
|
(3^)F |
0.0003 |
0.0008 |
0.0039 |
0.007 |
0.005 |
0.009 |
0.077 |
0.028 |
0.025 |
0.472 |
0.128 |
|
|
(3-4)N |
0.0006 |
0.0017 |
0.0083 |
0.014 |
0.010 |
0.019 |
0.164 |
0.060 |
0.052 |
2.118 |
0.271 |
|
|
(3-4)6 |
0.0021 |
0.0062 |
0.0306 |
0.051 |
0.037 |
0.072 |
0.605 |
0.222 |
0.192 |
7.824 |
3.694 |
Thus, 2N and 2B flares are 2.8 and 3.2 times more frequent than 2F ones. Among (3–4) flares there are many bright flares (0.14%) and few weak ones (0.02%).
Finally, Table 8 shows relations between different flare classes.
CONCLUSIONS
The results obtained allow us to draw the following conclusions.
-
1. Flares of all the area classes reveal a pronounced cyclicity and high correlation with Wolf numbers. Class S and 1 flares have the highest correlation coefficients. There is also a high correlation between S and 1, 1 and (2–4) flares.
-
2. The vast majority of solar flares are low-power (90 %). The most numerous class comprises SF flares (64 %). With increasing optical importance, solar flares are gradually redistributed toward an increase in brightness class.
-
3. The distribution of solar flares with increasing optical importance, as inferred from the results, smoothly decreases without significant deviations. The excess of the number of SN and 1N solar flares present in the distributions obtained in [Mitra et al., 1972] are most likely associated with poor statistics.
Список литературы Статистические исследования солнечных вспышек малой мощности. Распределения вспышек по площади, яркости и баллам
- Абраменко С.И., Дубов Э.Е., Огирь М.Б., Стешенко Н.Е., Шапошников Е.Ф., Цап Т.Т. Фотометрия солнечных вспы-шек//Известия КрАО. 1960. Т. 23, С. 341-361.
- Алтынцев А.Т., Банин В.Г., Куклин Г.В., Томозов В.М. Солнечные вспышки. М.: Наука, 1982. 246 с.
- Копецкая Ф., Копецкий М. Характеристики больших хромосферных вспышек каталога Фритцевой, Копецкого, Швестки//Иссл. по геомагнетизму, аэрономии и физике Солнца. 1971. Вып. 2. С. 117-130.
- Россада В.М. Статистический анализ 6600 вспышек за 1965-1966 гг.//Вестник Киевского государственного университета. Сер. Астрономия. 1977. № 19. С. 49-55.
- Смит Г., Смит Э. Солнечные вспышки. М.: Мир, 1966. 426 с.
- Antalova A. Catalogue of the LDE flares (January 1969 -March 1986)//Contr. Astron. Obs. Skalnatom Pleso. 1987. V. 16. P. 79-90.
- Mitra R.K., Sarkar S.R., Das Gupta M.K. Some studies on solar optical flares reported under new classification//Indian J. Radio and Space Phys. 1972. V. 1. P. 170.
- Sotnikova R.T. Energy spectrum of X-ray flares associated with sunspot groups of different classes in three solar cycles//Geomagnetism and Aeronomy. 2010. V. 50, N 7. P. 905-907.
- Temmer M., Veronig A., Hanslmeier A., Otruba W., Messerotti M. Statistical analysis of solar Hα flares//Astron. Astrophys. 2001. V. 375. P. 1049-1061.
- Warwik C.S. Solar flare frequency and observing-time patterns//Astrophys. J. 1965. V. 142, N 2. P. 767-771.
- Ward F., Cornevall R.F., Hendle R. Solar flare observations from a pair of matched instruments//Solar Phys. 1973. V. 31. P. 131.

