
Structural and technological changes in the Russian economy since 2014
Журнал: Economic and Social Changes: Facts, Trends, Forecast @volnc-esc-en
Рубрика: Theoretical and methodological issues
Статья в выпуске: 4 т.19, 2026 года.
Бесплатный доступ
The challenges of modern economic development make it particularly urgent to improve the quality of economic growth and the efficiency of the economy. Reshaping Russia’s external economic relations has set in motion far-reaching changes in core macroeconomic and intersectoral linkages. The study focuses on structural and technological shifts across industries, together with changes in sectoral labor productivity. Drawing on Rosstat data and updated input-output tables for 2011–2024 developed at the Institute of Economic Forecasting of the Russian Academy of Sciences, we apply methods and models of mathematical analysis and input-output modeling to show that the structural and technological characteristics of the Russian economy have changed substantially since 2014. Restricted access to external markets posed a major challenge, but the severe restrictions imposed by Western countries ultimately enabled the Russian economy to display flexibility and shift much of the real sector toward the domestic market, both in terms of output and investment. The improvement in the quality of growth during this period was accompanied by faster dynamics of primary resource productivity and labor productivity in certain economic activities. At the same time, significant changes in the technological level of production in several key economic sectors responsible for security and technological sovereignty (such as pharmaceuticals, machinery, and computer equipment) resulted from rising imports rather than import substitution. An important finding is that the Russian economy remains highly dependent on imports of goods and equipment. Modeling economic growth based on updated structural and technological interactions in Russian industries could be a subject of further research.
Короткий адрес: https://sciup.org/147255176
IDS: 147255176 | УДК: 338.012, 338.12.015, 338.12.017, 338.36, 338.242, 330.44 | DOI: 10.15838/esc.2026.4.106.2
Текст научной статьи Structural and technological changes in the Russian economy since 2014
The new geopolitical environment is gradually reshaping the Russian economy. Despite external sanctions pressure, prerequisites are emerging in Russia for faster economic growth, new technological niches, and import-substituting industries. This means that, in practical terms, devising measures to achieve technological independence is becoming one of the most important tasks of economic development.
The challenges of modern economic development – including sanctions and geopolitical pressure and constraints on key production resources – are gradually bringing to the fore the problem of improving the quality and efficiency of economic growth. Just as the efficiency of labor use is reflected in labor productivity, the technological level of production is reflected in the efficiency of capital use. These indicators are interrelated, and it is no coincidence that many studies associate the level and dynamics of technological development with the level and dynamics of labor productivity (Marx, 1951). Under current conditions, with primary and secondary sanctions, import substitution of technologies, even through direct borrowing, is a rather costly and lengthy process requiring not only significant investment but also skilled labor. Entrepreneurs often prefer to “wait out” the bad times in the hope of returning to purchases of imported equipment when possible. Most enterprises and sectors of the economy still lack long-term development programs and strategies, and their operations are often driven by short-term interests (Kapelyushnikov, Lukyanova, 2010), while economizing on technological development in the short term can become a significant obstacle to achieving the country’s strategic development goals and priorities in the long term.
The dynamics of economic growth depend substantially on the level and pace of scientific and technological development. At the same time, only sufficiently high rates of economic growth can guarantee a broad-based improvement in the technological level of production1.
Various indicators of technological innovation are used to quantify the level and pace of technological change, including R&D expenditures, the share of new equipment, the number of patents (Kapelyushnikov, 2017), estimates of capital and materials productivity, labor intensity and resource intensity of the economy (Suvorov, Davidkova, 2005; Suvorov, 2008), and various combinations of output and fixed capital investment ratios (Almon, 2002; Eroshkin, Komkov, 2006). Technical progress is often associated with the rate of labor productivity growth or with declining labor intensity, which signals a growing influence of technical progress on the production process (Baldwin, 1995; Imagava, 2008).
Let us group some existing methods and models used to measure the technological level of production and its impact on economic dynamics.
-
1. Production function methods and models (Kapelyushnikov, 2017; Suvorov, 2008; Suvorov et al., 2015; Mamonov et al., 2015; Solow, 1956; Solow, 1957; Bergeaud et al., 2017).
-
2. Input-output modeling methods (Levitsky et al., 1975; Sayapova, 2016; Ono, 2008).
-
3. Models combining production function methods and input-output tools (Suvorov, Davidkova, 2005; Suvorov et al., 2015).
In models based on production functions, technological progress is measured through total factor productivity (TFP) (Mamonov et al., 2015; Solow, 1956; Solow, 1957; Bergeaud et al., 2017). For the United States over 1909–1949, estimates of technological increments based on the Solow (1957) approach averaged 1.5%. Taking into account additional factors – the average educational level of the employed and the average age of equipment – average annual TFP growth rates rose to 2.5% (for the period since 1890) (Kapelyushnikov, 2017; Bergeaud et al., 2017). The highest rates (2.5%) were observed in 1913–1950, a period that includes the decade of the Great Depression, while the lowest (0.6%) were recorded for 2005–2015. Similarly derived average annual TFP growth rates for the United Kingdom did not exceed 1.8% over the period since 1890, and for Japan they reached no more than 4.4% over the same period, with the lowest growth rates – about 0.4% – again recorded for 2005–2015 (Kapelyushnikov, 2017; Bergeaud et al., 2017).
In this case, the technical progress component is identified using the matrix of direct input coefficients (the matrix of technological coefficients). Some studies (Levitsky et al., 1975; Sayapova, 2016) show only minor changes in technological coefficients and, accordingly, a limited impact on economic growth. For example, the work (Sayapova, 2016) estimates the technological contribution to output dynamics in the Russian economy at about 5% (based on the national input-output table). At the same time, Russia’s technological level lags behind Japan – here technological change accounts for about 16% of output growth – by at least 15 years. Japan has its own experience in modeling direct input coefficients. The estimated contribution of technological progress to Japan’s economic growth with constant direct input coefficients was 9% for 2006–2020, while with dynamic (expert-set) coefficients it reached 20% (Ono, 2008).
Estimates of technological progress growth in the Russian economy obtained by two different methods (the production function approach and sectoral material intensity indicators) produced different results. The average annual growth of technological progress estimated using the production function framework over the 23-year forecast period was 3.3%, while growth based on the rates of change in sectoral current material intensity was 2.1% per year. At the same time, the projected economic growth was driven by the technological factor by 81 and 74%, respectively (Suvorov et al., 2015).
As the analysis shows, estimates of scientific and technological progress (STP) vary quite considerably, and there is also wide dispersion in assessments of its impact on economic growth. We therefore draw on the framework developed in (Uzyakov, 2011), which proposes estimates of STP based on indicators of the productivity of primary resource use2. Over 1990–2009, the dynamics of this indicator in the Russian economy are estimated at 2.3% in average annual terms (Uzyakov, 2011). As noted in our earlier work3, industries initially have substantially different opportunities for raising the technological level of production. Some sectors – such as oil refining or metallurgy – operate with established, capital-intensive technologies and a conservative output structure, and cannot expect a rapid improvement in their technical level or, accordingly, a large contribution of STP to output growth. At the same time, agriculture and construction can achieve faster changes in the technological level of production through intra-industry and territorial shifts, as well as the introduction of new technologies. Our findings show that the most significant contributions of technological progress to economic growth are observed in activities such as communications and telecommunications, construction, agriculture, and machinery and equipment production, all of which are characterized by faster growth in primary resource productivity.
The need to find new sources of growth makes research on structural interactions in the economy increasingly relevant (Shirov, 2022), and the assessment of structural constraints on growth is becoming more and more in demand. Although structural changes are not treated as an independent factor, some studies conclude that they can be both a consequence and a cause of economic growth4. It was precisely against the backdrop of pronounced structural changes that rapid growth (around 4.5% per capita annually) and stable growth (for at least three decades) occurred in various countries (Rodrik, 2013). Structural shifts were the main driver of the economic transformation of 1991– 2008. Some researchers link economic dynamics over the past 25 years to structural shifts and changes in intersectoral linkages5. Moreover, shifts in the structure of production largely explain most of the decline in material intensity in developed economies as the influence of changes in the average level of technology slows (Uzyakov, 2011). The economic structure also has a significant impact on inflation, while inflation-targeting policy, by contrast, restrains economic growth and locks in the existing structure of the economy (Sukharev, Voronchikhina, 2025).
According to studies (Glazyev, Sukharev (2024); Maltsev, Chichilimov, 2024), the Russian economy has considerable growth potential, but realizing this potential requires a change in its structure – not only sectoral but also technological. A new growth model should be based on increased fixed capital investment, development of the domestic market, support for aggregate demand, and import substitution. At the same time, other researchers associate the closing of the economy with negative trends for economic development and suggest balancing the current forced import substitution by seeking new partners to resume imports from countries that have not joined the sanctions6. The key threat to the country’s geo-economic sovereignty lies in “the low share of machinery and equipment needed to sustain industrial and technological transformation in Russia’s merchandise imports” (Maltsev, Chichilimov, 2024, p. 114).
A transition to sustainable economic growth is impossible without an active state industrial policy, and investment in human capital is a prerequisite for the durability of such growth. Many researchers of structural and technological factors of economic growth emphasize that balanced growth is driven not only by technological improvement but also by the critical importance of human capital (Voskoboinikov, 2023; Maltsev, Chichilimov, 2024). At the same time, systemic measures to transform the economy and modernize its structure must be aimed at raising public welfare (Glazyev, Sukharev, 2024).
Studies of the impact of structural and technological factors on labor productivity growth (Uzyakova, 2026) show that over time the influence of structural factors increases while that of technological factors declines: whereas in 2016 about 70% of labor productivity growth could be explained by technological change, by 2026 their contribution had fallen to 30%, while the influence of structural shifts rose from 10% in 2016 to 37% in 2026. The contribution of the quality component to GDP dynamics in 2013–2024 did not exceed 10%7.
We hypothesize that the structural and technological interactions in the Russian economy have undergone substantial changes since 2014. The most intensive shifts were triggered by changes in relations with the outside world, above all with the Collective West. We define the aim of this study as examining changes in the structural and technological characteristics of the Russian economy in conjunction with sectoral labor productivity dynamics, and identifying the sectors with the greatest and least growth potential to support the long-term development of the economy under the new geoeconomic conditions and in the context of strengthening Russia’s sovereignty. In line with this aim, the research objectives were: to analyze changes in the structural and technological characteristics of the Russian economy together with sectoral labor productivity dynamics, as one of the indicators of the quality of economic growth; to identify the sectors with the greatest and least potential for output growth and technological increments; and to reveal growth constraints for sectors that are significant from the standpoint of security and technological sovereignty. Production growth potential is understood here as the possibility of accelerating output expansion driven by significant technological increments, which are traditionally associated with improvements in the quality and efficiency of production. The subject of the study is structural and technological change across economic sectors, considered together with changes in sectoral labor productivity.
Data and methods
The input-output balance provides the most complete information not only on the level and dynamics of direct input coefficients – traditionally associated with technological progress – but also on intersectoral interactions within the economy.
Using input-output tools makes it possible to assess the impact of structural and technological changes on economic growth, thereby constructing a structural and technological profile of the Russian economy as a set of production interactions – such as sectoral gross output, final demand components, and primary input costs – combined with indicators related to the quality of growth, such as labor productivity. Input-output analysis is therefore becoming increasingly relevant.
The availability of up-to-date input-output data8 has allowed us to assess the key macroeconomic and structural interactions over the period starting in 2014, when the sanctions regime began. In our view, the content of core economic interactions in Russia has changed quite dynamically since then, driven by the reshaping of external economic relations. Here we do not discuss the sanction “packages” of the Collective West but instead seek to understand how the structural changes that have occurred since 2014 have affected the functioning of the Russian economy.
The initial data consist of Rosstat statistics and updated input-output tables for 2011–2024 developed at the Institute of Economic Forecasting of the Russian Academy of Sciences (IEF RAS) in constant 2011 prices. The findings were obtained through the analysis of input-output statistics using methods and models of mathematical analysis and input-output modeling.
The scientific novelty of this study lies in the use of updated input-output tables for 2011–2024 to analyze technological changes across economic sectors using the methodology set out in (Uzyakov, 2011), compared with sectoral labor productivity series, as well as in verifying the authors’ structural-technological analysis methodology9. Another element of novelty is the calculation of sectoral labor productivity series for 64 economic activities10 corresponding to the developed input-output tables.
Results and discussion
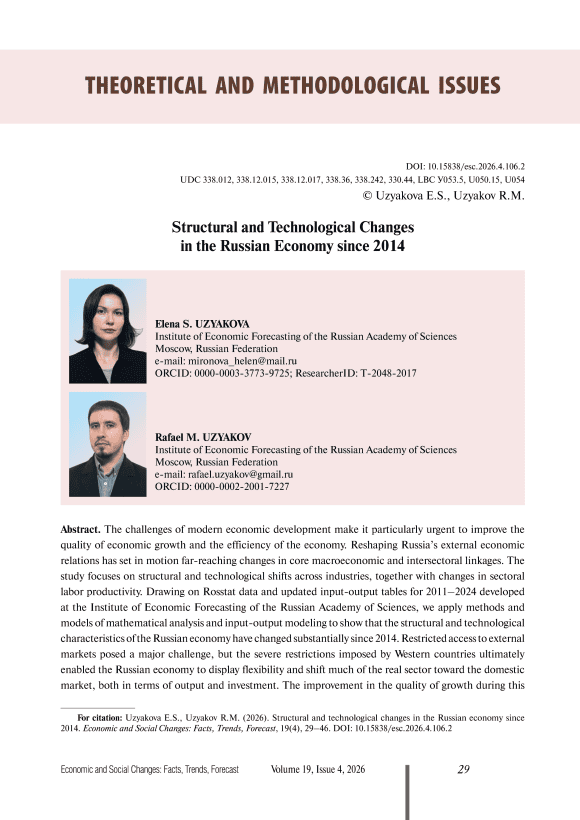
As noted earlier, the dynamics of primary resource productivity are often associated with the dynamics of technological progress or the quality of economic growth. It is therefore of particular interest to compare these dynamics with those of labor productivity across economic activities over the past decade. Primary resource productivity for the economy as a whole declined from 2013 to 2015 ( Fig. 1 ). As sanctions pressure intensified after 2014, a significant part of the economy reoriented – or began to reorient – toward other markets or other producers, import substitution gradually developed, and the quality of economic growth, together with primary resource productivity, began to improve; this improvement continued until 2020. According to the hypothesis of synchronized dynamics of productivity and labor efficiency, the efficiency of labor use rose by 13% from 2015 to 2020. Subsequently, under the impact of shocks of a non-economic nature (COVID-19, the special military operation), primary resource productivity declined from 2020 to 2022, but from 2022 both productivity and labor productivity showed a significant acceleration. In 2022–2024, both indicators increased by 3.3% annually.
Figure 1. Primary resource productivity and labor productivity (right axis), annual dynamics, %
^^^^^m Primary resource productivity ^^^^^^^^» Labor productivity
Sources: Rosstat data; own calculations based on IEF RAS input-output tables.
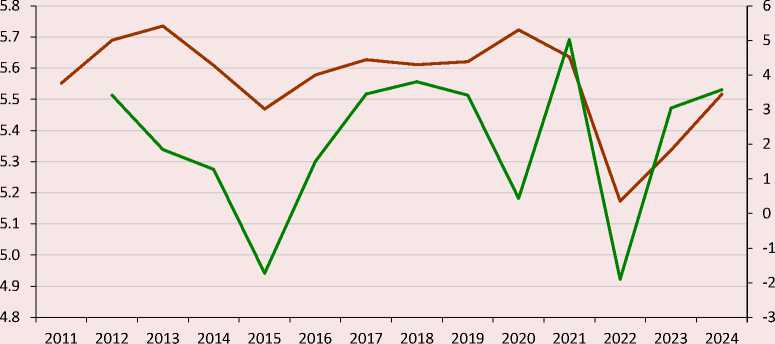
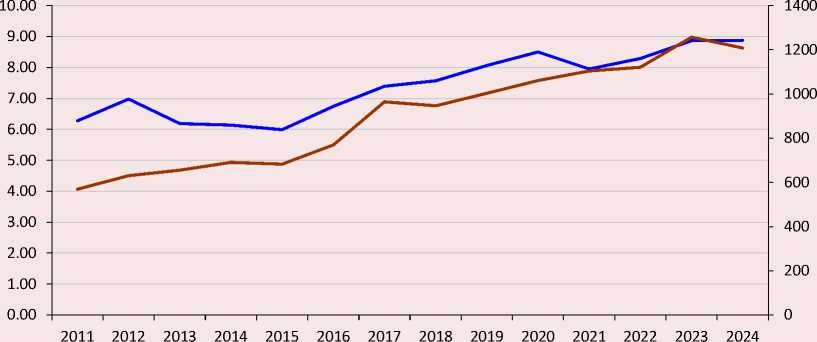
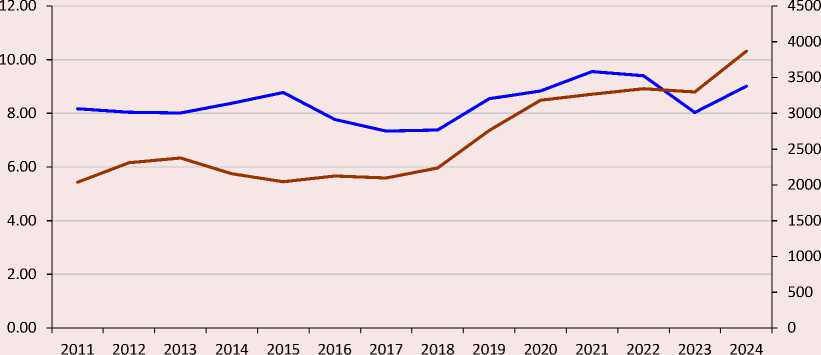
Let us now present the results of the sectoral analysis. Within material production, we identify the activities with the highest and lowest relative levels of primary resource productivity ( Tab. 1 ). The highest productivity levels are observed in sectors with potential for growth in import-substituting production or in demand on alternative markets (in the case of extractive industries), where productivity is growing at a faster pace. These same sectors, correspondingly, show accelerated labor productivity growth.
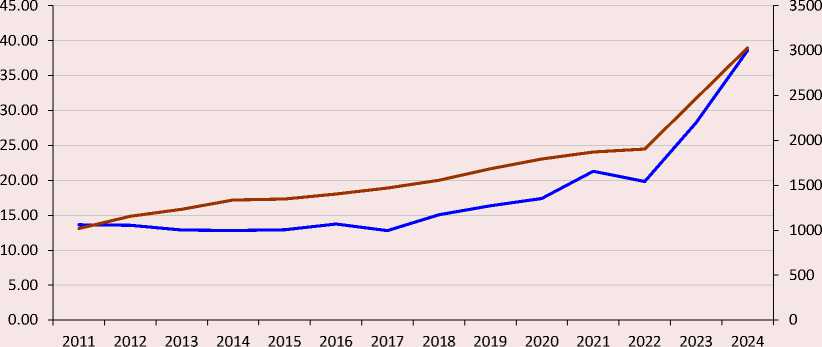
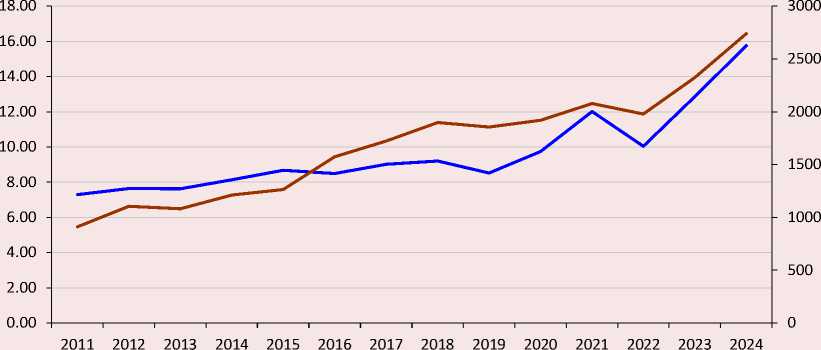
As already noted, both the dynamics of technological progress (primary resource productivity) and the dynamics of labor productivity are associated with the quality of economic growth. The sectoral analysis shows that a number of industries, predominantly those with the highest productivity levels, exhibited synchronous dynamics of productivity and labor productivity over the period under review ( Fig. 2–5 ).
In addition, synchronous dynamics of productivity and labor productivity are observed in several other sectors: food production (where the elasticity of labor productivity with respect to productivity over 2011–2024 was 2.0111), paper and paper products (0.12), other non-metallic mineral products (3.67), finished metal products except machinery and equipment (0.69), electrical equipment (3.8), and motor vehicles, trailers, and semi-trailers (0.19).
From the standpoint of improving production efficiency in the long term, there is no alternative to qualitative economic growth, including through raising the technological level of production and the consequent increase in labor productivity. Russia’s growth model of the 2000s relied predominantly on the growing use of imported equipment and consumer goods, which implied the borrowing of technologies and innovations from abroad. According to some estimates, import dependence
Table 1. Activities with the highest and lowest levels of productivity and their dynamic characteristics
|
Activity |
Productivity level relative to the economy average, 2024, % |
Average annual productivity growth rate, 2011–2024, % |
Average annual labor productivity growth rate, 2011–2024, % |
Ratio of growth rates (elasticity of labor productivity to productivity), times |
|
Highest level |
||||
|
Coal industry |
135 |
2.16 |
2.8 |
1.31 |
|
Other minerals, mining services |
130 |
0.38 |
12.1 |
31.50 |
|
Textiles and textile products, clothing, leather and leather products |
162 |
2.70 |
6.0 |
2.20 |
|
Medicinal products and materials for medical use |
164 |
0.75 |
5.1 |
6.72 |
|
Computer, electronic, and optical equipment |
703 |
8.33 |
8.7 |
1.05 |
|
Transport vehicles and other equipment |
287 |
6.11 |
8.8 |
1.45 |
|
Lowest level |
||||
|
Agricultural and hunting products and services |
48 |
-2.00 |
4.9 |
-2.47 |
|
Wood and wood and cork products, except furniture; straw and plaiting materials |
36 |
-2.37 |
4.6 |
-1.95 |
|
Coke and refined petroleum products |
26 |
-3.08 |
-0.6 |
0.20 |
|
Chemical substances and chemical products |
40 |
0.14 |
2.7 |
18.57 |
|
Rubber and plastic products |
30 |
-1.08 |
3.5 |
-3.26 |
|
Basic metals |
27 |
-2.55 |
1.6 |
-0.62 |
|
Electricity, gas, steam, and air conditioning supply |
38 |
0.09 |
0.8 |
8.15 |
|
Source: own calculations based on IEF RAS input-output tables. |
||||
Figure 2. Primary resource productivity and labor productivity (right axis) in textile production
^^^^ш Primary resource productivity ^^^^^^^^^ Labor productivity
Sources: Rosstat data; own calculations based on IEF RAS input-output tables.
Figure 3. Primary resource productivity and labor productivity (right axis) in the production of medicinal products and materials for medical use
^^^^^^^м Primary resource productivity ^^^^^^^^м Labor productivity
Sources: Rosstat data; own calculations based on IEF RAS input-output tables.
Figure 4. Primary resource productivity and labor productivity (right axis) in the production of computer, electronic, and optical equipment
^^^^^н Primary resource productivity ^^^^^^^^м Labor productivity
Sources: Rosstat data; own calculations based on IEF RAS input-output tables.
Figure 5. Primary resource productivity and labor productivity (right axis) in the production of other transport vehicles and equipment
^^^^^^^м Primary resource productivity ^^^^^^^^м Labor productivity
Sources: Rosstat data; own calculations based on IEF RAS input-output tables.
on high-tech goods and services in 2015 reached 90%, compared with 15% in the late Soviet period (Maltsev, Chichilimov, 2024). Changes in relations with the outside world, above all with the Collective West, produced the most intensive shifts in the structure of the Russian economy (Uzyakov, Serebryakov, 2023). The structural and technological profile of the Russian economy has changed substantially, and activities related not only to defense but also to import substitution have begun to develop actively.
Further analysis of structural and technological interactions in the Russian economy will be carried out using the methodology of structural and technological multipliers (STMs)12. STM indicators are synthetic metrics calculated using a static inputoutput model. An STM is the model-based response of sectoral output and gross output to a one-percent increase in final demand components13. STM values are the product of two factors: a structural factor and a technological factor. The structural factor is the share of the changing final demand component in output. The technological factor is the elasticity of output with respect to the increment in the changing final demand component (elasticity is calculated using a static input-output model, i.e., taking into account the influence of the matrix of direct input coefficients, or the “technological matrix”). Changes in STM characteristics over time reflect how the economy and individual industries adapt to structural and technological shifts in production.
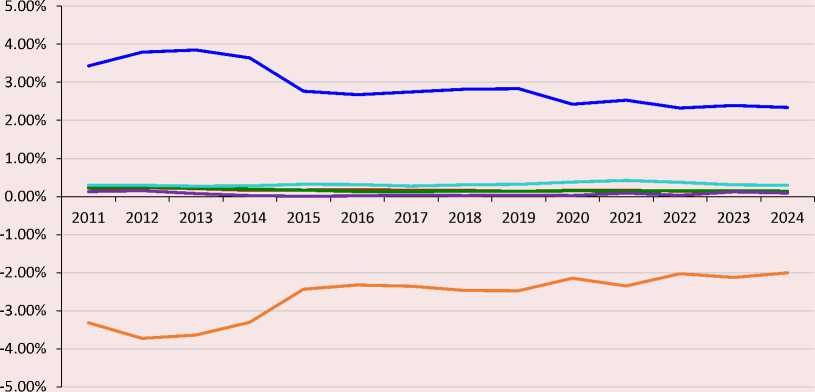
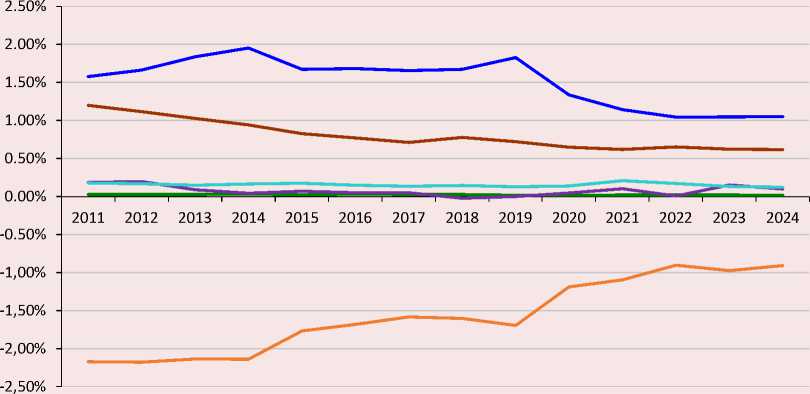
It should also be noted that STM indicators represent the contributions of final demand components to the dynamics of sectoral and gross output. Analysis of STM dynamics shows that many activities – even among the most efficient, with the highest growth in primary resource productivity – still rely on rising imports and do not exert a significant influence on the quality of the Russian economy. For example, calculations of the contributions of final demand components to output dynamics in activities with a high level and high dynamics of productivity (textiles and pharmaceuticals) reveal a significant dependence of household consumption (HC) on imported products14 (Fig. 6, 7).
The graphs show that the contributions of household consumption and imports have been in counterphase throughout the period under review, in both the textile and pharmaceutical industries. In other words, an increase in the contribution of household consumption occurs only with a corresponding increase in the negative contribution of imports – i.e., consumption of these products is provided by imports.
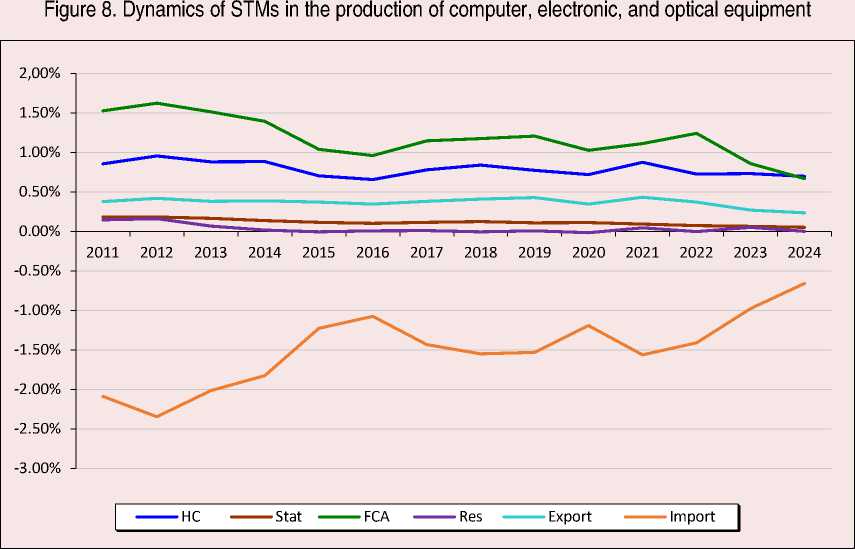
Analysis of the contribution of final demand components (STMs) to the output dynamics of computer, electronic, and optical equipment (with a productivity level of 703% of the economy average in 2024 and an average annual productivity growth of 8.3% over 2011–2024) confirms that in this industry the relationship between fixed capital accumulation and imports remains strong, which may indicate the limited nature of import substitution ( Fig. 8 ). Thus, in the activities considered, output growth is driven by an increasing share of imported goods and equipment, which under current conditions runs counter to the goals and strategic priorities of the country’s long-term development, the main ones being security and technological sovereignty15.
Figure 6. Dynamics of STMs in the textile industry
^^^^^^^^ HC ^^^^^m Stat ^^^^^^^^м FCA ^^^^^^^^м Res ^^^^^^^^м Export ^^^^^^^^м Import
Sources: Rosstat data; own calculations based on IEF RAS input-output tables.
Figure 7. Dynamics of STMs in the production of medicinal products and materials
^^^^^^^^м HC ^^^^^^^^м Stat ^^^^^^^^м FCA ^^^^^^^н Res ^^^^^^^^м Export ^^^^^^^^м Import
Sources: Rosstat data; own calculations based on IEF RAS input-output tables.
Sources: Rosstat data; own calculations based on IEF RAS input-output tables.
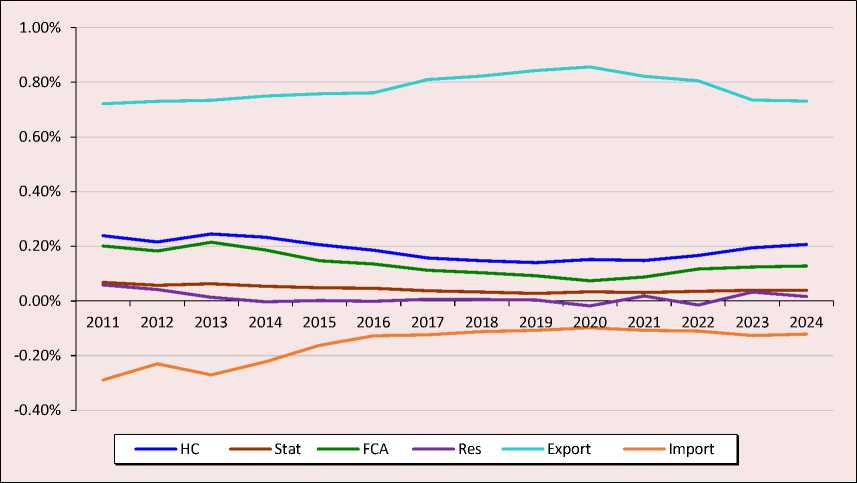
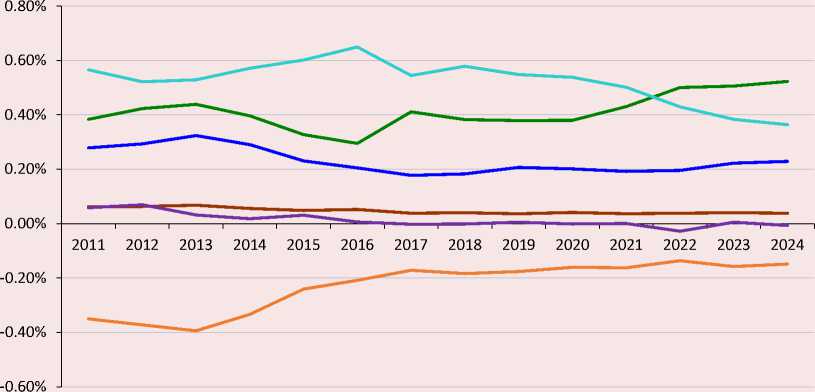
Among the industries with the highest productivity levels, there are some whose adaptation mechanisms under current economic conditions involve reorientation toward the domestic market. These include the coal industry and the extraction of other minerals, where after 2020 the decline in the contribution of exports to the growth of the corresponding outputs (reflecting sanctions and falling external demand) was accompanied by an increase in the contributions of fixed capital accumulation and household consumption ( Fig. 9, 10 ).
Analysis of the sectoral dynamics of structural and technological multipliers shows that, in general, all activities belonging to the real sector of the economy are divided into two types of interaction between the contributions of final demand components to output dynamics. The first type consists of a positive response for the Russian economy to restricted access to external markets
(a decline in the export contribution), expressed in increased contributions from household consumption and/or fixed capital accumulation. The overwhelming majority of economic activities in the real sector received an impetus to reorient production toward the domestic market and increase investment, and responded to it only as a result of restricted access to external markets ( Tab. 2 ).
The second type of interaction is expressed in continued dependence on imported goods and components. Economic activities traditionally highly dependent on imports maintain this linkage even during the years of the special military operation (SMO), a period characterized by the strongest sanctions pressure on Russia. Notably, these activities include industries that are truly significant from the standpoint of security and technological sovereignty, such as pharmaceutical production, machine building, and computer equipment.
Figure 9. Dynamics of STMs in the coal industry
Sources: Rosstat data; own calculations based on IEF RAS input-output tables.
Figure 10. Dynamics of STMs in other minerals
^^^^^в HC ^^^^^^^^^ Stat ^^^^^^^^м FCA ^^^^^^^^М Res ^^^^^^^^» Export ^^^^^^^^^ Import
Sources: Rosstat data; own calculations based on IEF RAS input-output tables.
Table 2. Interaction of final demand component contributions to output dynamics, 2020–2024
|
Reorientation to the domestic market |
Import dependence |
|
Decline in the export contribution is accompanied by an increase in the contribution of household consumption and/or fixed capital accumulation |
Increase in the import contribution is accompanied by an increase in the contribution of household consumption and/or fixed capital accumulation |
|
Agricultural and hunting products and services |
Textiles and textile products, clothing, leather and leather products |
|
Fish and other fishing and fish-farming products; services related to fishing and fish farming |
Medicinal products and materials for medical use |
|
Coal |
Rubber and plastic products |
|
Crude oil and natural gas |
Computer, electronic, and optical equipment |
|
Metal ores |
Machinery and equipment not elsewhere classified |
|
Other minerals, mining services |
Motor vehicles, trailers, and semi-trailers |
|
Food products, beverages, tobacco products |
Furniture; other finished goods |
|
Wood and wood and cork products, except furniture; straw and plaiting materials |
Water transport services |
|
Paper and paper products |
|
|
Coke and refined petroleum products |
|
|
Chemical substances and chemical products |
|
|
Other non-metallic mineral products |
|
|
Basic metals |
|
|
Finished metal products, except machinery and equipment |
|
|
Transport vehicles and other equipment |
|
|
Repair and installation services for machinery and equipment |
|
|
Electricity, gas, steam, and air conditioning supply |
|
|
Natural water; water treatment and supply services |
|
|
Sewerage services; sewage sludge; waste collection, treatment, and disposal services; waste remediation and other waste disposal services |
|
|
Buildings and construction works |
|
|
Land and pipeline transport services |
|
|
Source: own calculations based on IEF RAS input-output tables. |
|
Overall, the structural and technological characteristics of the Russian economy have changed substantially since 2014. While in the first years after the introduction of anti-Russian sanctions the changes taking place in the structure of the Russian economy were not so obvious and were only marginally reflected in macroeconomic statistics, after the coronavirus pandemic and the start of the SMO their dynamics and scale made it possible to draw substantive economic conclusions using only top-level macrostatistics – final demand components.
Restricted access to external markets became a serious test for the domestic economic system, but it was precisely this tough stance by the Collective West that helped the Russian economy demonstrate flexibility and organize the work of a significant part of the real sector with a focus on domestic demand, both in terms of output produced and in terms of increasing investment.
Conclusion
Our analysis shows that the Russian economy remains highly dependent on imports of goods and equipment. The findings confirm that the reorientation toward domestic demand was not the realization of the economy’s growth potential but rather a forced measure under the current geoeconomic conditions. On the one hand, organizing import substitution in a short period is difficult, almost impossible; on the other hand, economic agents are often interested not in formulating long-term development goals and priorities – and, consequently, in pursuing importsubstituting activities aimed at developing domestic production and technological potential – but in extracting short-term gains. Yet while in the short term the possibility of economic growth through increasing the volume of attracted resources may seem an advantageous strategy, in the long term, in the context of strengthening Russia’s sovereignty, there is no alternative to improving quality and efficiency, since the production resources available – labor and capital – are limited.
The absence of a long-term economic development strategy, targeted sectoral project financing programs, and other measures of state support for domestic producers devalues any qualitative changes in the economy, whether technological advances or improvements in the quality of human capital (labor productivity). Our calculations show that the growth of primary resource productivity in the economy as a whole has been slowing over time: whereas in 2000–2011 the indicator increased by an average of 2.9% per year, in 2011–2024 it grew by only 0.1%. Looking ahead to 2035, we project average annual growth of no more than 1%.
Undoubtedly, the key factor constraining any qualitative changes in the economy is the excessively tight monetary policy (Uzyakova, Uzyakov, 2026), which should perform a servicing function for the economy and adapt to economic policy, rather than the other way around. An innovation-driven economy, a knowledge economy implies investment in research and development, in technological innovation, and in the quality of education and human capital. The absence of a long-term socioeconomic policy (together with monetary and fiscal policy), development strategies, and priorities disorients economic agents, replacing the ideas and values of the state’s strategic development with short-term interests and gains.
Thus, the following conclusions can be drawn from the study.
-
1. The structural and technological characteristics of the Russian economy have changed substantially since 2014. The overwhelming majority of economic activities in the real sector received an impetus to reorient production toward the domestic market and increase investment, and responded to this impetus only as a result of restricted access to external markets.
-
2. The sectoral analysis shows that the activities with the highest level of primary resource productivity – reflecting technological increments in industries such as the coal industry, other minerals, textiles and leather products, pharmaceuticals, computer, electronic, and optical equipment, and other transport vehicles and equipment – may have the greatest potential for output growth owing to accelerated improvements in quality and efficiency. In a significant number of these industries, synchronous dynamics of productivity and labor productivity were observed.
-
3. The Russian economy remains highly dependent on imports of goods and equipment. Economic activities that have traditionally been heavily import-dependent maintain this dependence even when there is a need to organize import-substituting production aimed at developing domestic production and technological potential. These activities include sectors that are truly significant from the standpoint of security and technological sovereignty, such as pharmaceutical production, machine building, and the production of computer equipment.