Structure and dynamics of household consumption of information goods: regional perspective

Author: Kuzmin Aleksandr Ivanovich, Kostina Svetlana Nikolaevna, Bannykh Galina Alekseevna
Journal: Economic and Social Changes: Facts, Trends, Forecast @volnc-esc-en
Section: Regional economy
Article in issue: 3 (51) т.10, 2017.
Free access
Over the past two decades, the indicators of consumption of information goods by the Russian population have been significantly behind the similar indicators in developed countries, which was accompanied by inequality in consumption between Russian regions. The importance of studying consumption of information goods in information economy is due to the fact that the degree of satisfactionofneedsreflectsthelevelofpopulation'swelfareandisanindicatorofinnovativedevelopment which defines the incentives and constraints of modernization and long-term sustainable growth of the national economy. The article is devoted to contemporary structural changes in consumption of auxiliary information goods by the population of a dynamically developing region (the Sverdlovsk Oblast) amid the development of information economy. The use of methods of economic-statistical analysis and sociological survey has helped identify the structure and main trends in consumption of information goods in Russia in general and in the Sverdlovsk Oblast in particular. The article reviews the impact of factors such as consumers' age group, place of residence (town, village) and income level on household consumption of goods in the Sverdlovsk Oblast.
Information economy, consumption, information products, household, sverdlovsk oblast
Short address: https://sciup.org/147223943
IDR: 147223943 | UDC: 338.46 | DOI: 10.15838/esc.2017.3.51.9
Text of the scientific article Structure and dynamics of household consumption of information goods: regional perspective
The development of the information society, which still remains one of priority objectives for the Russian government, is focused primarily on the growth of production and consumption in the information sphere. Changes in the structure of consumption of information goods amid the formation of information economy are driven by various factors such as rapid emergence and production of new goods and services in information and communication technology (ICT) and socio-cultural characteristics of consumer behavior of different sociodemographic groups. At the same time, the inequality in information and communication benefits (services, goods, technologies) remains at several levels: international (relative to developed countries), regional (between different constituent entities in Russia), and social (between people of different socio-demographic groups).
Despite considerable interest in the issues of the information society to both representatives of various scientific disciplines (especially economists and sociologists) and government structures responsible for its establishment in Russia, the number of works analyzing the regional specific features of households’ information benefits consumption is small. In line with this, the purpose for the present study is to consider the modern structure, characteristics and trends of consumption of certain types of information benefits by households from the Sverdlovsk Oblast amid information economy.
The research novelty lies in an attempt to thoroughly analyze the specific features of consumption of supporting information benefits the availability of which is largely determined by informational inequality between both households and regions.
The practical value of the research is due to the possibility of using the research data by government authorities, manufacturers of information goods, researchers dealing with information society and information economy including the digital divide.
Conceptual approaches to the issue of consumption in the ICT sector
The idea that the basis of modern society is information generation and distribution appeared in the 1960–1980-s in the works of famous foreign scientists such as F. Machlup, Yo. Masuda, T. Stonier, J. Beniger, M. Porat and others. Information as an economic category was widely used in economic research during the information revolution of the 1950–70-s., when knowledge became a key production factor. At the same time, according to D. Bell, information is a very specific good characterized by social nature (consumed by the society in general, rather than by an individual), lack of physical consumption and depreciation, the need for new approaches to determining its value and price [5].
Recognition of information and knowledge a key factors in the development of modern society has led to the emergence of several new theories – information society, knowledge society, theories of information economy. The term “information economy” was established in the work by M. Porat who divided material and energy production and information [25]. Thus, information economy is referred to as economy of information benefits and ICT. In other words, it includes production, distribution, consumption of information benefits and ICT. Information benefits are benefits which can be represented digitally (books, movies, phone conversations, etc.). According to this criterion, information benefits are material [1]. Growing ICT will inevitably lead to economic growth as it helps every industry improve the quality of production of goods and services, which this inevitably leads to increased consumption [22]. Progress in ICT causes a drop in consumption and intermediate product production prices for ICT, providing incentives for investment in sectors using ICT [26].
M. Castells clarifies the term “information economy” mentioning informational and global economy in which “productivity and competitiveness of factors or economics actors (be it a firm, a region or a nation) depend primarily on their ability to generate, process and efficiently use information based on knowledge”” [10], which is only possible within a global interconnected network.
According to I.V. Monakhova, the formation of information economy has led to the transformation of all aspects of consumption: structure, nature, type, quality characteristics [13, p. 7].
Economics defines consumption as the total amount of goods purchased and consumed during a certain period, as well the use of consumer goods aimed at meeting people’s material and spiritual needs. Consumption is one of the major economic categories of a complex and contradictory nature. On the one hand, consumption is associated with income, savings and investment (this is analyzed in the works of many scientists: J. Keynes, R. Harrod and A. Hansen, J. Duesenberry, L. Klein, M. Friedman, F. Modigliani, etc.), on the other hand, consumption is studied as a characteristic of consumer behavior related to needs and motives, freedom of choice. The latter implies numerous theories of need (С. Alderfer, D. McClelland, A. Maslow, H. Murray), theories of rational behavior (M. Weber, H. Simon, K. Arrow, G. Becker, R. Coase, Ch. Buchanan, D. North and R. Fogel), theories of adverse selection and moral hazard (J. Stiglitz, M. Spence, C. Shapiro, G. Akerlof), etc.
The development of the information society and information economy has led to changes in the structure of final consumption: decreased share of goods with a low degree of involvement, increasing diversification of goods and services, increased number of types of mediation services, increased share of services in final consumption, increased significance of effects of consumer behavior on consumer behavior strategy [6].
In our opinion, it is subjective, sociocultural factors that largely determine the changing nature of consumption in information economy. A surge in intangible, non-utilitarian benefits is associated with the implementation of spiritual, intellectual and creative human needs [14, p. 38]. Consumption becomes more varied, individualized, and situational and depends on the person’s lifestyle. Conspicuous (prestige) consumption aimed at establishing and maintaining a certain social status is transformed into a new type of consumption – simulation (symbolic) where different types of benefits of human consumption are replaced by their symbols. These types of behavior are no longer unique to particular social groups (for example, in T. Veblen’s theory of the leisure class, demonstrative behavior was attributed to the rich, ruling class) and become widespread [19, p. 52]. Consumption does not only fulfil the function of group prestige, but also becomes a system of communication and exchange as well as a means of constructing one’s “I” [21, p. 46]. One of the main characteristics of information goods is their symbolic (image) value formed on the basis of unique relations between consumers and goods [24, p. 97] which helps consumers shape and maintain their identity, their belonging to a reference group. For example, in connection with the increased public interest in environmental issues there is an increase in eco-friendly ICT consumption through limited use of potentially toxic materials in electronics production [18]. There also are many other features of consumption related to socio-cultural factors. Thus, D. Horrigan distinguishes a group of trendsetting tech elite or the so-called “greedy” consumers who buy information and communication goods and services, thereby charting the course for their use in the future [23].
The current changes largely affected the quality of consumer goods. Information economy is characterized by the growth of the so-called experience goods, i.e. complex devices whose qualities cannot be determined before purchase (for example, laptops, and cell phones) [24, p. 98]. Rapid obsolescence of goods takes place, when moral depreciation is ahead of physical depreciation: underutilized goods become out of use long before their actual depreciation. At the same time, there is an increase in the number and complexity of consumer goods which must not only be useful and novel, but also be of a symbolic value formed on the basis of unique relations between consumers and goods [14, c. 39].
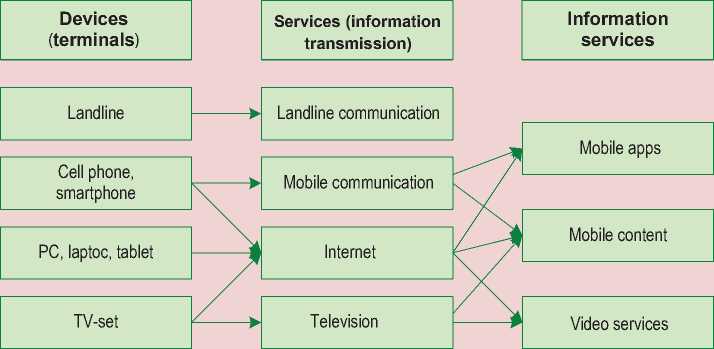
Information economy and information society highlight information goods. However, there currently is no shared understanding of what constitutes “information goods”. They usually include information products such as products of information activity and supporting products, i.e. products ensure information generation, storage, processing and distribution [7, p. 45]. In the first case we are talking about different types of information (business, expert, educational and consumer) necessary to meet the needs of different categories of users [4, p. 65]. To supporting information products include ICT, information services, information and communication devices which provide access to products of information activity and information technology.
The present study focuses on the specific features of consuming supporting information products – data transmission ICT and devices (hardware) which provide access to information for households.
According to the integrated model proposed by T.A. Kuzovkova, the ICT user also uses connection and information services in the form of content and applications [12, p. 54]. Producers and providers of services can be quite different in both type of communication and range of services provided. The process information and communication service creation simultaneously involves three types of producers: communication service provider providing information transfer and network access; content producers and aggregators of information and communication and services (e-banking, e-store, “smart house” management, etc.); content and service providers.
In information economy the structure of communication services has significantly changed. These include not only written communication (life – more than three centuries), telegraphic messages (over 150 years), landline phone calls (over 100
Figure 1. Patterns of consumption of information goods
years), but also mobile communications (over 30 years). It is important to note that new services and means of communication do not immediately and completely replace traditional (old) services. Thus, a decline in written correspondence over the past 20 years is explained by private mail with relative preservation of business correspondence documents, notices, reminders, etc. [12, p. 55].
At the same time, household consumption of information and communication (IC) services is impossible without appropriate technical means of access to communication, information networks and resources (cell phone, PC, TV-set, etc.) ( Fig. 1 ). Thus, IC service consumption is directly related to the use of information and communication devices (IC devices).
Due to development of technology new types of IC devices are constantly produced and rapidly become obsolete. Simultaneously, there is the “interpenetration” of functions performed by various IC devices: modern PCs perform the functions of a DVD player, a TV set and partly of a cell phone; cell phones have acquired the functions of a video camera and a PC; smart TV has replaced a PC. As a result, IC devices can be divided into 2 groups: “basic” devices – TV sets, PCs, cell phones; and IC devices whose consumer functions can be fully performed by other devices (VCRs, camcorders, DVD players).
Research methods
Assessment of consumption of IC devices and IC services in the Sverdlovsk Oblast was carried out based on statistics during 2000– 2015 inclusive provided by the Federal State
Statistics Service [17]. It should be noted that part of statistical information in the regional context has been systematically gathered by Rosstat only since 2007. Rosstat simultaneously collects information on comparable indicators using different methods (for example, the share of households residing in houses equipped with landline; landline density including pay phones per 100 inhabitants; number of telephones including local and universal pay phones per 1000 inhabitants in urban and rural areas, etc.). According to this, selection of indicators for analysis is also a challenge.
The Rosstat technique of statistical data collection for household IC devices does not fully assess their quality. For example, the category “mobile phones” includes smart phones, “personal computers” – laptops and tablet PCs, “TV sets” –smart TV. There are no statistics on input-output devices in household possession: printers, scanners, multifunction devices.
Qualitative characteristics of consumption were analyzed based on the results of a sociological survey in the Sverdlovsk Oblast conducted in 2014–2015. It was conducted by selecting a representative sample by age (16– 75 years) and type of settlement (metropolis, large, medium, small city, rural settlement). The study presented 934 questionnaires.
During the research methods of mathematical statistics were used for data analysis. Based on time series trend lines were constructed through extrapolation method with the use of MS Excel (including polynomial approximating curve). We also used regression and correlation analysis to identify the impact of individual factors on the changes in consumption of IC devices and services.
Specific features of household consumption of IC devices in the Sverdlovsk Oblast
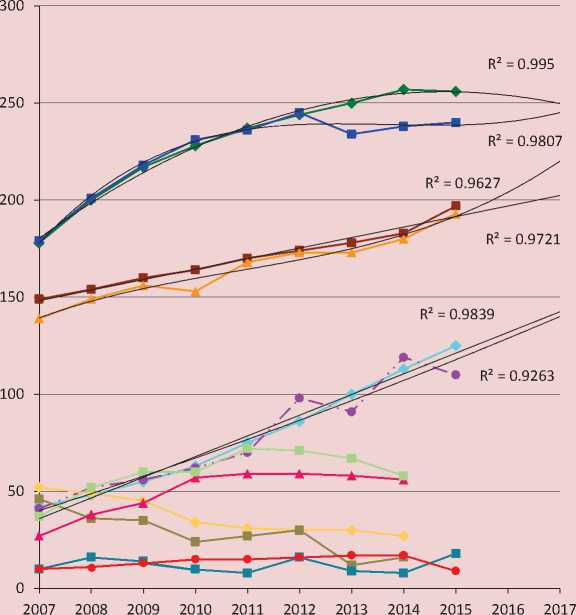
Let us consider the indicators characterizing consumption of durable information goods: the number of TV sets, cell phones, PCS, VCRs, DVD players and video cameras per 100 households ( Fig. 2 ). The basis for time series is Rosstat statistics on Russian and Sverdlovsk Oblast.
Analysis of consumption dynamics helps reveal the modern trends in this area. The most rapid growth is observed in the number of personal computers. During 2007–2014, their number increased 2.7 times in Russia and 2.9% times in the Sverdlovsk Oblast amounting to 119 units per 100 households. In 2015 in the Sverdlovsk Oblast, according to the Federal State Statistics Service, the number of PCs decreased to 110 units per 100 households.
In recent years, information processing devices are becoming more varied; the gradual replacement of desktop computers with the portable ones continues. According to J’son & Partners Consulting, in 2015, desktops were used by 53% of families; laptops – by 63%. In addition, over the past three years the
Figure 2. Changes in the number of IC devices in Russia and in the Sverdlovsk Oblast in 2007–2017, per 100 households
Cell phone, Russia
Cell phone, Sverdlovsk Oblast
TV set, Russia
TV set, Sverdlovsk Oblast
PC, Russia
PC, Sverdlovsk Oblast
VCR, video player, Russia
VCR, video player, Sverdlovsk Oblast
—*— DVD-плеер, Russia
— ■ — DVD-плеер,
Sverdlovsk Oblast
Camcorder, Russia
Camcorder, Sverdlovsk Oblast
Source: official statistics of the Federal State Statistics Service average retail price for smartphones and tablet PCs has decreased despite the price increase in 2015 [20]. These devices have become available for people with almost any level of income: their sales increased significantly.
During the sociological survey we studied the consumption of both device categories as a whole, but also their particular types: smartphones, smart TV, tablets and laptops.
The obtained results help draw conclusions about the structure of consumption of both families and individuals ( Tab. 1 ).
Judging by the survey results almost the same number of families own laptops (81%) and personal computers (86%), a lesser number – tablets (68%). Analysis showed that less than 7% have no IC devices. The general trend, according to statistical data analysis
Table 1. Sverdlovsk Oblast population’s estimates of the number of IC devices in individual and family possession, 2015, % of respondents
|
Number of devices |
Cell phone |
Smartphone |
Tablet |
Laptop |
ПC |
TV set |
Radio |
Landline |
Smart TV |
|||||||||
|
CL |
Е |
cl |
Е |
cl |
Е |
cl |
Е |
cl |
Е |
cl |
Е |
Е |
Е |
Е |
||||
|
None |
5.4 |
5.2 |
38.0 |
27.9 |
48.4 |
32.3 |
27.8 |
18.7 |
27.2 |
15.9 |
10.2 |
2.5 |
41.2 |
36.9 |
41.6 |
30.3 |
63.0 |
57.0 |
|
One |
80.3 |
17.9 |
55.9 |
26.8 |
49.3 |
49.6 |
66.1 |
47.4 |
68.2 |
64.6 |
65.4 |
31.7 |
55.7 |
46.3 |
56.0 |
59.4 |
34.6 |
33.6 |
|
Two |
9.9 |
25.6 |
3.3 |
19.4 |
1.3 |
11.7 |
3.6 |
22.4 |
2.9 |
12.7 |
14.4 |
30.9 |
1.4 |
9.0 |
1.8 |
5.8 |
1.5 |
5.9 |
|
Three |
2.5 |
25.3 |
1.3 |
15.4 |
0.2 |
3.3 |
1.5 |
7.1 |
0.8 |
4.2 |
7.6 |
24.4 |
0.9 |
4.3 |
0.2 |
2.3 |
0.9 |
2.4 |
|
Four |
2.0 |
26.1 |
1.5 |
10.6 |
0.8 |
3.0 |
1.0 |
4.3 |
0.8 |
2.6 |
2.4 |
10.5 |
0.7 |
3.4 |
0.5 |
2.2 |
0.0 |
1.1 |
(R2 = 0.97), also focuses on the continuing growth of households PC consumption (Fig. 2).
It seems interesting that there is a steady increase in the number of TV sets in Russia as a whole and in the Sverdlovsk Oblast in particular, where it amounted to 38.8% in 9 years. As a result, in 2015, each household had an average of 1.93 TV. This is confirmed by data of the present study: 66% of respondents indicated that their family owns two or more TV sets, every tenth family has 4 TV sets. The second and subsequent TV sets are primarily for “summerhouse” and “kitchen”, then “bedroom” and “children”.
The upward trend is observed in consumption of cell phones. It should be noted that since 2007 there has been a steady nationwide growth in the number of household landlines, in the Sverdlovsk oblast in 2013, this number is decreased by 11 followed by a slow growth afterwards. In 2015, each household in Russia had an average of 2.56 cell phones, in the Sverdlovsk Oblast this number amounted to 2.4. According to other Rosstat statistics, this number comprised 1852.6 cell phones per 1000 people.
Consumption of other IC devices is non sustainable. Thus, the number of VCRs in 2007–2014 fell sharply – by more than 2 times in Russia and almost 3 times in the Sverdlovsk Oblast, which, of course, is related to their “moral depreciation”. Almost the same situation currently characterizes DVD devices – they were mostly used in 2011, since then a downward trend has been observed. It is currently rather difficult to assess the consumption of VCRs and DVD-players due to the fact that since 2015, official statistics collects data on VCRs and DVD-players together. In 2015, the total number of these devices comprised 43 per 100 households across the Russian Federation and 39 units – in the Sverdlovsk Oblast.
The situation with camcorders is more controversial. In Russia, the number of these devices owned by households changed abruptly in the period under review, although starting form 2007 up to the end of 2015 this number increased 1.8 times (from 10 to 18 units per 100 households). In the Sverdlovsk Oblast, the increase in the number of camcorders was sustainable until 2014; in 2015, there was a sharp decrease from 17 to 9 units per 100 households.
In the study, we performed the forecast of consumption of basic IC devices by using the method of extrapolation of the obtained data series for the next 2 years (see Fig. 2 ). The trend forecast shows (approximation reliability R2=0.99) that in the short term, the number of cell phones in Russia is most likely to reduce slightly, and in the Sverdlovsk Oblast, this number will further grow till it reaches the average Russian value. Analysis of the trend helps speculate on the future growth of household use of TV sets and PCs in the whole country and in the region. The revealed trends were confirmed by the results of forecast made by several authors according to which the number of PCs will increase from 99 million in 2015 to 120 million by 2020 [16]. However, according to the economists of the Analytical Center for the Government of the Russian Federation, in 2005–2014, there was a mass upgrade of durable goods, especially in big cities, which primarily affected computer equipment and communication devices.
Russia was then ahead of most countries in the world in terms of purchasing durable goods and demonstrated one of the highest share of expenditures (15%) on various devices. In this case, by 2013 the saturation levels at the prevailing social structure were achieved [8]. This affects the possible purchase fluctuation amid economic recession.
Changes in the structure and volume of demand for information products are influenced by various factors. Works of domestic researchers draw attention to the following groups:
-
1) technological: innovative development of technical means and networks, availability and quality of IC services and devices, production and implementation of IC services and devices;
-
2) socio-economic: GDP and GRP growth rates, inflation, level of household income, expenditures on IC services and devices in a family’s budget, the extent to which ICT is implemented in economic activities;
-
3) socio-demographic: population, number of employed in economy, subscribers’ demographic composition, population’s territorial structure (those living in urban and rural areas; by region);
-
4) socio-psychological: consumers’ affiliation to a social group, nature of activity, level of commitment to an ICT type, willingness to master new IC services and devices.
Survey results analysis and statistics show that the use of IC devices is influenced by three major factors: consumers’ age, type of settlement and per capita household income.
Analysis of statistical information has revealed high correlation between the indicators of per capita household expenditures on final consumption and the number of TV sets (regression coefficient R2 equals 0.93 at F=0.000089), mobile phones (R2=0.96 at F=0.000019) and PCs (R2=0.92 at F=0.00014) per 100 households. For devices such as VCRs, camcorders and DVD-players this correlation is less significant.
An age group is one of the most important factors determining consumption patterns of both individuals and households. Most studies distinguish three main age groups: young people under 30, adults – 30–55 and elderly people over 55. Age consumption peculiarities in ICT are, in our view, associated with economic (level of education, employment and, respectively, average per capita income) and socio-psychological (goals, skills and readiness to use various IC devices) characteristics.
Young people under 30 is a population group most widely using and adopting new IC devices and means of communication which construct the basis of their lifestyle. Representatives of this group have the most developed skills in applying IC devices. At the same time, the growing consumption of
IC devices and services within this group is constrained by relatively low income levels and young people’ focus on purchasing a car and accommodation.
The majority of consumers aged 30–55 are at the peak of their labor activity and are highly employed and have correspondingly high incomes. This age group adheres to the credit model of consumption which suggests that more money is spent than received in the form of current income [14, p. 40]. Consequently, representatives of this age group are the main consumers of durable goods, including IC devices.
Patterns of consumption of information goods by elderly people are associated with several characteristics. First, even if enough savings are available, elderly consumers pursue the strategy of saving. At the same time, the need to maintain a lifestyle leads to compensatory buying behavior when the retirees often purchase relatively expensive goods and services amid implementation of their saving strategy [2, p. 4]. One of the important factors affecting consumption of information goods by the elderly is their low level of skills in using IC devices and modern communication systems, as noted in the number of domestic and foreign studies.
Elderly people are demonstrating a trend towards using “traditional” technical devices. On the contrary, progressive “new” “nonstandard” technical devices are often purchased by younger people: 68% of young people possess a smartphone while only 17% of elderly people have it (Cramer’s V=0.263, significant); 63% of young people and 62% of middle-aged people possess one tablet while only 27% of elderly people possess one (Cramer’s V =0,140, significant).
Significant differences in the pattern of consumption of IC devices should be noted depending on consumers’ place of residence. Residents of metropolis and large cities are the main smartphone users – 77% of respondents; inhabitants of rural areas – only 32%. People living in villages and small towns in the Sverdlovsk Oblast possess “simple” cell phones (86%). For the residents of large cities, particularly Ekaterinburg, a cell phone mainly serves as a “supplement” to a smartphone – the second (25%) or the third one (5%). The inhabitants of metropolis are the main users of TV sets with smart technology (41% of Ekaterinburg respondents). In other settlements of the region, the majority (70%) of the population use “regular” TV sets.
One of the factors influencing household consumption of IC devices is, in our opinion, the population’s interest in new technical devices, which, amid the information society and scientific and technical progress, is an indicator of the expected demand for emerging products and services. The greatest interest in technical innovation devices is displayed by young people (27%) and men in general (22%), the lowest – by people in rural areas.
The survey has identified the average frequency of household purchasing IC durables: almost every third buys a cell phone or a smartphone on average once every 2–3 years; the majority of the population buy tablets, laptops, PCs, TV sets or smart TV less than once in 5 years ( Tab. 2 ).
In our view, a significant feature of household use of ICT devices is the incomplete use of their functional properties. As can be seen from Table 3 , only about one-third of consumers believe that they fully use of the properties of their IC devices (except TV sets).
Table 2. Frequency of purchasing new IC devices to operate information by the population in the Sverdlovsk Oblast in 2015, % of respondents
|
Purchase frequency |
Cell phone |
Smartphone |
Tablet |
Laptop |
PC |
TV set |
Smart TV |
|
Once a month |
1.2 |
1.2 |
1.2 |
0.6 |
0.9 |
0.6 |
1.8 |
|
Only in every 6 months |
2.8 |
4.0 |
2.7 |
2.0 |
2.4 |
1.9 |
3.2 |
|
Once a year |
10.0 |
11.4 |
4.6 |
3.1 |
2.0 |
2.7 |
3.9 |
|
Once in every 2–3 years |
30.0 |
25.9 |
19.4 |
13.8 |
8.4 |
7.4 |
3.6 |
|
Once in every 4–5 years |
21.7 |
15.0 |
17.5 |
24.2 |
20.4 |
17.4 |
12.5 |
|
Less than once in every 5 years |
34.3 |
42.5 |
54.7 |
56.4 |
65.9 |
69.9 |
75.0 |
|
Total |
100.0 |
100.0 |
100.0 |
100.0 |
100.0 |
100.0 |
100.0 |
Table 3. Sverdlovsk Oblast population’s estimates of using the functional properties of their IC devices in 2015, percentage of respondents
|
Полнота использования |
Cell phone |
Smartphone |
Tablet |
Laptop |
PC |
TV set |
Smart TV |
|
Cannot use |
1.9 |
22.9 |
19.0 |
10.8 |
5.3 |
0.7 |
31.3 |
|
10–20% |
12.7 |
7.7 |
12.5 |
12.0 |
11.1 |
5.4 |
14.8 |
|
30–50% |
23.4 |
21.3 |
21.5 |
22.6 |
23.1 |
16.3 |
13.5 |
|
60–80% |
25.7 |
22.0 |
22.0 |
24.9 |
27.2 |
22.2 |
14.4 |
|
100% |
36.3 |
26.0 |
24.9 |
29.6 |
33.4 |
55.4 |
26.0 |
|
Total |
100.0 |
100.0 |
100.0 |
100.0 |
100.0 |
100.0 |
100.0 |
Trends in household consumption of IC services
Let us consider the main trends in household consumption of IC services in the Sverdlovsk Oblast. These include communication services provided by landline and mobile communications providers, Internet, analog and digital TV (ADTV), radio.
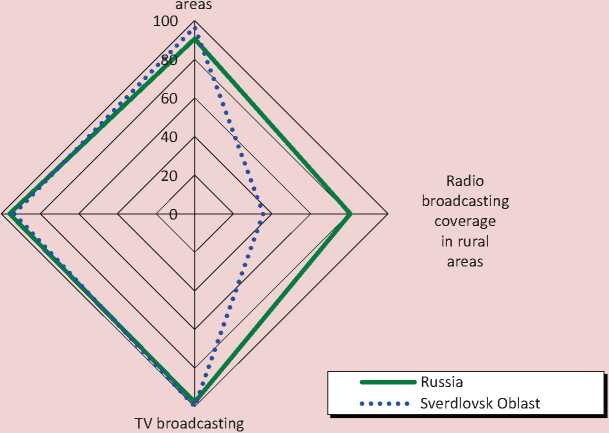
Radio being the oldest form of IC communication is gradually losing its importance with the development of other types of IT. At the end of 2015, according to Rosstat, the radio broadcasting coverage amounted to the average of 80% ( Fig. 3 ). In the Sverdlovsk Oblast, the values significantly differ: the urban coverage is higher than the national average (96.7%), the rural coverage – more than 2 times lower (35.4%).
Nowadays television remains the most widespread and popular IC service. According to Rosstat, at the end of 2015, at least one television program covered 97.6% of urban and 95.8% of rural population. In the
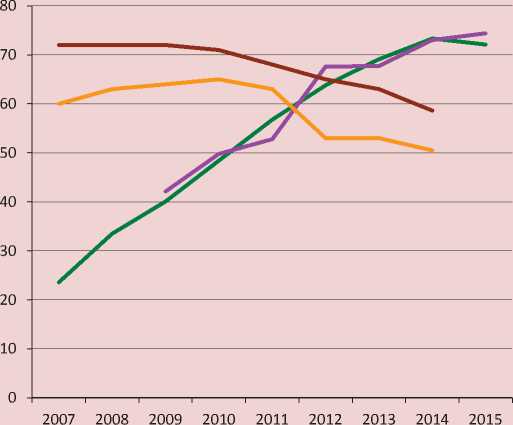
One of the most important indicators of information society development is its use of landline communication. In Europe, this figure reaches 95%. In Russia, starting from 2009, we observe a downward trend in the number of households residing in houses equipped with landlines ( Fig. 4 ). For comparison, we took another indicator which is recorded by the Federal State Statistics Service – the number of landlines,
-
Figure 3. Radio and TV broadcasting coverage in urban and rural areas of Russia and Sverdlovsk Oblast by the end of 2015.
Radio broadcasting coverage in urban
TV broadcasting coverage in rural areas
coverage in urban
areas
Source: official statistics of the Federal State Statistics Service.
including local and universal payphones per 1000 residents in urban and rural areas. These figures reached its maximum level in the Sverdlovsk Oblast in 2008, when urban areas accounted for 378.1 landlines per 1000 people (in Russia in general – 382.2), and rural – 132.5 (in Russia in general – 143.8). By the end of 2015, these figures dropped to 288.9 units in cities (in Russia in general – 318.6) and 104.8 units in rural areas (in Russia as a whole – 122).
The Sverdlovsk Oblast generally follows the nationwide trend, although significant regional differences can be observed: first, the values of indicators are lower; secondly, their decline rates are higher. The number of landline telephones on public domain network changed within this trend. The peak in Russian was recorded in 2008 – 280.4 landlines per 1,000 people in urban areas and 119.4 in rural areas. In 2014, the Sverdlovsk Oblast ranked 52nd among all Russian regions
-
Figure 4. Share of households equipped with landline and using the Internet in Russia and in Sverdlovsk Oblast in 2007–2015
^^^^^wShare of households using the Internet, Russia
^^^^^^™Share of households using the Internet, Sverdlovsk Oblast
^^^^^^™Share of households residing in houses equipped with landline, Russia
^^^^^^™Share of households residing in houses equipped with landline, Sverdlovsk Oblast
Source: official data of the Federal State Statistics Service.
by number of landlines in rural areas (109) and 55th – by a similar indicator in urban areas (186.5).
In recent years, consumption of landline communication services has been declining; mobile communication services, however, are becoming more demanded. According to the monitoring of the information society in 2010–2015 published by the Higher School of Economics, Russia has one of the highest mobile communication prevalence in the world – 151 active subscribers per 100 inhabitants, which exceeds even the level of developed countries with 120 subscribers per 100 people [9, p. 32].
According to data from TMT consulting, significant growth in the number of mobile subscribers was observed: by 12.9 million in 2013, by 3.5 million – in 2014, in 2015, subscriber bases of Russian mobile service providers increased by more than 11.6 million people. At the end of 2015, there were 251.8 million mobile subscribers in Russia accounted for 178 subscribers per 100 inhabitants. MTS served 77.3 million subscribers, MegaFon – 74.8 million, Vympelcom – 59.8 million, Tele2 – 37.3 million [15]. Unfortunately, there are no official statistics on this indicator in the regions.
Furthermore, the most important means of obtaining information is the Internet, including both “household” dial-up networking using a modem and a public domain network, and broadband or highspeed Internet access, as well as mobile Internet.
As can be seen from the data above (see Figure 4), the share of households using the Internet in the Sverdlovsk Oblast at the end of 2015 amounted to 74.4%. Over 6 years, starting from 2009 the number of users increased 1.7 times, which generally follows the nationwide trend. Extrapolation of the obtained data series shows that the upward trend will remain in the following years.
Higher household consumption of Internet services is ensured by rapid spread of 4G standard for high-speed wireless communication (4G LTE) which helps reduce the cost of data transfer services by 6 times compared to 3G, which ultimately reduces the cost of mobile Internet and television for final consumers. At the end of 2014, the Sverdlovsk Oblast ranked fourth among Russian regions by number of base LTE stations per 1,000 people with an indicator amounting to 1,072; the leader is Moscow with 6,763 base stations per 1000 people [16].
Rosstat statistics also show a slight change in the cost of communication services even in the crisis period 2014–2015 ( Tab. 4 ).
Thus, the cost of local telecommunication services in the Sverdlovsk Oblast amounted to 103.2% in 2015 compared with the previous period, the monthly subscription fee for using mobile Internet – 102.3%, the monthly subscription fee for Internet access – 101%.
The share of communication expenses in population’s consumer expenses is constantly decreasing. Thus, in 2009, it comprised an average of 3.8% in Russia as a whole and in 2015 fell to 3.2%. In the Sverdlovsk Oblast the highest share of services in population’s consumption expenditures was observed in 2011 – 4%, then it gradually declined to 2.8% in 2015.
As shown by regression analysis, the proportion of expenditures on communication
Table 4. Cost and volume of communications services in the Sverdlovsk Oblast in 2010–2015
|
Year |
Change in the cost of local telecom services (% to the previous period) |
Change in subscription fees for using mobile Internet, per month (% to the previous period) |
Change in subscription fees for Internet access, per month (% to the previous period) |
Services provided to the population, per one citizen (rubles) |
|
2010 |
110.8 |
91.7 |
4537.9 |
|
|
2011 |
108.8 |
99.3 |
4774.7 |
|
|
2012 |
106.1 |
98.7 |
5372.1 |
|
|
2013 |
106.1 |
100.8 |
5666.9 |
|
|
2014 |
101.6 |
102.5 |
101.5 |
5413.5 |
|
2015 |
103.2 |
102.3 |
101.0 |
5480.2 |
|
… – no information. |
||||
Table 5. Distribution of population groups depending on income level and cost of telecommunication services in 2015, % of the number of respondents
|
Monthly expenditures on communication services, rubles |
Financial capacity self assessment |
||||
|
Not enough money for anything |
No money expect for food and bare essentials |
Enough money to buy clothing and household appliances |
Enough money to buy a car and accommodation |
Enough money for anything |
|
|
Less than 300 |
16.2 |
13.4 |
3.6 |
2.4 |
4.8 |
|
300–500 |
28.4 |
25.1 |
25.6 |
7.3 |
11.3 |
|
501–1000 |
40.5 |
39.2 |
45.2 |
29.3 |
37.1 |
|
1001–1500 |
8.1 |
12.5 |
15.8 |
19.5 |
21.0 |
|
1501–2000 |
5.4 |
6.3 |
8.3 |
22.0 |
9.7 |
|
2001–3000 |
0.0 |
1.6 |
1.2 |
9.8 |
3.2 |
|
More than 3000 |
1.4 |
1.9 |
0.3 |
9.8 |
12.9 |
services depends primarily on the cost of communication services (R2 = 0.7676) and does not depend on an increase in household consumer expenditures as a whole.
According to some research, the share of consumer expenditures on information and communication services or the revenues of IC grow at a higher rate (3.86 times) than per capita GDP (3.66%) [14, p. 40].
Correlation analysis of survey results showed the dependence of the monthly expenditures on communication services on characteristics such as age (Cramer’s V=0.159, significant) and income level (Cramer’s V=0.185, significant). For example, 81% of respondents aged 60–75 spend not more than 1,000 rubles a month on services related to information con- sumption, while 28% of young and 29% of middle-aged people spend 1,000–3,000 rubles and more.
Table 5 shows that high-income population groups spend the greatest amount of money on satisfying their communication needs. 22% of those who can afford buying durable goods spend 1,500–2000 rubles a month on information services; however, the same share among low-income population groups amounts to 5.4%.
Conclusion
The use of IC devices and services in information economy remains quite dynamic. Analysis showed that over the past 10–15 years there have been constant changes in the structure of household consumption of information goods due to the fairly rapid emergence of new devices (e.g. smart TV) and services (mobile Internet, broadband) and “moral depreciation” of old devices and services (VCRs, landline communications, etc.).
The identified trends help draw conclusions about the further increase in the number of “basic” IC devices such as TV sets, PCs, cell phones in households; all these devices are gradually moving from being commonly used by households towards the category of personal use. Although in general, consumption of IC devices in the Sverdlovsk
Oblast follows national trends, there is a number of regional characteristics such as higher growth rate of the number of PCs in households and downward trends in the number of cell phones.
Dynamics of consumption of IC services are also associated with the increased use of their most modern types – digital TV, mobile communication, broadband – with simultaneous negative dynamics of radio broadcasting and landline communications. In the Sverdlovsk Oblast, these trends are even stronger than in Russia in general. The increasing disparities between urban and rural settlements of the Sverdlovsk Oblast in terms of coverage of all types of IC services should also be noted.
The analysis has helped identify the main factors influencing the consumption of IC devices and services: consumers’ age, place of residence (city, village) and level of income.
Further development of information economy in Russia in general and in the Sverdlovsk Oblast in particular is directly correlated with consumption of information goods, including auxiliary ones. This requires deeper analysis of the processes by the economic science, as well as strengthened measures from public authorities on the development of the information infrastructure in the region.
References Structure and dynamics of household consumption of information goods: regional perspective
- Antipina O.N. Tsenoobrazovanie v informatsionnoi ekonomike. avtoref. dis. na soisk. uch. st. d-ra ekonom. nauk . Moscow, 2009. 53 p..
- Astashova Yu.V. Analiz transformatsii povedeniya pozhilykh potrebitelei v ramkakh kontseptsii gerontomarketinga . Naukovedenie, 2015, vol. 7, no. 4 (29), pp. 1-9..
- Atlas rynka uslug platnogo televideniya v Rossii, 2014-2020 gg. Itogi 2015 goda . Available at: http://json.tv/ict_telecom_ analytics_view/atlas-platnogo-televideniya-rossii-2014-2020-gg-itogi-2015-goda-20160422125121 (Accessed: 10.09.2016)..
- Bairamukova A.S. Rynok informatsionnykh produktov i uslug: osobennosti formirovaniya, struktura . Prostranstvo ekonomiki , 2008, no. 2-3, pp. 65-68..
- Bell D. Gryadushchee postindustrial'noe obshchestvo. Opyt sotsial'nogo prognozirovaniya: per. s angl. . Translated from English. 2nd edition, revised and updated. Moscow: Academia, 2004. 788 p..
- Vishnevskaya E.L. Dinamika struktury potrebleniya v informatsionnom obshchestve: avtoref. dis. na soisk. uch. st. k.e.n. . Moscow, 2015..
- Eremin V.N. Marketing: osnovy i marketing informatsii: uchebnik . Moscow: KNORUS, 2009. 656 p..
- Dinamika potrebleniya naseleniya Rossii v usloviyakh krizisa: byulleten' sotsial'no-ekonomicheskogo krizisa v Rossii . Moscow: Analiticheskii tsentr pri Pravitel'stve Rossii, 2015, no. 4, 23 p..
- G.I. Abdrakhmanova, Gokhberg L.M., Kevesh M.A. et al. Indikatory informatsionnogo obshchestva: 2016: statisticheskii sbornik . Moscow: NIU VShE, 2016. 304 p..
- Castells M. Informatsionnaya epokha: ekonomika, obshchestvo i kul'tura . Translated from English. Moscow: GU-VShE, 2000. 608 p..
- Kuzovkova T.A., Zhenchur M.A., Kuzovkov A.D. Metodicheskii apparat kompleksnogo prognozirovaniya razvitiya infokommunikatsii . Sistemy upravleniya, svyazi i bezopasnosti , 2016, no. 1, pp. 146-190..
- Kuzovkova T.A. Transformatsiya modeli proizvodstva i potrebleniya infokommunikatsionnykh uslug.//T-Comm. 2014. V. 8. P. 54.
- Manakhova I.V. Transformatsiya potrebleniya v informatsionnoi ekonomike: avtoref. dis. na soisk. uch. step. d-ra ekonom. nauk . Moscow, 2014. 26 p..
- Manakhova I.V. Transformatsiya sotsial'no-ekonomicheskogo soderzhaniya potrebleniya . Izvestiya Saratovskogo un-ta. Ser.: Ekonomika. Upravlenie. Pravo , 2012, vol. 12, no. 4, pp. 38-40..
- Operatory razduvayut abonentskie bazy . Vedomosti, 2016, no. 4054, April 13..
- Osnovnye pokazateli rynka fiksirovannogo ShPD v Rossii. Prognoz razvitiya do 2025 goda . Available at: http://json.tv/ict_telecom_analytics_view/osnovnye-pokazateli-rynka-fiksirovannogo-shpd-v-rossii-prognoz-razvitiya-do-2025-goda-20160203113313 (Accessed: 10.09.2016)..
- Ofitsial'nyi sait Federal'noi sluzhby gosudarstvennoi statistiki . Available at: http://www.gks.ru..
- Pogudaeva M.Yu., Semenova-Slabkovich Ya.A. Osobennosti povedeniya potrebitelya v usloviyakh informatsionnoi ekonomiki . Ekonomicheskii zhurnal , 2012, no. 28, pp. 96-104..
- Radina N.K., Shaidakova N.V., Mokhnatkina I.N. Demonstrativnoe povedenie sovremennykh podrostkov: sotsial'no-psikhologicheskie osobennosti . Sotsial'naya psikhologiya i obshchestvo , 2013, no. 1, pp. 52-66..
- TMT-reiting: Rossiiskii rynok ShPD v segmente «Naselenie» -itogi 2 kvartala 2016 goda . Available at: http://tmt-consulting.ru/napravleniya/telekommunikacii/tmt-rejting-rossijskij-rynok-shpd-v-segmente-naselenie-itogi-2-kvartala-2016-goda/(Accessed: 10.09.2016)..
- Furkin B.A. Simvolicheskoe potreblenie i chelovek v informatsionnom obshchestve . Vestnik MGUKI , 2012, no. 6 (50), pp. 45-50..
- Gille L., Marti R., Zmiro D. Information and communication technologies. Positive effects on employment. SESSI, 2000, no.133.
- Horrigan John B. Consumption of information goods and services in the U.S. Pew Research Centre. 2003. November 23. Available at: http://www.pewinternet.org/2003/11/23/consumption-of-information-goods-and-services-in-the-u-s/(Accessed: 10.09.2016)
- Milovantseva N. Are American households willing to pay a premium for greening consumption of Information and Communication Technologies? Journal of Cleaner Production, 2016, vol.127, pp. 282-288.
- Porat Mark Uri. The Information Economy: Definition and Measurement. Washington: U.S. Dept. of Commerce, Office of Telecommunications, 1977.
- Vourvachaki E. Information and Communication Technologies in a Multi-Sector Endogenous Growth Model. CERGE-EI -2009. May. P. 2.
