Studies on ICT Usage in the Academic CampusUsing Educational Data Mining

Author: Ajay Auddy, Sripati Mukhopadhyay
Journal: International Journal of Modern Education and Computer Science (IJMECS) @ijmecs
Article in issue: 6 vol.6, 2014.
Free access
Inthe era of competition, change and complexity, innovation in teaching and learning practices in higher education sector has become unavoidable criteria.One of the biggest challenges that higher education system faces today is to assessthe services provided through Information and Communication Technology(ICT) facilities installed in the campus. This paper studies the responses collected through survey on ICT, in the campusof the University of Burdwan, among the students and research scholarswith the help ofan effective data mining methodology - Variable Consistency Dominance-based Rough Set Approach (VC-DRSA) model to extract meaningful knowledge to improve the quality of managerial decisions in this sphere. It is an extended version of Dominance Rough Set Approach (DRSA) and is applied here to generate a set of recommendations that can help the university to improvise the existing services and augmenting the boundaries of ICT in future development.
Information & communication Technology (ICT), Educational Data Mining (EDM), Variable Consistency Dominance-based Rough Set Approach (VC-DRSA), educational survey
Short address: https://sciup.org/15014659
IDR: 15014659
Text of the scientific article Studies on ICT Usage in the Academic CampusUsing Educational Data Mining
Educational Data mining analyses data in large educational databases that has meaningful and understandable information that seems to be unpredictable apparently. EDMs uses methodologies such as Decision Trees, Neural Networks, Naïve Bayes, K- Nearest neighbour, Support Vector Machines (SVM), Rough Set Theory (RST), Genetic Algorithm (GA), Treebased Classifiers and Fuzzy Logic are few of them to discovers hidden patterns, which equip the higher educational system in making concrete decisions and provide useful inputs to improve students-facultiesrelationship, to analyses student performance, to detect unpredictable student relationships, to build up educational decision-support system, to study faculties performance on basis of student’s feedback and so on [1,2].
In this paper, to elaborate the effectiveness of data mining techniques in EDM, we analysed the feedback given by the students and research scholars to assess the ICT at the academic campus of the University of Burdwan. The VC-DRSA model, as a useful data mining tool, has been applied to identify valuable strengths and weaknesses in this sector of the university to enable decision-makers to take highly effective decisions.
The rough set, as described by Zdzislaw I. Pawlak, is a new mathematical approach for studying imprecision, vagueness and uncertainty in data analysis[3]. The Classical Rough Set Approach (CRSA) classified objects on the basis of indiscernibility of the sets of condition attributes ignoring preference-ordered domains. Thus it has the limitation of handling inconsistency arising out of dominance principle [4]. Transition took place from the indiscernibility relation to the dominance relation, permitting to deal with inconsistencies with the emphasis on criteria and preference-ordered decision classes.Multiple-criteria decision analysis (MCDA) considersmultiple conflicting criteria that need to be evaluated in making decisions [4]. Therefore, Dominance-based Rough Set Approach (DRSA), that handles MCDA problems comprising of multiple criteria objects having conflicting goals [4,5,6]. But in real datasets, application of strict dominance principle is unacceptable as it create large differences between lower and upper approximations of decision classes [7]. In consequence, decision rules induced from lower approximations are weak which are supported by few objects only. Therefore, an extension of DRSA, called VC-DRSA, developed by Greco and others (2001), enables relaxation of the conditions for assignment of objects to lower approximations thus allowing certain degree of inconsistency in lower approximations of sets. A parameter known as consistency level (l) is used to control the level of inconsistency in the sets [7].
-
II. Information and Communication Technology (ICT)
Using broader definition, the term “Information and Communication Technology” (ICT) refers to the assimilation of technologies that are responsible to transmit, process, store, create, display, share or exchange information electronically. It refers to technologies such as Internet, wireless networks, mobiles and other advance communication media that provide access to information. It includes equipments as well as services/facilities such as videoconferencing, repositories, etc. to build up the integrated infrastructure to deliver knowledge in fraction of seconds.
Thus, ICT is a combination of (i) physical devices such as computers, (ii) logical components i.e. softwares, (iii) communication infrastructures such as routers, switches, access points for WI-FI connectivity, satellite systems, etc. and (iv) multimedia devices such as camera, sound system, etc. that facilitate us to create, communicate, retrieve, store, and manage information.
ICT encompasses science, technology as well as social sciences on an integrated platform which inturn coordinates and monitors every research and development activities to make this society aware of the present trends. Every country has undertaken various initiatives to increase the inherent strength and technological capacity of ICT to enable the nations to explore the unexplored[8].
Keeping in view, the ICT initiatives taken up by different government agencies of India, the universities, in particular, are gradually building up the ICT infrastructure rapidly, to spread the benefit of ICT across the stakeholders and forcing their affiliated institutions to be in synchronous with these activities. It has acts as a catalyst in education delivery process and proved to be a cost-effective tool in spreading education using virtual classrooms thus making knowledge distribution approachable to the remote regions which was unbelievable even few years back. Thanks to the ICT era.
In respect to the HEI, bonding of education and technology has opened up the opportunities for students and research communities to reach the unreached in terms of educational resources. Nowadays all higher education institutions are well-equipped with ICT infrastructures to act as a driving force to integrate the campus and the educational world. Advantages of ICT implementation are the installation of virtual classroom, access to e-resources (e-books, e-contents, e-journals), conduction of e-courses, creation of e-contents by faculties, interactions among people belongs to same/different domain(s), etc.
-
III. Variable Consistency Dominance-based Rough Set Approach (VC-DRSA) [4,5,6,7,9,10]
We are presenting here the basic theory of VC-DRSA in brief and the details of it can be had from the above mentioned references.
A VC-DRSA decision table is a 4-tuple S = U,Q,V, f , where U is a finite set of objects, Q is a finite set of criteria, V = q g q V q where V q is the domain of the criterion q and f : U x Q ^ V is an information function such that f(x, q) G V q for every (x,q) G U x Q . The set Q is divided into condition criteria set ( C Ф ф ) and the decision criterion ( class ) d . Notice, that f(x,q) is an evaluation of object x on criterion q G C , while f(x, d) is the class assignment (decision value) of the object.
Let the domain of a criterion q G Q is completely preordered by an outranking relation > q ; x > q y means that x is at least as good as (outranks) y with respect to the criterion q . Decision attribute d divides U into a finite number of Cl = {Clt, t G T}, T = {1,..., n }. Each x G U belongs to one and only one class Clt G Cl .
The classes are preference-ordered according to an increasing order of class indices, i.e. for all r , s G T such that r > s , the objects from Cl r are strictly preferred to the objects from Cls . Therefore, the upward and downward unions of classes are represented as followed:
Cl t = Us > tCls,Cl f = Us < tCls, t=1,...n (1)
The object x dominates object y with respect to P c C is denoted by xD p y, if x is better than y on every criterion q g P. For each P c C, the dominance relation D P is reflexive and transitive, which is known as partial preorder . Given P c C and x g U, let
D P(x) = { y g U : yD p x } , D p (x) = { y g U : xD p y }
represents the P-dominating set and the P-dominated set with respect to x g U, respectively.
In VC-DRSA, the knowledge being approximated is a collection of upward and downward unions of decision classes and the "granules of knowledge" used for approximation are P -dominating and P -dominated sets.
For any P — C, x e U belongs to Clt with no ambiguity at consistency levelle (0, 1], if x e Clt and at least l* 100% of all objects y e U dominating x with respect to P also belong to Clt, thus card(D+(x) n Clt ) 11 card(DP+(x)) (4)
The level l is called consistency level because it controls the degree of consistency between objects qualified as belonging to Cl t without any ambiguity.
Similarly, same definition is valid for Cl< t keeping all conditions the same as above, i.e.
card(D" p (x) n Cl t ) t l card(D" p (x))
Thus, for any P — C, each object x e U is either ambiguous or non-ambiguous at consistency level l with > respect to the upward union Cl t (t=2,...,n) or with respect to the downward union Clst (t =1,...,n -1).
The definitions of P-lower approximations of the unions of classes Clt and Cl5t are defined as
P(Cl t ) = ^ x e Cl ;
P_(Cl t ) = ^ x e Cl ;
card(D+p(x)n Clt) > l\ card(D+(x)) " /, card(Dp (x) n Clt P ,1
-----—-----> l card(Dp (x))
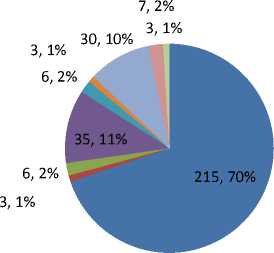
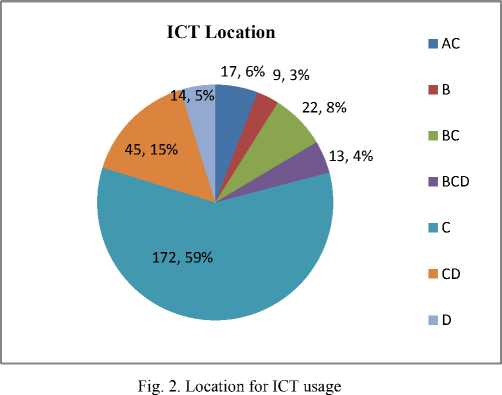
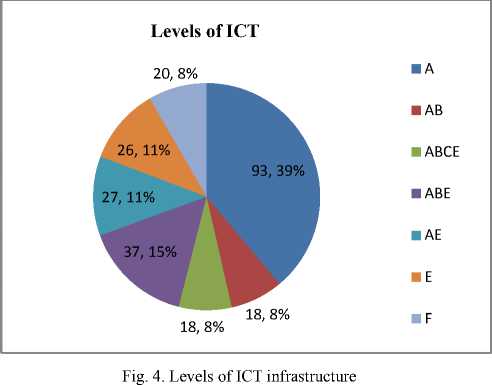
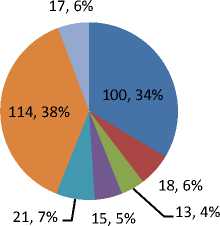
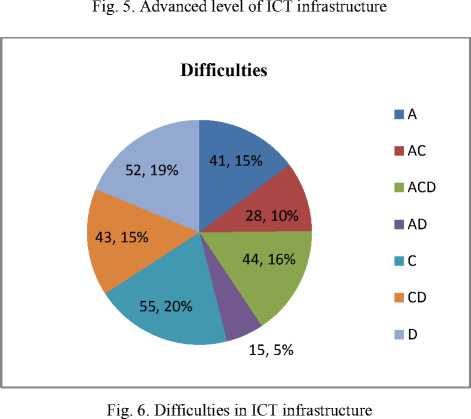
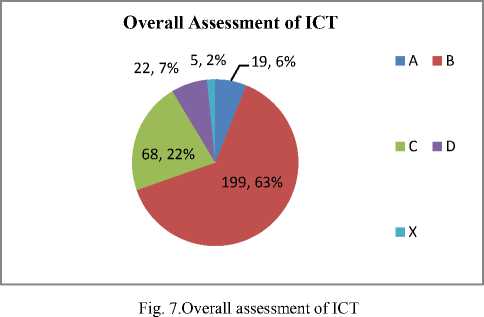
The P-upper approximations of Clt and Cl P(Clt) = U - PC1).(8) p'tCl't) = U - Pl(Clt+i). The P-boundaries (P-doubtable region) of Cl t and Cl t are defined as Bn,(Clt )=р'(еГ()- P(at)(10) Bn,(Clt )=~P‘(Clt) - P(Clt) t< The accuracy of approximation of Cl t and Cl t for all t e {1,. .., n} and for any P —C, respectively, as a p(Clt ) = P(Clt) P(Clt) , ap(Clt) = P(Clt) PC) . (12) The ratio γp(Cl)= U - (U BnpCCl,)) teT UI U-(U BnpCCl,)) ________teT___________________ UI defines the quality of approximation of the classification Cl by means of the criteria from set P — C. This ratio expresses the relationship between all the P-correctly classified objects i.e. whichrepresent certain knowledge and all of the objects in the data table. Finally, the approximations of upward and downward unions of classes, which are discussed above, results in the generation of “if…then…” decision rules. In the VC-DRSA context each decision rule is supported by a parameter α known as confidence of the rule which is the ratio of the number of objects supporting the rule and the number of objects covered by the rules. The following two types of decision rules can be considered: 1. Certain Dt: decision rules that have the following form: 2. Certain D< : decision rules that have the following form: f (x, q1) t rq1 and f (x, q2) t rq2 and. . . f (x, qp) t rqpthen x e Cl Г with confidence a. These rules are supported only by without ambiguous objects from P-lower approximations of the upward unions of classes Cl Г . f (x, q1) < rq1 and f (x, q2>< rq2 and . . . f (x, qp) < rqpthen x e Cl < with confidence a. These rules are supported only by without ambiguous objects from the P-lower approximation of the downward unions of classes Cl f. Here P = {qi,qa, .. qk,qk+i,qk+2,^. , qp} c C, (rqi, rq2, . . . , rqp) G Vq1 XVq2 X... XVqp and t G {1, . . . , n}. These rules are supported only by objects from the P-boundaries of the unions of classes Cl ? and Clf. Table I: Distribution of respondents Departments Ph.D. PG Total Library & Information Science 5 36 41 Mathematics 5 55 60 Statistics 1 26 27 Biotechnology 0 39 39 Environmental Science 3 22 25 Chemistry 25 0 25 Computer Science 0 14 14 Microbiology 9 16 25 Botany 5 19 24 Physics 5 0 5 Zoology 3 0 3 Journalism & Mass Communication 1 24 25 It is to be noted that in DRSA, the confidence α of the decision rule is equal to 1. In VC-DRSA, the rules induced from P-lower approximations are controlled by the user-defined consistency level l, thus the confidence degree of the rule is always greater than or equal to the l. IV. Designing of questionnaire for survey on ict in THE UNIVERSITY In this paper, a questionnaire has been constructed keeping in view the students’ and research scholars’ communities of the higher educational institutions like Universities to understand their broad concept about ICT, their participation in ICT usage, their satisfaction level in respect to the current ICT infrastructure. The following paragraphs discuss the designed questionnaire in elaborate manner. A. Factors Overall 17 questions are framed considering the following factors: a) Type of media b) Time-span for usage c) Purpose of use d) Availability e) Lacuna in infrastructure f) Perception of faculties in this regard g) Area for description, if any Multiple/single selection, based on the type of question, is recommended. Moreover, at the end of the questionnaire, space has been provided for opinion, if desire by the respondents, in addition to the prescribed questions. B. Discussion on Questions Discussion on the questions is given below: Q1. asks about the purpose of the ICT usage. Q2. asks about the locations from where they access the ICT. Q3. asks about whose systems they use to access the ICT. Q4. asks about the access duration of ICT. Q5. asks about uninterrupted power backup to the ICT infrastructure. Q6. asks about any extra fees to be paid for using ICT. Q8. asks about the frequency of accessing social networking sites from campus. Q9. asks about how this ICT infrastructure supports faculties in education delivery process. Q10. asks about how frequent do you access ematerials such e-journals, e-books, etc. through this ICT infrastructure. Q11. asks about the e-contents are accessible through ICT. Q12. asks about the facilities through ICT provided by the university. Q13. asks about the satisfaction of the e-journals subscription of the undertaken subjects. Q14. asks about the advanced level of ICT support such as central repository system, computing softwares, etc. Q15. asks about ICT facilitators. Q16. asks about the lacuna in the ICT infrastructure of the institute. Q17. asks about the overall assessment of the stakeholders i.e. students and research scholars regarding ICT facilities. C. Discussion on Data Collected V. Results And Discussion It is to be noted that both the students and research scholars of different departments of the University of Burdwan are taken up for this survey. The analysis of various questions is presented here with user-friendly visualizations. Questionnaire presented at the end of the paper is to be referred to understand the choices associated with the questions. For space limitation, we have used indicative values instead of detailed choices. Total respondents are 313 in all. A. Analysis of non-ordered attributes in the data table 163 or 53% respondents have selected information and education togetheras the reasons for their ICT access from the University campus. Next, 83 or 27% respondents have selected only education as the reasons for their ICT access. Similarly, other areas show the shares of their respective reasons for their usage. Only 11% of respondents have selected entertainment as their usage. It can be concluded in this regard that informative and educational factors are the prime reason for usage of the ICT among the stakeholders.Fig. I gives the overall picture of the response inthis regard. 172 or 59% of respondents are usingdepartmental ICT facility for their usage and ICT-based activities. Next, 45 or 15% respondents are usingboth departmental and WIFIfacility for their ICT-based activities. Only 5% respondents are utilizing wireless network for their activities. It is also to be noted that the WIFI facility is not provided to all the places in the campustill the date of survey. It can be concluded in this regard that collective usage of departmental and WIFI facilities has got distinctive emphasis. Fig. II gives the overall picture of the response in this regard. ICT-System Used respondents are using their personal systems to access ICT facilities. It can be concluded in this regard that the systems belong to the university are under high demand among the stakeholders within the campus. Fig. III gives the overall picture of the response in this regard. This question asked about the levels of support that are provided by the university through ICT infrastructure. In today’s scenario this parameter has prime importance in respect to the utilization of modern technology during imparting education system. 39% of respondents are using ICT to access the web only. 15% of respondents are usingICT to access the web, subscribed e-journals and to access educational activities like seminars, conferences, examination, etc. 8% of respondents have said that they didn’t avail of any facilities though ICT i.e. they are completely ignorant about this technology availability in the campus. Moreover, awareness campaign among these communities is recommended to the authority to take this existing infrastructure utilization to the optimum level. Fig. IV gives the overall picture of the response in this regard. ■A ■ AB ■ ABC ■ AC ■ AD ■ BC ■ c ■ CD ■ X 215 or 70% of respondents are using University’s resources to access ICT facilities. Next, 35 or 11% respondents are using both university and personal systemsto access ICT-based activities. 30 or 10% Fig. 3. System used This question asked about the advance levels of support that are provided by the university through ICT infrastructure similar to the previous parameter. 38% of respondents have opined that none of the advance ICT services such as availability of computational software for its courses, central repository system and individual space with security feature, is available in the university. 34% of respondents have supported the software availability, required for their courses through ICT. Fig. V gives the overall picture of the response in this regard. ICT: Advance Level ■ A ■ AC ■ C X 20% of respondents have indicatednetwork problem as the main difficulty in using ICT service. 19% of respondents couldn’t specify exact difficulty they face during ICT usage. 16% respondents have indicated technical, network and availability of computers as the difficulties they face to access ICT. It can be concluded in this regard that collective as well as individual difficulties have hindered the spread of the ICT usage among the stakeholders within the campus. Fig. VI gives the overall picture of the response in this regard. Ultimate opinion about the overall assessment about ICT in their University is clearly visible from the pie chart. 63% of respondents are satisfied with services provided through ICT and its underlying infrastructure. 22% of respondents are dissatisfied with services provided through ICT and its underlying infrastructure. Only 6% of respondents have assessed is as excellent.It is to be noted in this regard that 7% of respondents are unable to assess the scenario.Fig. VII gives the overall picture of the response in this regard. B. Implementation of VC-DRSA on ordered attributes Data collected from the respondents (students and research scholars) after distributing the questionnaires among them will highlight the strength and lacuna of the ICT acceptability among the targeted stakeholders in the university. Suitable data analysis tools i.e. VC-DRSA algorithm is applied on the collected data to reflect the expectation as well as requirement level of the students and research scholars. ■ AB ■ В ■ D We use jMAF software, developed by Laboratory of Intelligent Decision Support Systems (IDSS) underInstitute of Computing Scienceof thePoznan University of Technology for our research work. It is a Rough Set Data Analysis Framework written in Java language using java Rough Set (jRS) library. jMAF and jRS library implement methods of analysis provided by the Variable Consistency Dominance-based Rough Set Approach [11]. Table II shows the Attributes in the Information Table. From next paragraph onwards, the results of the application of VC-DRSA are expressed in systematic manner using different formats using jMAF system. The Table II: Classification on the basis of approximation C. Unions of Classes Emphasis to be given on the sets of objects which are approximated as upward union and downward union of classes based on decision attribute. The preference-ordered according to a decreasing order of decision classes are A (Excellent) to X (Unreplied). In Table - II, the union of all decision classes are shown. “at most X” class is the Unreplied class means students skip to assess the ICT of the University. “at most D” class includes Not replied, Can’t assess decision classes and 27 students got included in this class. “at most C” class includes Not replied, Can’t assess and Dissatisfactory decision classes and 95respondents support these classes. “at least C” class comprises of Dissatisfactory, Satisfactory and Excellent decision classes and 286respondents got included under these decision classes. “at least B” means Satisfactory and Excellent classes and 218respondents support it. “at least A” class means Excellent i.e. overall subjective assessment about the ICT in the University is under excellent category and 19respondents support this decision class. D. Classification on the basis of approximation In VC-DRSA, the knowledge being approximated is a collection of upward and downward unions of decision classes and the "granules of knowledge" used for approximation are P-dominating and P-dominated sets. Table–II shows cardinality, P-lower approximation, P-upper approximation, P-Boundary and their corresponding quality of approximation. The result shows high quality of approximation which indicates that the objects are correctly classified by means of the attribute from P. For “at most X” class, P-lower approximation and P-upper approximation are 5 and 5 respectively. P-boundary is 31. Thus the accuracy of approximation is .139. For “at least D” class, P-lower approximation and P-upper approximation are 277 and 308 respectively. P-boundary is 31. Thus the accuracy of approximation is 0.899. For “at most D” class, P-lower approximation and P-upper approximation are 27 and 32 respectively. P-boundary is 5. Thus the accuracy of approximation is 0.844. For “at least C” class, P-lower approximation and P-upper approximation are 281 and 286 respectively. P-boundary is 5. Thus the accuracy of approximation is 0.983. For “at most C” class, P-lower approximation and P-upper approximation are 95 and 95 respectively. P-boundary is 0. Thus the accuracy of approximation is 1.0. For “at leastB” class, P-lower approximation and P-upper approximation are 218 and 218 respectively. P-boundary is 0. Thus the accuracy of approximation is 1.0. For “at most B” class, P-lower approximation and P-upper approximation are 291 and 294 respectively. P-boundary is 3. Thus the accuracy of approximation is 0.990. For “at leastA” class, P-lower approximation and P-upper approximation are 19 and 22 respectively. P-boundary is 3. Thus the accuracy of approximation is 0.864. The overall quality of approximation ( γP(Cl) ) is 0.885. E. Reducts and Core The term REDCl(P)defines the subset C of P such that the quality of approximation remain unchanged i.e. thatγP(Cl ) = γC(Cl). In this study, 15 attributes are considered of which one is decision attribute. Here, calculation of reducts from the information table and after thorough examination of the information table, noreduct has been evolved. Moreover, here only one core of the system has been generated. It is to be noted that these attributes/criteria are inevitable in this process and leaving out any of them will hamper the quality of classification.Table IV has shown the Reducts and Core along with the number of attributes in it. F. Decision rules In this analysis, minimal decision rules are generated which is the ultimate strength of this model. Total number of decision rules generated is63: 31 rules under “Certain at least rules” and 32 rules under “Certain at most rules”. Table V contains some of the decision rules along with its explanation and values of its strength, support, coverage and confidence. The “if...then...” rules express the hidden knowledge of the data sets which are apparently impossible to apprehend. The generated rules are in natural language format which are more understandable and applicable in the decision-making process. G. Rule validation For VC-DRSA, the correctly classification is 86.051%, the incorrectly classification is 17.891% and the unknown classification is 14.058%. The average classification accuracy is 44.577% and the average precision is 57.079%. The following tabular formats show confusion matrix,accuracy percentageand detailed accuracy by classes through the application of the 10-fold cross-validation technique. Stratified cross-validation Correctly Classified Instances 213 68.051 Incorrectly Classified Instances 56 17.891 Unknown Classification Instances 44 14.058 Average Classification Accuracy 44.577% Average Precision 57.079% RMSE 0.6925 MAE 0.2862 Detailed Accuracy By Class TP Rate FP Rate Precision Class 0.0000 1.0 0.0 X 0.2500 0.75 0.8 D 0.7455 0.2545 0.7885 C 0.9209 0.0790 0.8109 B 0.3125 0.6875 0.4545 A === Confusion matrix === 0 0 0 5 0 0 4 3 9 0 0 0 41 14 0 0 1 7 163 6 0 0 1 10 5 H. Comments by the respondents Here, we are presenting few of the opinions as given by the respondents in their own language: “Number of subscribed e-journals should be increased (especiallyELSEVIER). Different or extra server for university research scholar is required to avoid network congestion with login ID. Number of computers should be increased. There should be technical persons regarding computer-related and networking. UPS backup should be provided with long duration. This infrastructure is excellent for our education purpose. ICT facilities are required for all institution of study. In this advance days, ICT provides various knowledge to satisfy our studies and it helps us to communicate with our studies and is helps us to communicate with our social network. It is must needed for all students.” I. Recommendations to the authority The abovesub-sections discussed and analysed the given feedback by the respondents. We have given separate analysis on non-ordered attributes with visualizations. The purpose of this paper is not only to discuss the feedback collected but also to forward certain recommendations about the ICT to the university authority to facilitate decision-making process. The recommendations are as follows: a) High bandwidth internet connectivity to be provided in the campus. b) High quality e-journal subscriptions are the demand of the research scholars across the subjects through campus ICT facility. c) Nowadays, students do not look at ICT as the media for internet access but also expects several value added services like central repository system, computational softwares, lectures using virtual classrooms, through ICT in the campus. This requires adequate hardware and software installation and upgradation to accommodate these services. d) Faculties have the prime responsibility to encourage ICT based learning among the students’ community to make them understand that ICT can be ideal facilitator in imparting knowledge. e) Extension of network infrastructure to all the students’ hostels both boys and girls to avoid dependency on departmental facilities. f) WIFI connectivity should be provided campus-wide instead of restricting within few selected departments. g) Implementation ofpackets filtering devices such as UTM (Unified Threat Machine) to restrict unwanted packets, thus allowing only authorised and valid packets into the campus-wide network. This would help in maintaining proper bandwidth management in the university network. h) Nowadays, students are forming teams to undertake industrial projects in collaboration with public as well as private players where ICT support is prerequisite. It is highly desirable to have anICT based integrated development platform present in the campus otherwise they have to manage from external service providers. The authority should take care to encourage this effort by providing up-to-date ICT infrastructure in this regard. i) Every departments should have well-equipped technical person(s) to handle local technical problems instantly to reduce the dissatisfaction level among the students and research scholars. It is also to be emphasised that the proper coordination between the departments and central ICT facility centre has to be established to overcome any technical slack in the ICT system. Table III: Attributes in the Information Sl. No. Attributes Values Preferences 1 Department name Department name None 2 Course name {Ph.D., M.Sc., M.A.} None 3 Reason for ICT usage {A,B,C,D} None 4 System used {A,B,C,D} None 5 Location to access ICT {A,B,C,D,E} None 6 Duration of ICT access {A,B,C,D} Ordered, cost 7 UPS support during power cut {A,B} Ordered, cost 8 Fee for ICT usage {A,B} Ordered, gain 9 Do’s & don’t {A,B,C} Ordered, cost 10 Access to Social Networking sites {A,B,C,D,E} Ordered, cost 11 ICT support in teaching process of faculties {A,B,C} Ordered, cost 12 Online library resources {A,B,C,D,E} Ordered, gain 13 Social network to discuss course-related resources {A,B,C,D,E} Ordered, gain 14 email to discuss course-related resources {A,B,C,D,E} Ordered, gain 15 Submit work/assignment online {A,B,C,D,E} Ordered, gain 16 Lecture notes, slides, etc. {A,B,C,D,E} Ordered, gain 17 Access e-contents for the course {A,B} Ordered, cost 18 Levels of ICT support {A,B,C,D,E,F} None 19 e-journals subscription {A,B,C} Ordered, cost 20 Advance levels of ICT support {A,B,C,D} None 21 ICT for learning {A,B,C} Ordered, cost 22 Difficulties in ICT usage {A,B,C,D,E} None 23 Assessment about ICT infrastructure {A,B,C,D} Ordered, cost Table IV: Reducts and Core Name Cardinality Content Core 14 at4,at5,at6,at7,at8,at9,at10,at11,at12,at13,at14,at15,at17,at19 Reduct 0 Table V: Decision rules with maximum support for each decision class Decision Rules Explanation Support Strength Confidenc e Coverage (at14 >= C) & (at17 <= A) => (d <= B) |CERTAIN, AT_LEAST, B| If A14 is “Sometimes” and A17 is “yes”then theassessment is at least SATISFACTORY 72 0.230 0.973 74 (at7 <= B) & (at14 >= B) & (at17 <= A) => (d <= B) |CERTAIN, AT_LEAST, B| If A7 is “no” and A14 is “rarely” and A17 is ”yes” then theassessment is at least SATISFACTORY 67 0.214 0.971 69 (at5 <= A) & (at12 >= D) => (d <= B) |CERTAIN, AT_LEAST, B| If A5 is “yes” and A12 is “usually”then theassessment is at least SATISFACTORY 37 0.118 0.974 38 (at5 <= A) & (at7 <= B) & (at19 <= A) => (d <= B) |CERTAIN, AT_LEAST, B| If A5 is “yes” and A7 is “no” and A19 is ”ICT completely for learning” then theassessment is at least SATISFACTORY 59 0.189 0.983 60 (at5 <= A) & (at9 <= A) => (d <= B) |CERTAIN, AT_LEAST, B| If A5 is “yes” and A9 is “encouraging” then theassessment is at least SATISFACTORY 106 0.339 0.964 110 (at5 <= A) & (at7 <= B) & (at15 <= A) => (d <= B) |CERTAIN, AT_LEAST, B| If A5 is “yes” and A7 is “no” and A15 is ”yes” then theassessment is at least SATISFACTORY 85 0.272 0.955 89 (at5 <= A) => (d <= C) |CERTAIN, AT_LEAST, C| If A5 is “yes” then theassessment is at least DISSATISFACTORY 143 0.457 0.986 145 (at17 <= A) => (d <= C) |CERTAIN, AT_LEAST, C| If A17 is “yes” then theassessment is at least DISSATISFACTORY 99 0.316 0.980 101 (at7 <= A) & (at17 <= C) => (d <= C) |CERTAIN, AT_LEAST, C| If A7 is “yes” and A17 is “can’t say” then theassessment is at least DISSATISFACTORY 135 0.431 0.925 146 (at9 <= A) & (at13 >= B) & (at17 <= C) => (d <= C) |CERTAIN, AT_LEAST, C| If A9 is “encouraging” and A13 is “rarely” and A17 is ” can’t say” then theassessment is at least DISSATISFACTORY 124 0.396 0.961 129 (at15 <= A) & (at17 <= B) => (d <= C) |CERTAIN, AT_LEAST, C| If A15 is “yes” and A17 is “no” then theassessment is at least DISSATISFACTORY 158 0.505 0.963 164 (at7 <= B) & (at12 >= C) & (at15 <= B) => (d <= C) |CERTAIN, AT_LEAST, C| If A7 is “no” and A12 is “sometimes” and A15 is ”no” then theassessment is at least DISSATISFACTORY 130 0.415 0.949 137 (at4 <= B) => (d <= D) |CERTAIN, AT_LEAST, D| If A4 is “more than 10 hrs” then theassessment is at least UNABLE TO ACCESS 103 0.329 1.0 103 (at15 <= B) => (d <= D) |CERTAIN, AT_LEAST, D| If A15 is “no” then theassessment is at least UNABLE TO ACCESS 306 0.978 0.987 310 (at17 <= A) => (d <= D) |CERTAIN, AT_LEAST, D| If A17 is “yes” then theassessment is at least UNABLE TO ACCESS 100 0.319 0.990 101 (at10 <= D) & (at17 >= C) => (d >= B) |CERTAIN, AT_MOST, B| If A10 is “usually” and A17 is “can’t say” then theassessment is at mostSATISFACTORY 92 0.294 0.313 92 (at7 >= B) & (at17 >= B) => (d >= B) |CERTAIN, AT_MOST, B| If A7 is “no” and A17 is “no” then the assessment is at mostSATISFACTORY 95 0.304 0.979 97 (at5 >= B) & (at10 <= D) => (d >= B) |CERTAIN, AT_MOST, B| If A5 is “no” and A10 is “usually” then the assessment is at mostSATISFACTORY 137 0.438 0.979 140 (at5 >= B) & (at10 <= E) & (at11 <= C) => (d >= B) |CERTAIN, AT_MOST, B| If A5 is “no” and A10 is “always” and A11 is ”sometimes” then the assessment is at mostSATISFACTORY 136 0.435 0.978 139 (at4 >= C) & (at7 >= B) => (d >= B) |CERTAIN, AT_MOST, B| If A4 is “ less than 5 hrs” and A7 is “no” then the assessment is at mostSATISFACTORY 105 0.335 0.972 108 (at4 >= C) & (at8 >= B) => (d >= B) |CERTAIN, AT_MOST, B| If A4 is “less than 5 hrs” and A8 is “rarely” then the assessment is at most SATISFACTORY 126 0.403 0.962 131 (at10 <= D) & (at11 <= A) => (d >= B) |CERTAIN, AT_MOST, B| If A10 is “usually” and A11 is “never” then the assessment is at mostSATISFACTORY 116 0.371 0.967 120 (at10 <= E) & (at11 <= A) & (at13 <= B) => (d >= B) |CERTAIN, AT_MOST, B| If A10 is “always” and A11 is “never” and A13 is ”rarely” then the assessment is at mostSATISFACTORY 115 0.367 0.966 119 (at8 >= B) & (at11 <= C) & (at14 <= D) => (d >= B) |CERTAIN, AT_MOST, B| If A8 is “rarely” and A11 is “sometimes” and A14 is ”usually” then the assessment is at most SATISFACTORY 119 0.380 0.968 123 VI. Conclusion The feedback analysis has become an important academic activity in Universities nowadays.The above study appreciates the application of VC-DRSA to provide effective evaluation technique in the field of educational data mining for analysis of survey conducted among the students and research scholars in certain number of departments of the University of Burdwan on ICT facilities currently implemented in the campus with considerable deviation from the strict dominance principle using consistency level (l) to enhance the quality of the decision rules induced by the model. This study shall acquaint the academic managers of the University to be aware of the VC-DRSA methodology which is a modified version of DRSA where dominance principle and multiple-criteria decision problems are handled efficiently. In future, there is a further scope for the improvement of this educational activity with the application of data mining based multi-agent system to evolve more sophisticated and updated system for better result. ACKNOWLEDGEMENT We acknowledge the help received fromvarious academic departments of The University of Burdwan for their immense cooperation in conducting this survey among the students and research scholars.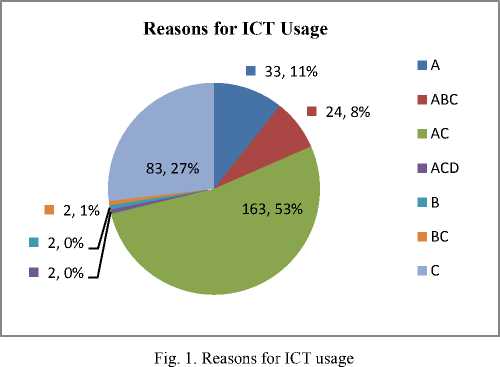
Accuracy
Cardinal ity
Lower
Upper
Bound ary
At most X
0.139
5
5
36
31
At least D
0.899
308
277
308
31
At most D
0.844
27
27
32
5
At least C
0.983
286
281
286
5
At most C
1.000
95
95
95
0
At least B
1.000
218
218
218
0
At most B
0.990
294
291
294
3
At least A
0.864
19
19
22
3
results of the application of VC-DRSA are expressed using consistency level (l) as 0.8 as 1.0 means DRSA. Thus, 20% of inconsistencies have been granted in the result.
References Studies on ICT Usage in the Academic CampusUsing Educational Data Mining
- Md. Reza Beikzadeh, N. Delavari, "A New Analysis Model for Data Mining Processes in Higher Educational Systems"
- Romero C., Ventura S., "Educational data mining: A survey from 1995 to 2005", Expert Systems with Applications, Elsevier, 2007.
- ZdzislawPawlak (2002), "Rough Sets, Decision Algorithm and Bayes' Theorem", European Journal of Operational Research, 181-189.
- Greco, S., Matarazzo, B., Słowiński, R.: "Multicriteria classification by dominance-based rough set approach – Methodological Basis of the 4eMka System" in W.Kloesgen and J.Zytkow (eds.), Handbook of Data Mining and Knowledge Discovery, Oxford University Press, New York, 2002.
- Greco, S., Matarazzo, B., Słowiński, R.: "Rough sets theory for multi-criteria decision analysis", European Journal of Operational Research, 129, 1 (2001) 1–47.
- Słowiński, R., Greco, S., Matarazzo, B.: "Rough set based decision support", Chapter 16 [in]: E.K. Burke and G. Kendall (eds.), Search Methodologies: Introductory Tutorials in Optimization and Decision Support Techniques, Springer-Verlag, New York (2005) 475–527.
- S. Greco, B. Matarazzo, R. Słowiński, J. Stefanowski, "Variable consistency model of dominance-based rough set approach", in: W. Ziarko, Y. Yao (Eds.), Rough Sets and Current Trends in Computing, LNAI 2005, Springer-Verlag, Berlin, 2001, pp. 170–181.
- "Workshop on ICT", UGC Academic Staff College, The University of Burdwan, 2013.
- Blaszczynski, J., Greco, S., & Slowinski, R. (2007), "Multi-criteria classification – A new scheme for application of dominance-based decision rule", European Journal of Operational Research, 181(3), 1030–1044.
- Greco, S., Matarazzo, B., Slowinski, R., &Stefanowski, J. (2001), "An algorithm for induction of decision rules consistent with dominance principle", In W. Ziarko& Y. Yao (Eds.), Rough sets and current trends in computing. LNAI 2005 (pp. 304–313). Berlin: Springer-Verlag.
- http://idss.cs.put.poznan.pl/ accessed on 15-01-2014.
- Auddy A., Mukhopadhyay S., "Data Mining in Higher Education during Recent Years: A Survey", Second National Conference on Computing and Systems (NaCCS-2012) Proceedings, March 15-16, 2012, Burdwan, pages 14-19.
- R. S.J.D. Baker, K. Yacef, "The State of Educational Data Mining in 2009: A Review and Future Visions", Journal of Educational Data Mining,1(1).
- Auddy A., Mukhopadhyay S., "Applications of Rough Set Tools in Student Performance Analysis", National Journal of Computer Science and Technology, vol-4, issue-1, pages 17-24.
- James J.H. Liou, "Variable Consistency Dominance-based Rough Set Approach to formulate airline service strategies", Applied Soft Computing 11 (2011) 4011–4020
- Auddy A., "A Formulation of Questionnaire to Study the ICT Utilisation at University Campus", National Journal of Computer Science and Technology, in press.
- "The UNESCO ICT in Education Programme", UNESCO Bangkok, 2007.
