Study of dendritic cell migration using CELL-IQ analysis system

Author: Nekhaeva Tatyana L., Danilova Anna B., Baldueva Irina A.
Journal: Сибирский онкологический журнал @siboncoj
Section: Лабораторные и экспериментальные исследования
Article in issue: 4 т.17, 2018.
Free access
Dendritic cells (DCs) belong to specialized pool of antigen-presenting cells with high functional plasticity and manifest with immunostimulatory or immunosuppressive potential depending on sequence and combination of microenvironment stimuli, which determine their differentiation, maturation and activation. The use of antitumor DCs vaccines is based on the ability of DCs specifically activated in vitro migrate for antigen presentation to T-lymphocytes. We studied the components of the tumor microenvironment that are capable of inhibiting DCs migration. The study of the mobility of DCs in Cell-IQ experimental analytical system showed the presence of an inverse correlation of high strength between the average trajectory speed and the level of immunosuppressive factors (ISFs) in supernatants of cultured skin melanoma cells (TgFβ1, IL-10, IL-18, VEgF-A, EgF, FgF, HgF, sFASL (p
Dendritic cells, migration, immunosuppressive factors, cancer testis antigens
Short address: https://sciup.org/140254193
IDR: 140254193 | UDC: 616-097.1:576.5 | DOI: 10.21294/1814-4861-2018-17-4-14-23
Изучение особенностей миграции дендритных клеток в экспериментальной аналитической системе CELL-IQ
Дендритные клетки (ДК) - это специализированная группа антиген-презентирующих клеток с высокой функциональной пластичностью, которые проявляют иммуностимулирующий или иммуносупрессивный потенциал в зависимости от последовательности и комбинации стимулов микроокружения, определяющих их дифференцировку, созревание, активацию. Разработка противоопухолевых ДК-вакцин основана на способности ДК специфически активированных in vitro мигрировать для презентации антигенов Т-лимфоцитам in vivo. В работе проведено изучение элементов опухолевого микроокружения, способных оказывать влияние на миграцию ДК. Изучение подвижности ДК в экспериментальной аналитической системе Cell-IQ показало наличие обратной корреляции высокой силы между средней скоростью прохождения траектории ДК и содержанием иммуносупрессивных факторов (ИСФ) в супернатантах культивируемых клеток меланомы кожи (TgFβ1, IL-10, IL-18, VEgF-A, EgF, FgF, HgF, sFASL (p
Text of the scientific article Study of dendritic cell migration using CELL-IQ analysis system
Tumor cells are capable of synthetizing and producing a range of factors with inhibitory effect on the activity of immune cells, among which the effect on dendritic cells (DCs) system is particularly important. Cellular organisation of tumor microenvironment represents sophisticated living system with a complex of different stimuli, which influence all aspects of DCs biology and thus manage their functionality and vitality [1-3]. DCs belong to specialized pool of antigenpresenting cells with high functional plasticity and manifest with immunostimulatory or immunosuppressive potential depending on sequence and combination of microenvironment stimuli, which determine their differentiation, maturation, activation and polarisation. Immature or maturating DCs are found in different nonlymphoid tissues and organs but after activation they migrate towards lymphoid tissues to interact with T-lymphocytes and induce immune response [4]. A low level expression of the MHC antigens and costimulatory molecules is typical for the immature DCs. They are not capable to efficiently activate T-lymphocytes still they have ability for high degree endocytosis [5-7]. Activation of DCs under the influence of different stimuli of maturation is associated with the development of increased expression of a variety of intracellular and surface molecules providing migration of DCs to secondary lymphoid tissues and interaction with T-lymphocytes. However, activation and maturation of DCs are dependent on microenvironment and could be blocked by specific factors or their combinations leading to the formation of subpopulations of DCs with tolerogenic and immunosuppressive activity [8].
Experimental studies by K.M. Hargadon et al. (2016) on the model of murine melanoma have shown the influence of factors produced by malignant melanocytes on the maturation and subsequent activation of differentiated DCs from spleen and lungs [1]. A number of researchers have established facts of disturbed biophysical properties of DCs in particular ability to change shape of the cell under the influence of immunosuppressive molecules expressed by a tumor, such as interleukin 10 (IL-10), transforming growth factor (TGFβ1), vascular endothelial growth factor (VEGF) [9-11].
The use of antitumor dendritic cell vaccines is very relevant as it is based on the ability of the DCs, specifically activated in vitro , to migrate to T-lymphocytes for antigen presentation, therefore, the study of the tumor
microenvironment components forming systemic and local immunosuppression in the patient’s body is able to modify properties of the DCs, thus reducing clinical efficacy of immunotherapy.
Materials and methods
The study was done with immature DCs (iDCs) obtained from monocytes of peripheral blood samples of patients with skin melanoma and with skin melanoma cells obtained from surgical material of patients treated in NMRC of oncology named after N.N. Petrov from 2001 to 2017 years. Skin melanoma cells were maintained as cell lines after 20 or more passages, part of which was deposited in the Collection of cell cultures of the Institute of cytology of Russian Academy of Sciences, Saint-Petersburg, Russia.
Differentiation of DCs from the adhesion monocyte fraction from peripheral blood mononuclear cells of a patient with skin melanoma was carried out according to a standard procedure developed in the NMRC of oncology named after N.N. Petrov [12], in adhesive culture flasks (Sarstedt, Germany) under conditions of СО2 incubator «Heracel» (Termo Electron LTD GmbH, Germany) at 37°С, 5 % CO2 and 98 % humidity with culture medium «Cell-Gro DC», granulocyte-macrophage growth factor GM-CSF (72 ng/ml), interleukin 4 IL-4 (15 ng/ml) (CellGenix, Germany), which were introduced on the 1st, 3rd and 5th day of cultivation (iDCs). On the 7th day, DCs were removed with 0.25% trypsin solution and BD Falcon Cell Scrapers (BD Biosciences, USA) and analysed on a flow cytometer and DCs with CD14-CD1a+CD83-CD11c+CD86±HLA-DR+CD80±CD209+ immunophenotype on 92% of the DCs were used for the experiment.
Skin melanoma cell lines. After mechanical disaggregation of tumor samples, the isolated cells were plated in plastic flasks (Sarstedt, Germany) and placed into СО2-incubator «Heracel» (Termo Electron LTDGmbH, Germany), continuously cultured and reseeded by the method of Frechney [13], DMEM/F12 culture medium was used (Biolot, Russia) containing 20% bovine embryo serum (Biolot, Russia), insulin, transferrin, selenium, penicillin and streptomycin (Invitrogen, USA). When the monolayer was reached at different passages, the cells were removed using a Trypsin-Versene solution (Biolot, Russia) and used for the experiments. Cell lines were cultivated continuously for 20 or more passages.
Cultivation in the Cell-IQ system. The cultures of the iDCs and skin melanoma cells were seeded into two well silicone inserts (Ibidi GmbH, Germany) at concentration 3 х 105 cell/ml in 70 mcl of culture medium containing 72 ng/ml GM-CSF, 15 ng/ml IL-4 and tumor necrosis factor TNFα (20 ng/ml) (BD Biosciences, USA). After the cells were attached to the substrate, the inserts were removed and the plates were placed in analytical cell analyser system Cell-IQ (Chip-Man Technologies Ltd, Finland) and observed by the phase contrast method for 22-47 hours. The distance between the cell populations was 500 μm. To quantify the migration of the DCs we created a special protocol based on the library of different types of cellular images, which was used for qualitative and quantitative analysis of images of moving cells in
real time. For the cellular modelling allogeneic cells having a similar immunophenotype by HLA class I: HLA A2 were used.
Quantitative assessment of the production of immunosuppressive factors (ISFs). Quantitative content of ISFs (IL-6, 8, 10, 18, TGFβ1, VEGF, follistatin, angiopoietin, placental growth factor PLGF, epidermal growth factor (EGF), stem cell growth factor (SFC), heparin-binding EGF-like growth factor (HB-EGF), insulin like growth factor binding protein 1 (IGFBP1), urokinase plasminogen activator inhibitor PAI-1, urokinase plasminogen activator uPA, fibroblast growth factor (FGF), hepatocyte growth factor (HGF), leptin, osteoponin, prolactin, CD95 receptor ligand sFASL) were determined in supernatants of cultured skin melanoma cells by an sandwich enzyme
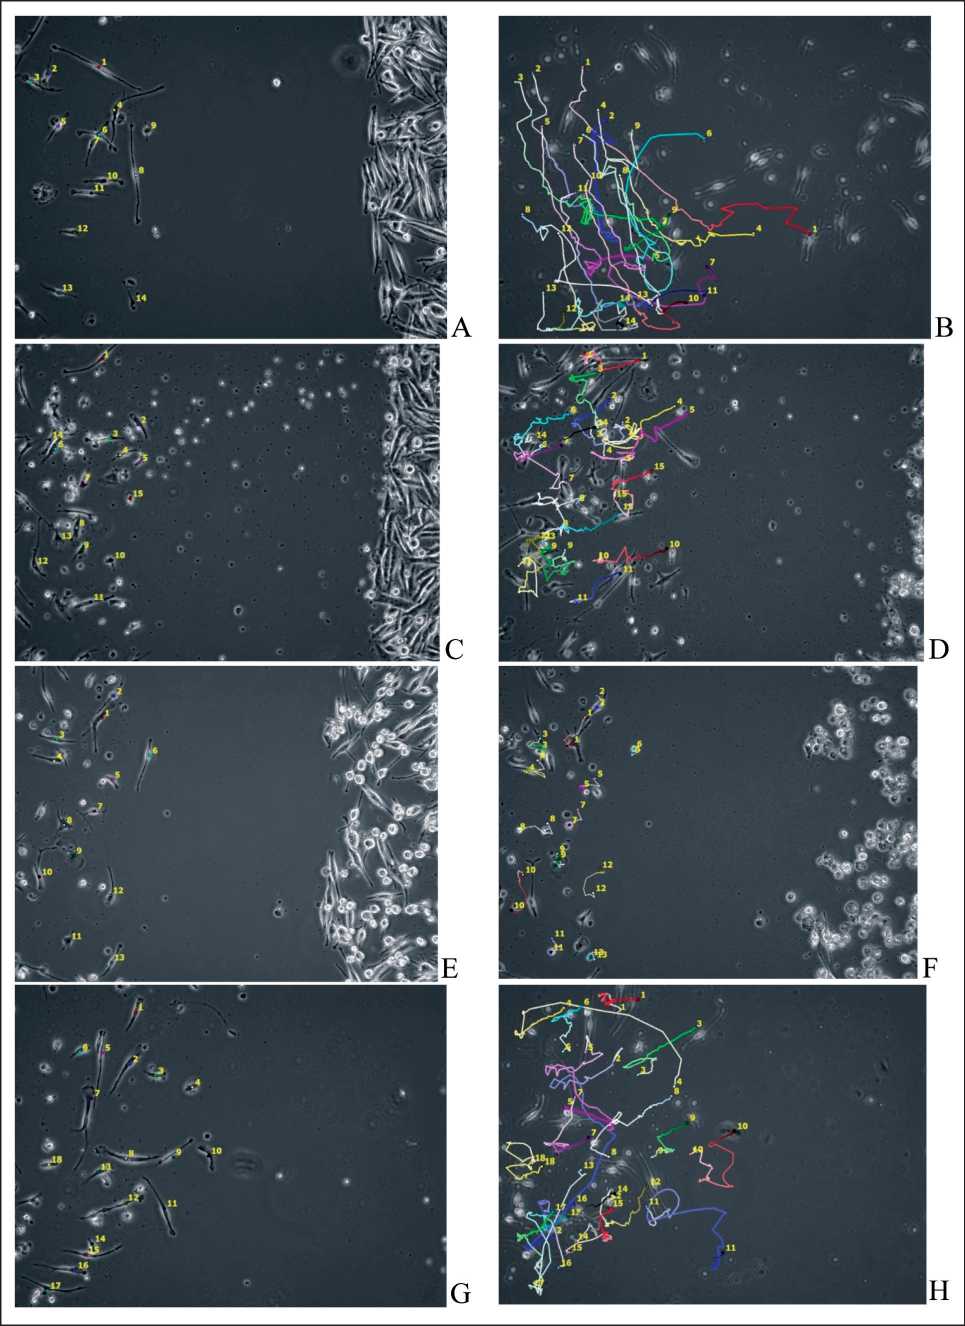
Figure. 1. Analysis of trajectory images of immature DCs movements in the presence of skin melanoma cells line #894.
A – start of DCs movement fixation and B – end of DCs movement fixation under standard conditions of cultivation;
C - start of DCs movement fixation and D - end of DCs movement fixation in the presence of TGFβ1 (10 ng/ml);
E - start of DCs movement fixation and F - end of DCs movement fixation in the presence of IL-10 (1 ng/ml); G - start of DCs movement fixation and H - end of DCs movement fixation in the presence of VEGF (50 ng/ml).
Observation time 47 hours
Table 1
Parameters of movement trajectories of immature DCs co-cultivated with skin melanoma cells obtained from different patients
|
Cellular system: co-culture of immature DCs and skin melanoma cells line # |
Observation time (h) |
Number of view fields (n) |
Average number of tested cells |
Distance passed (µm) |
Trajectory length (µm) |
Average speed of trajectory pass (µm/h) |
Angle of cell population movement (°) |
|
226 |
24 |
10 |
13 |
213.5±6.67 |
2094.2±15.43 |
88.3±1.79 |
51.6±3.45 |
|
283 |
22 |
8 |
10 |
102.5±4.32 |
398.4±12.33 |
17.4±1.98 |
340.2±9.41 |
|
311 |
24 |
9 |
15 |
94.9±9.49 |
374.9±19.20 |
16.1±1.05 |
343.6±3.35 |
|
643 |
24 |
10 |
15 |
132.9±5.43 |
1121.2±74.73 |
41.4±1.69 |
130.6±10.72 |
|
685 |
34 |
10 |
12 |
155.0±8.92 |
1481.0±24.78 |
48.6±4.70 |
144.0±5.23 |
|
686 |
34 |
8 |
20 |
241.0±14.34 |
2556.0±56.11 |
75.26±1.65 |
135.7±2.25 |
|
694 |
26 |
8 |
15 |
168.0±18.0 |
1345.2±39.59 |
52.4±1.63 |
333.6±8.54 |
|
894 |
22 |
10 |
12 |
291.8±31.07 |
1423.3±105.21 |
30.1±2.23 |
324.5±18.30 |
|
Table 2 |
|||||||||||
|
Dependence of the average speed of DCs movement on the production of immunosuppressive factors |
|||||||||||
|
by cultured skin melanoma cells |
|||||||||||
|
Cell line |
TGFβ1 |
IL-10 |
VEGF-A |
IL6 |
IL8 |
Fol-listatin (ng/ml) |
IL18 |
PLGF |
Angiopo-etin (pg/ml) |
EGF |
SCF |
|
# |
(ng/ml) |
(pg/ml) |
(ng/ml) |
(pg/ml) |
(ng/ml) |
(pg/ml) |
(pg/ml) |
(pg/ml) |
(pg/ml) |
||
|
226 |
0.73 |
1.53 |
0.79 |
0 |
0.37 |
0.24 |
0.12 |
116.90 |
0 |
0.43 |
5.02 |
|
283 |
23.15 |
48.15 |
5.59 |
8.04 |
0.94 |
2.09 |
25.49 |
632.41 |
538.89 |
419.56 |
2.65 |
|
311 |
19.84 |
40.70 |
10.05 |
17233.50 |
0.92 |
3.85 |
14.15 |
242.98 |
683.42 |
358.38 |
64.70 |
|
643 |
5.42 |
16.06 |
3.60 |
29.56 |
20.28 |
36.39 |
0.87 |
263.21 |
541.99 |
9.7 |
18.40 |
|
686 |
3.89 |
1.51 |
0.84 |
32.48 |
0.84 |
17.38 |
0.27 |
5266.42 |
12367.14 |
22.26 |
24.19 |
|
694 |
3.00 |
10.08 |
4.55 |
109.02 |
11.70 |
0.49 |
1.35 |
278.78 |
4999.91 |
191.00 |
22.32 |
|
685 |
2.43 |
36.67 |
12.70 |
89.86 |
11.01 |
5.17 |
1.29 |
46.53 |
16097.05 |
2.11 |
9.63 |
|
894 |
4.57 |
12.25 |
1.50 |
4.45 |
23.07 |
0.11 |
3.64 |
310.30 |
5943.86 |
134.00 |
11.87 |
|
Spearman correla- |
-0.857 |
-0.857 |
-0.833 |
-0.262 |
-0.381 |
-0.143 |
-0.881 |
-0.095 |
-0.429 |
-0.714 |
-0.095 |
|
tion, r |
|||||||||||
|
p |
0.01 |
0.007 |
0.037 |
0.531 |
0.352 |
0.736 |
0.004 |
0.823 |
0.289 |
0.047 |
0.823 |
|
Cell line Endoglin HB-EGF IGFPB-1 |
PAI-1 |
uPA |
FGF |
HGF |
Leptin |
Osteoponin |
Prolactin |
sFASL |
|||
|
# |
(pg/ml) |
(pg/ml) |
(pg/ml) |
(pg/ml) |
(pg/ml) |
(pg/ml) |
(pg/ml) |
(pg/ml) |
(ng/ml) |
(pg/ml) |
(pg/ml) |
|
226 |
0 |
0 |
0 |
39.16 |
0 |
40 |
52.05 |
34.17 |
0.47 |
15.75 |
0 |
|
283 |
3.00 |
0 |
18.30 |
4228.8 |
0.13 |
84.52 |
118.85 |
16.64 |
18.99 |
24.91 |
221.5 |
|
311 |
8.50 |
0 |
5.80 |
66.11 |
0 |
138.62 |
1353.74 |
296.95 |
17.22 |
393.69 |
368.93 |
|
643 |
10.70 |
262.56 |
0 |
1606.96 |
0 |
112.62 |
506.36 |
55.00 |
0.38 |
4.33 |
0 |
|
686 |
198.42 |
135.61 |
62.82 |
7096.80 |
54.42 |
60.75 |
38.44 |
104.97 |
1.82 |
59.36 |
3.5 |
|
694 |
17.27 |
214.45 |
4.34 |
4469.30 |
0 |
42.47 |
38.19 |
24.70 |
14.24 |
13.00 |
4.34 |
|
685 |
15.68 |
79.20 |
16.39 |
5187.17 |
5.41 |
26.8 |
13.48 |
30.66 |
3.95 |
26.28 |
3.54 |
|
894 |
50.29 |
20.62 |
4627.00 |
5206.00 |
9433.00 |
91.52 |
73.35 |
21.65 |
1.13 |
0 |
63.29 |
|
Spearman correlation, r |
0.167 |
0.317 |
-0.287 |
0.119 |
-0.038 |
-0.738 |
-0.690 |
0.119 |
-0.500 |
-0.095 |
-0.790 |
|
p |
0.693 |
0.444 |
0.49 |
0.779 |
0.929 |
0.037 |
0.05 |
0.779 |
0.207 |
0.823 |
0.02 |
|
Table 3 |
|||||||||||
|
Dependence of the DCs direction of movement from TAAs expression by cultured skin melanoma cells |
|||||||||||
|
(% cells) |
|||||||||||
|
Cell line # |
melanA |
Tyros |
S100 |
Gp100 |
MITF |
MAGE |
BAGE |
GAGE |
NY-ESO-1 |
||
|
226 |
49.6 |
97.6 |
68.7 |
99.6 |
21.7 |
89.7 |
94.8 |
99.4 |
79.1 |
||
|
283 |
2.5 |
8.7 |
1.2 |
12.6 |
0 |
0.6 |
0.4 |
1.4 |
6.3 |
||
|
311 |
0 |
28.0 |
5.2 |
87.6 |
49.5 |
18.1 |
4.4 |
92.2 |
11.1 |
||
|
643 |
76.8 |
66.6 |
1.0 |
94.1 |
66.5 |
60.5 |
74.5 |
95.8 |
61.7 |
||
|
685 |
40.4 |
75.6 |
0 |
61.6 |
40.2 |
30.3 |
52.5 |
8.8 |
47.9 |
||
|
686 |
11.9 |
60.9 |
3.1 |
77.2 |
73.1 |
18.2 |
24.5 |
48.6 |
67.8 |
||
|
694 |
23.0 |
0 |
59.3 |
90.6 |
5.9 |
0 |
6.8 |
13.8 |
0 |
||
|
894 |
0.7 |
0 |
5.8 |
99.9 |
0 |
0 |
0 |
7.6 |
0 |
||
|
Spearman correlation, |
-0.810 r |
-0.707 |
-0.024 |
-0.405 |
-0.383 |
- |
0.755 |
-0.810 |
-0.571 |
-0.755 |
|
|
p |
0.015 |
0.050 |
0.955 |
0.320 |
0.349 |
0.031 |
0.015 |
0.139 |
0.031 |
||
|
under the influence of the studied ISFs (Table 4, |
skin melanoma cell population, while in the presence |
||||||||||
|
Figures 1, |
2). Nevertheless, the method of centring |
of TGFβ1 and VEGF-A, trajectories of the |
DCs were |
||||||||
|
the trajectories of the DCs allowed |
us to determine |
shortened, but the general direction was |
preserved |
||||||||
|
more precisely the direction of movement of the DC |
(Figures 2, 3). Under the influence of IL-10, the dis- |
||||||||||
|
populations and to reveal certain regularities: |
DCs in |
tance passed by the DCs was minimal and the relative |
|||||||||
|
control samples migrated predominantly towards the |
distribution of cells along the length of the trajectory |
||||||||||
Table 4
Parameters of trajectories of movement of immature DCs, co-cultivated with skin melanoma cells line #894, evaluated in different conditions
|
Cellular system |
Observation time (h) |
Number of view fields (n) |
Number of tested cells (min-max) |
Distance passed (µm) |
Trajectory length (µm) |
Average speed of trajectory pass (µm/h) |
Angle of cell population movement (°) |
|
Control |
|||||||
|
without |
47 |
8 |
12–15 |
291.75±31.07 |
1423.25±105.21 |
30.10±2.23 |
324.50±18.30 |
|
exposure |
|||||||
|
TGFβ1 (10 ng/ml) |
47 |
8 |
15–18 |
136.0±7.32 |
676.0±20.46 |
14.32±0.42 |
234.0±3.85 |
|
р, vs Control |
0.042 |
0.009 |
0.009 |
0.051 |
|||
|
IL-10 |
|||||||
|
(1 ng/ml) |
47 |
8 |
11–15 |
44.45±1.84 |
224.25±10.76 |
10.45±0.52 |
254.25±11.01 |
|
р, vs Control |
0.004 |
0.001 |
0.002 |
0.066 |
|||
|
VEGF (50 ng/ml) |
47 |
6 |
10–17 |
176.5±32.54 |
881.4±88.90 |
18.7±1.89 |
289.1±35.55 |
|
р, vs Control |
0.068 |
0.005 |
0.006 |
0.067 |
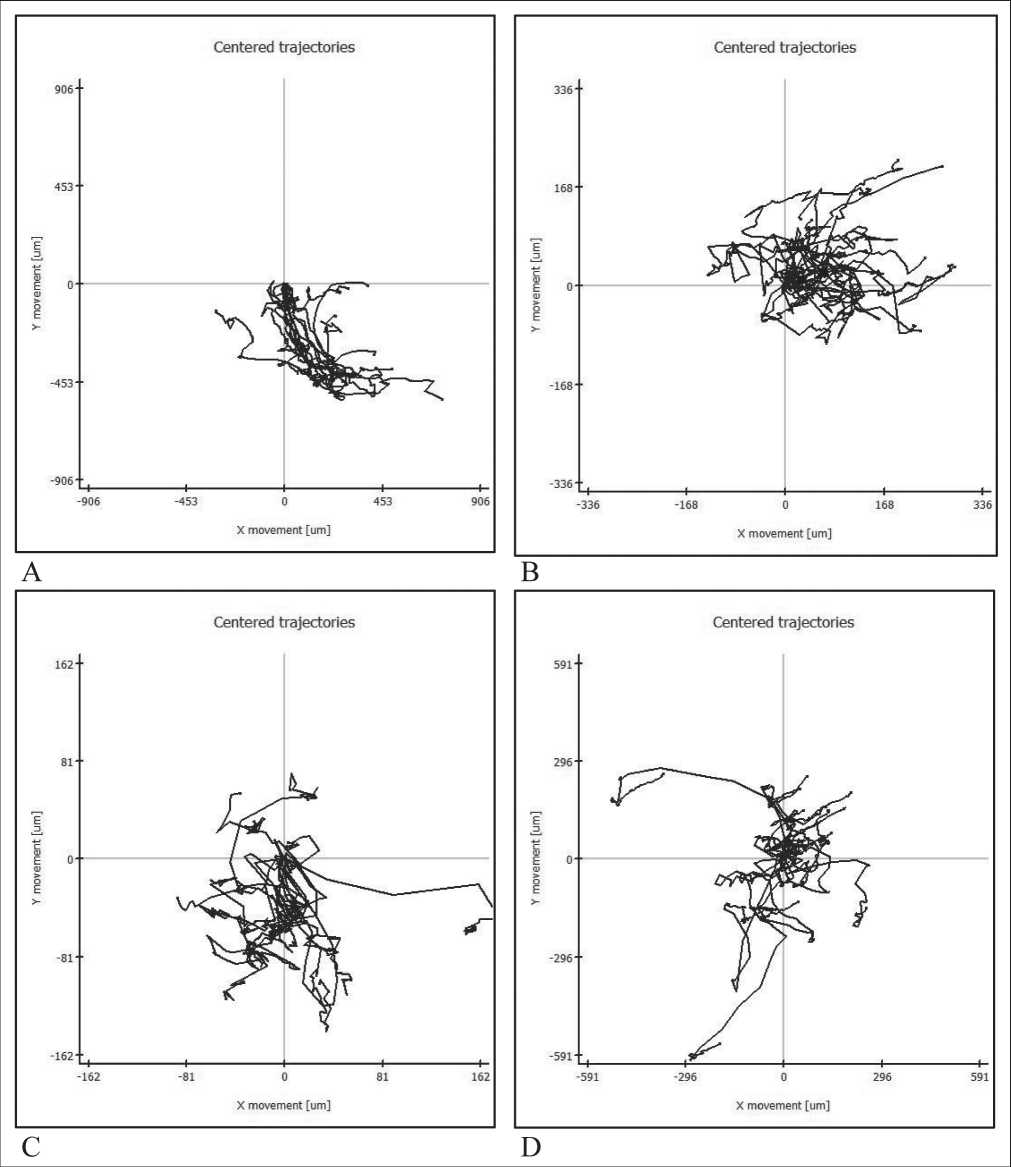
Figure 2. Centring the trajectories of movement of immature DCs in the presence of skin melanoma cells line #894. A – under standard conditions, B – in the presence of TGFβ1 (10 ng/ml), C – in the presence of IL-10 (1 ng/ml),
D – in the presence of VEGF (50 ng/ml)
immunoassay and multiplex analysis on the instrument Bio-Plex 200 System (BIO-RAD, USA). The kits from «BenderMedSystems» (Germany) and «BIO-RAD» (USA) were used.
Quantification of expression of tumor-associated antigens (TAAs). Cultured skin melanoma cells were analysed for the presence of differentiating TAAs (MelanA, tyrosinase, MITF, S100, gp100) and cancer testis antigens (CTAs) (NY-ESO-1, families MAGE, BAGE, GAGE) by the flow cytometry using FAC-SCanto II cytometer system (BD, USA) with BD Bioscience and Santa Cruz biotechnology reagents (USA).
Statistical data treatment. IBM SPSS 19.0 and Microsoft Excel 2010 software packages and the methods of descriptive and nonparametric statistics were used for the analysis [14]. Quantitative data are presented as mean with standard deviation (M±SD).
Results
To study the features of the motility of maturing DCs under the influence of products synthesized by melanoma cells, an in vitro system was created which allowed us to co-culture iDCs with human skin melanoma cell lines (n=8) and to evaluate speed, trajectory and direction of the DCs movement. At least 10 DCs were fixed in each view field and observed afterwards. The pattern of the movement of the DCs was determined by the distance passed by them during the observation period, the trajectory length, the speed of the trajectory pass in the selected period of time, and the angle of movement of the cell population, which determines the general direction of movement of the DCs (Table 1).
We observed great variability in all parameters: the average speed of trajectory pass was minimal when co-cultured with culture #311 (16.1±1.05 µm/h) and maximal in the presence of culture #226 (88.3±1.79 µm/h). Angle of movement of the DCs population that was co-cultured with melanoma cells #226 was
the smallest and amounted to 51.6±3.45, while in the presence of melanoma cells #311 this parameter was defined as 343.6±3.35. In order to identify the factors that have the greatest impact on DCs migration we analysed the dependence of the average speed of DCs from the ISFs found in supernatants of cell lines under study. High strength inverse correlation was revealed between this parameter of the DCs motility and with the amount of ISFs in the supernatants of skin melanoma lines, namely for TGFβ1, IL-10, IL18, VEGF-A, EGF, FGF, HGF, sFASL (p<0.01) (Table 2). Under the influence of the ISFs, not only the speed of the DCs movement changed, but also the character of the movement, which became more chaotic and multidirectional. To test the hypothesis of a possible dependence of the direction of DCs movement from the level of expression of differentiating TAAs and CTAs by tumor cells, a correlation analysis was carried out, which revealed inverse correlation of high strength of angle of movement of the DCs population from the expression of antigens, such as Melan A, tyrosinase, families MAGE, BAGE, NY-ESO-1 (p<0.05) (Table 3).
To reveal more fully the nature of the effect of individual ISFs synthesized by the tumor on the motility of the DCs, additional defined concentrations of the IL-10 (1 ng/ml), TGFβ1 (10 ng/ml), VEGF-A (50 ng/ml) were added. Table 4 represents the results of the analysis of the movements of the DCs in different conditions in the system of co-cultivation with a culture of skin melanoma #894. The greatest impact was possessed by IL-10, in the presence of which the average speed of DCs movement decreased almost threefold (from 30.10±2.23 to 10.45±0.52 µm/h). Also in the presence of the ISFs, the distance between the beginning and the end of the movement observation and also the length of the trajectory passed decreased significantly, but no effect on the angle of movement of the cell population was detected, since statistically significant difference for this parameter was not found
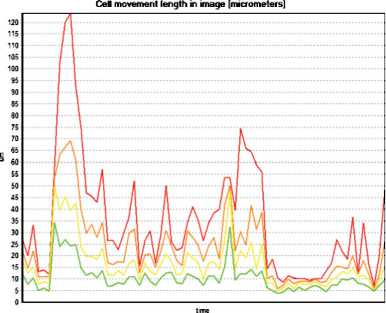
showed a decrease in the movement activity of the DCs and an increase in chaotic state of the motion (Figures 3, 4). The estimation of the motion pattern of the DCs in a two-dimensional coordinate system, taking into account the number of cells that overcome this distance at a certain point in time, made it possible to establish that all the studied ISFs had a similar inhibitory effect on the motility of DCs , the effect of IL-10 was maximal (Figure 4).
Discussion
DCs, as highly specialised antigen-presenting cells, are effective inducers of T-lymphocyte mediated responses and traditionally are considered as a decisive component in the implementation of an antitumor immune response [15]. DCs are found in various tumors, such as breast cancer, colorectal cancer, ovarian, lung, stomach, bladder cancer, etc. It is not surprising that in numerous publications of recent decades there are conflicting evidences of the association of tumor DCs infiltration with a positive or negative prognosis of the disease course and stage.
DCs in tumors are often characterized by a phenotype with a weak expression of co-stimulatory molecules, ineffective cross-presentation of antigens, as well as by the expression of regulatory molecules and receptors that often promote the development of immunosuppression [16, 17]. In animal models, it was shown that the type, phenotype and amount of DCs present in the tumor are dynamic during the tumor growth and are associated with the stage of the disease. J. Krempski et al. (2011) on the model of ovary cancer ID8 in mice demonstrated that the increase in tumor size resulted in a significant increase in the number of DCs in the tumor. Here, almost all DCs had immunosuppressive potential, and the number of T-lymphocytes infiltrating the tumor significantly decreased [18].
Tumor cells and other components of the tumor microenvironment synthesize and release factors that are capable of inhibiting or altering the maturation and activity of DCs. Besides, for a successful presentation of antigens, a high migration speed and a low degree of adhesion are necessary, and the change in these parameters must have a certain directionality during the DCs maturation process [19, 20].
A.J. Michielsen et al. (2011) showed that the conditioned medium of tissue explants of human colorectal cancer had a high content of VEGF and chemokines CCL2, CXCL1, CXCL5. Pre-incubation of DCs in this medium in vitro led to blockade of their maturation [21]. Moreover, as it turned out, in addition to the biochemical effects the ISFs produced by tumor cells influence the biophysical properties of the DCs preventing their effective migration. Most protocols of antitumor DCs immunotherapy are based on the
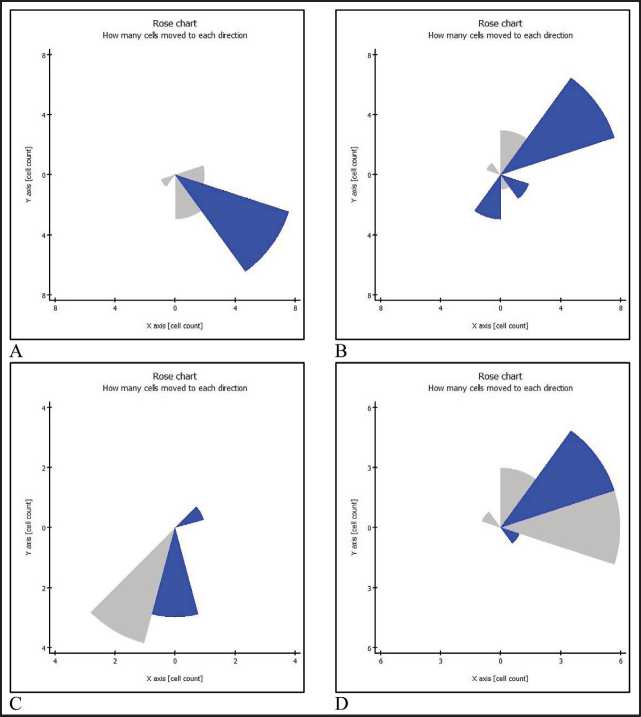
Figure 3. Graphical mapping of directions of movement of immature DCs and quantitative evaluation of the preferred direction of movement in the co-cultivation system with skin melanoma cells line #894. A – under standard conditions,
B– in the presence of TGFβ1 (10 ng/ml), C – in the presence of IL-10 (1 ng/ml),
D – in the presence of VEGF (50 ng/ml)
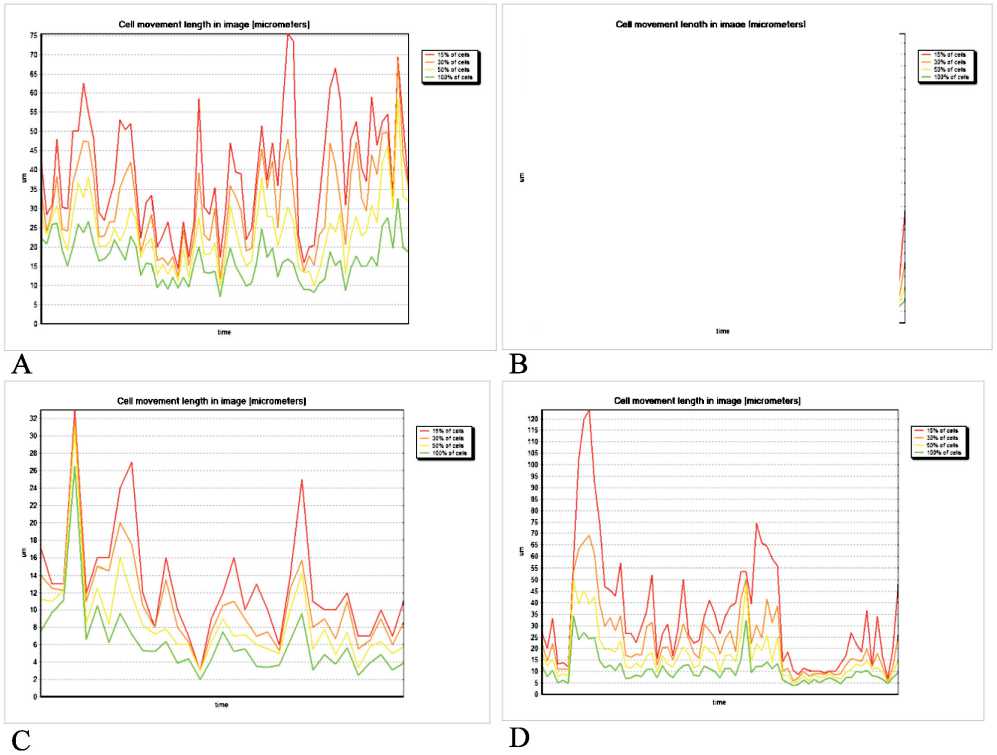
Figure 4. Graphical representation of 2D percentage distribution of immature DCs in movement in the co-cultivation system with skin melanoma cells line #894. A – under standard conditions, B – in the presence of TGFβ1 (10 ng/ml), C – in the presence of IL-10 (1 ng/ml), D – in the presence of VEGF (50 ng/ml). Red line ■ – 15 % of DCs, orange line ■ – 30 % of DCs, yellow line ■ – 50 % of DCs, green line ■ – 100 % of DCs
activation of DCs in vitro by loading with antigens contained in autologous and / or allogeneic tumor cells lysates. The activation of DCs is associated including the enhancement of expression of intracellular and surface molecules that provide DCs movability and ability to migrate. However, these processes are dependent on the microenvironment and can be blocked or modified by specific ISFs synthesised into the surrounding microenvironment, which may be the cause of the low efficacy of DCs-vaccine therapy in individual patients.
In this study, an in vitro model was created which allowed estimation of the influence of the ISFs produced by human skin melanoma cells on the efficacy of migration and activation of maturating DCs. It turned out that the most prominent inhibitory effect on the movability of maturing DCs had IL-10, and there was an inverse relationship between the production of IL-10 by skin melanoma cells and the speed of movement of the DCs (p<0.05) (Tables 2, 4). X. Xu et al. (2017) demonstrated the influence of IL-10 on biophysical characteristics of DCs, such as deformability, osmotic resistance and electrophoretic mobility [11]. It was found that IL-10 critically affected these parameters, contributing to their reduction. The electrophoretic mobility of DCs was associated with the presence of negative charges on their surface membrane. It has be established that the number of these charges continuously increases during the differentiation process (maturation and activation) of the DCs, which is directly linked with their movability [22]. Decrease of these charges on the surface of the cell membrane leads to an increase in the adhesion forces of the DCs to the components of the tumor microenvironment, and limits the motility of the DCs. The ability to change the shape of a cell is important in the migration process when passing a wall of blood or lymphatic vessel through the connections between the cells and the complex extracellular matrix. Studies of Z. Zeng et al. (2006) demonstrated that DCs showed a high capacity for deformation at different stages of differentiation, starting from a monocytic population [23]. Defects of properties to change the shape of cells that arise under the influence of IL-10 can contribute to the weakening of their migration, which can be considered as one of the elements of the phenomenon of «immune escape» (evasion from the immune control) of tumor cells [9].
In our study, it was found that TGFβ1 and VEGF had a similar effect on DCs migration, blocking their movability. Differences between control samples and samples with increased number of these ISFs were statistically significant (p<0.05) in two parameters: trajectory length and average speed of trajectory pass (Table 4). Study done by Z.Q. Hu et al. (2016), identified that VEGF affected the biophysical properties of such structures of the DCs as the outer cytoplasmic membrane and the cytoskeleton, which led to immobilization of the DCs and disrupted their ability to antigen presentation [24]. It was suggested that the electrical potential of the cell membrane was changed by VEGF, thus influencing the effectiveness of immunological synapses formed by the DCs.
L.K. Spary et al. (2014) on the in vitro model of tumor and stromal cells of prostate cancer showed that DCs cultured in the presence of TGFβ1 and secreted by stromal cellular elements lost expression of CD209, retained expression of СD14 and were unable to present antigens for T-lymphocytes [24]. These experiments demonstrated the role of the immunosuppressive microenvironment in the blockade of normal DCs maturation.
We obtained data on the inverse dependence of the movability of the DCs on the presence in the microenvironment of a number of growth factors, such as EGF, FGF, HGF (Table 2). In the literature, there are data on the effect of these factors on the mobility of eukaryotic cells [25, 26]. It is known that HGF changes the direction of DCs differentiation, contributing to the formation of a tolerogenic immunophenotype, but the mechanism of action of this factor on the DCs has not been studied sufficiently yet [27]. In addition, it was shown that under the influence of HGF, the adhesion of DCs to laminin was increased [28]. In our study, an inverse relationship was found between the production of FasL by skin melanoma cells and the speed of DCs movement in the studied system.
Among the numerous publications devoted to the analysis of elements of the tumor microenvironment
References Study of dendritic cell migration using CELL-IQ analysis system
- Hargadon K.M., Bishop J.D., Brandt J.P., Hand Z.C., Ararso Y.T., Forrest O.A. Melanoma-derived factors alter the maturation and activation of differentiated tissue-resident dendritic cells. Immunol Cell Biol. 2016 Jan; 94(1): 24-38. DOI: 10.1038/icb.2015.58
- Saenz R., Souza Cda S., Huang C.T., Larsson M., Esener S., Messmer D. HMGB1-derived peptide acts as adjuvant inducing immune responses to peptide and protein antigen. Vaccine. 2010 Nov 3; 28(47): 7556-62. DOI: 10.1016/j.vaccine.2010.08.054
- Shurin M.R., Shurin G.V., Lokshin A., Yurkovetsky Z.R., Gutkin D.W., Chatta G., Zhong H., Han B., Ferris R.L. Intratumoral cytokines/chemokines/growth factors and tumor infiltrating dendritic cells: friends or enemies? Cancer Metastasis Rev. 2006 Sep; 25(3): 333-56. DOI: 10.1007/s10555-006-9010-6
- Ma Y., Shurin G.V., Peiyuan Z., Shurin M.R. Dendritic cells in the cancer microenvironment. J Cancer. 2013; 4(1): 36-44. DOI: 10.7150/jca.5046
- Manicassamy S., Pulendran B. Dendritic cell control of tolerogenic responses. Immunol Rev. 2011 May; 241(1): 206-27. DOI: 10.1111/j.1600-065X.2011.01015.x
