Study of Noise Detection and Noise Removal Techniques in Medical Images

Author: Bhausaheb Shinde, Dnyandeo Mhaske, A.R. Dani
Journal: International Journal of Image, Graphics and Signal Processing(IJIGSP) @ijigsp
Article in issue: 2 vol.4, 2012.
Free access
In this work we taken different medical images like MRI, Cancer, X-ray, and Brain and calculated standard derivations and mean of all these medical images. To finding salt & pepper noise and then applied median filtering technique for removal of noise. After removing a noise by using median filtering techniques again standard derivations and mean are evaluated. This experimental analysis will improve the accuracy of MRI, Cancer, X-ray and Brain images for easy diagnosis. The results, which we have achieved, are more useful and they prove to be helpful for general medical practitioners to analyze the symptoms of the patients.
ROI- Region Of Interest, MRI – Magnetic Resonance Imaging, Median filter, Adaptive filter and Average filter
Short address: https://sciup.org/15012243
IDR: 15012243
Text of the scientific article Study of Noise Detection and Noise Removal Techniques in Medical Images
Published Online March 2012 in MECS
Median Filtering:
Median filtering is similar to using an averaging filter, in that each pixel is set to an ‘average’ of the pixel values in the neighborhood of the corresponding input pixels. However with median filtering, the value of an output pixel is determined by the median of the neighborhood pixels, rather than the mean. The median is much less sensitive than the mean to extreme values. Median filtering is therefore better able to remove this outlier without reducing the sharpness of the image.
Adaptive Filtering:
The wiener2 function applies a Wiener filter which is a type of linear filter to an image adaptively, tailoring itself to local image variance. Where the variance is large, wiener2 performs little smoothing. Where the variance is small, wiener2 performs more smoothing. This approach often produces better result than linear filtering. The adaptive filter is more selective than a comparable linear filter, preserving edges and other high frequency parts of an image. In addition, there are no design tasks; the wiener2 function handles all preliminary computations, and implements the filter for an input image. Wiener2, however, does require more computations time than linear filtering. Wiener2 works best when the noise is constant-power (“white”) additive noise, such as Gaussian noise.
Adaptive median filter:
Adaptive median filtering can handle impulse noise with probabilities. The adaptive median filter is that it seeks to preserve detail while smoothing non impulse noise, something that the traditional median filter does not do.
-
II- METHODOLOGY
Figure shows the different noise which has find in these medical image and after applying the filtering techniques in these medical images and same has been given through histogram.
Table 1.1
|
Image |
Original Image |
Noisy Image |
Filtered Image |
|||
|
Std |
Mean |
Std |
Mean |
Std |
Mean |
|
|
MRI |
70.0623 |
182.2473 |
74.0267 |
180.0172 |
68.8923 |
182.5818 |
|
Cancer |
61.2939 |
62.4918 |
64.0972 |
63.9113 |
53.1813 |
60.3204 |
|
X-Ray |
65.4542 |
145.47576 |
68.2635 |
144.9646 |
64.8242 |
145.9382 |
|
Brain |
91.0872 |
85.9561 |
92.5692 |
87.1018 |
90.5972 |
85.7115 |
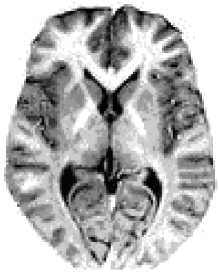
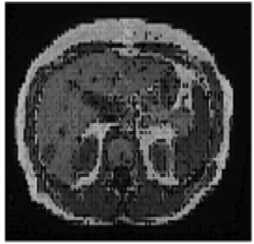
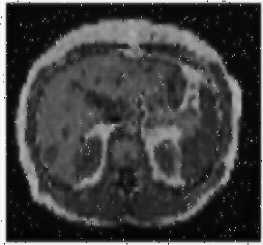
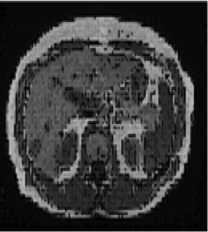
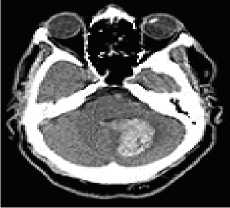
(a)Original MRI image


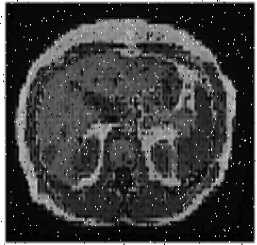
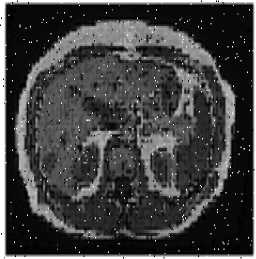
(c) Applying Median Filter

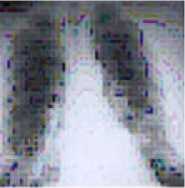
(a) Original x-ray image
(c) Applying median Filter
(a)Original cancer image

(c) Applying median Filter

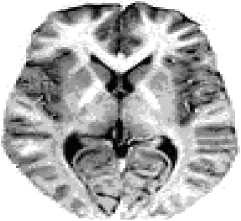
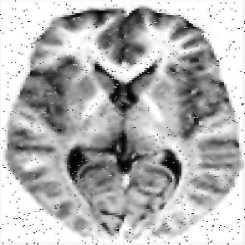
(a)Original image (Brain image)


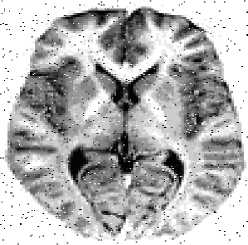
(c) Applying Median Filter
(a) Original x-ray image

(c) Applying median Filter
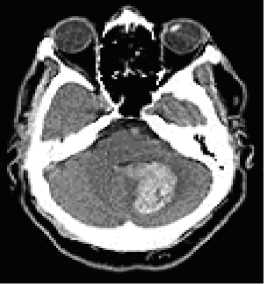
(a)Original image (Brain image)
(b) ROI generated for noisy image

(c) Applying Median Filter
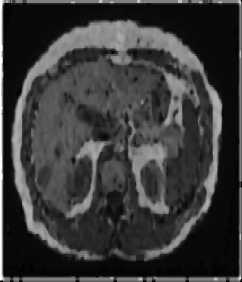
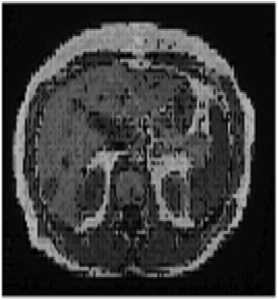
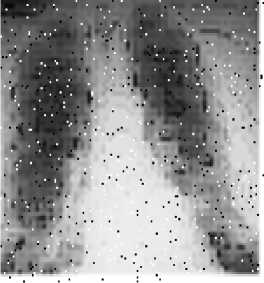
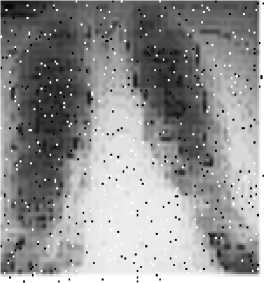
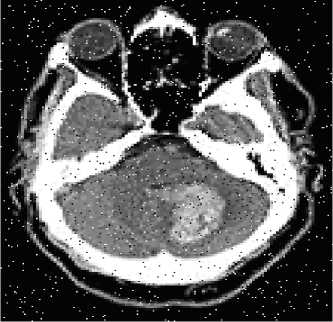
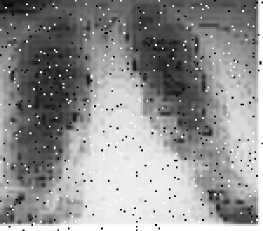
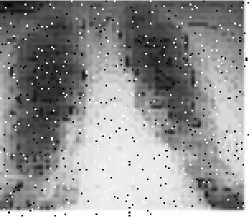
Fig1.1.1 Shows finding the salt and pepper noise in MRI, Cancer, X-ray, Brain images and applying the median filter on these images.
(c ) Histogram for noisy image
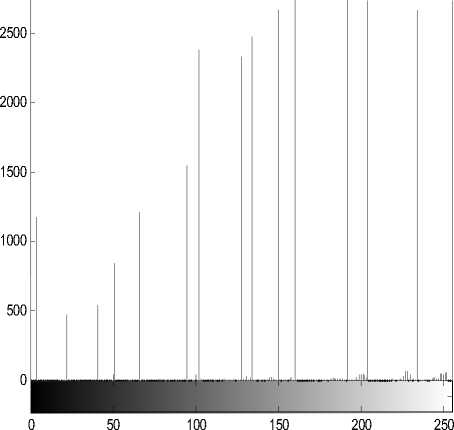
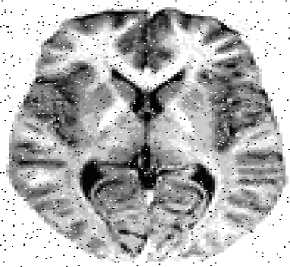
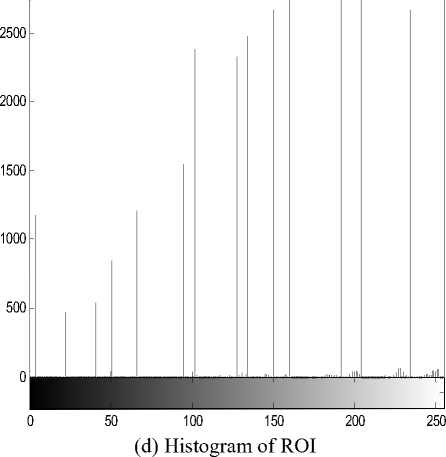
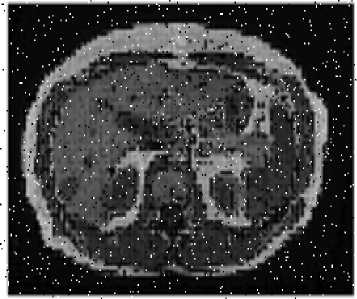
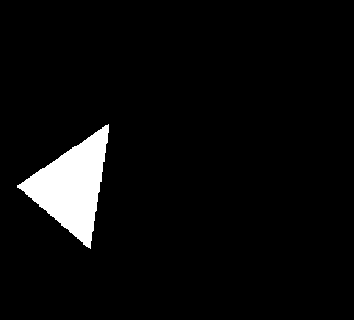
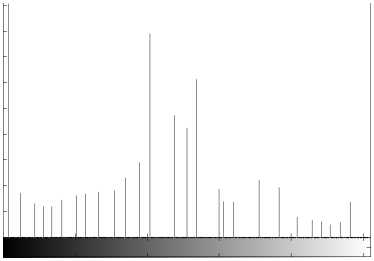
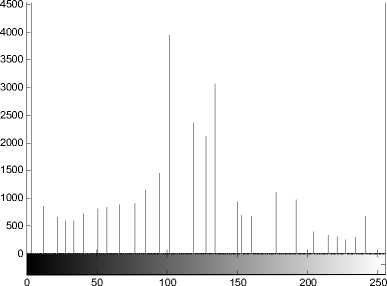
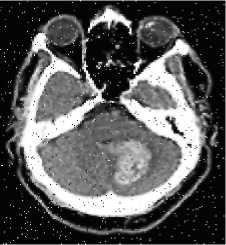
The following figure shows the noise pattern for the MRI, Cancer, X-ray and brain images. In these medical images after finding the salt and pepper noise we have taken a region of interest for noisy images and the histogram shows the noise pattern that is it is the salt and pepper noise.
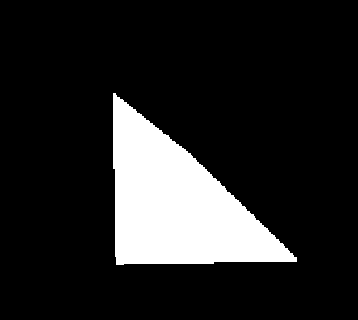
(f) ROI for the noisy image
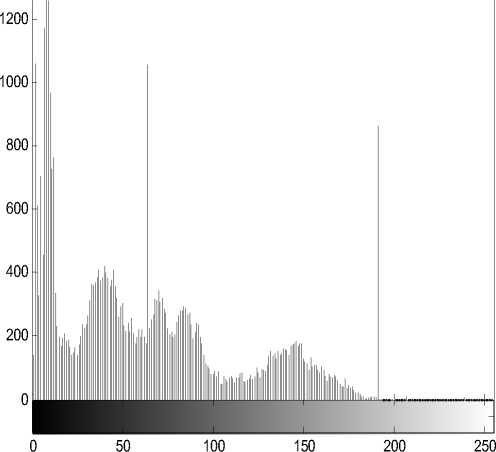

(h) histogram for ROI

(g) Histogram for the noisy image
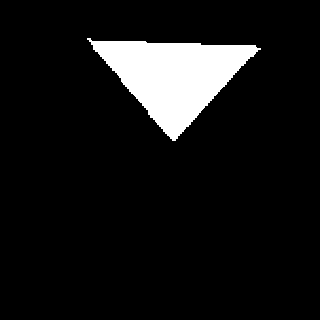
(j) ROI for noisy image
(n) ROI of noisy image
0 50 100 150 200 250
(k) Histogram for the noisy image

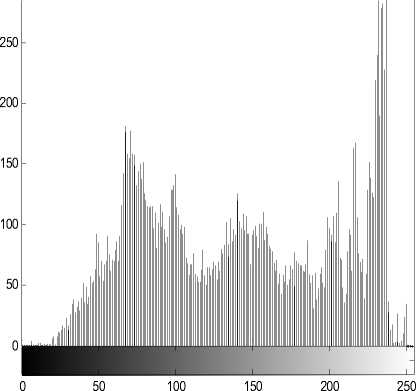
(o) Histogram for the noisy image
(l) Histogram for the ROI
(p) histogram for the ROI
After finding the speckle noise in MRI, Cancer, X-ray and brain images and applying the median filter for these images.
Table 4.6
|
Image |
Original Image |
Noisy Image |
Filtered Image |
|||
|
Std |
Mean |
Std |
Mean |
Std |
Mean |
|
|
MRI |
70.0623 |
182.2473 |
74.0267 |
180.0172 |
65.7016 |
179.8383 |
|
Cancer |
61.2939 |
62.4918 |
64.0972 |
63.9113 |
55.4636 |
63.7529 |
|
X-Ray |
65.4542 |
145.47576 |
68.2635 |
144.9646 |
65.4814 |
144.7277 |
|
Brain |
91.0872 |
85.9561 |
92.5692 |
87.1018 |
89.1596 |
87.1165 |
(a)Original Cancer image
(a)Original MRI image
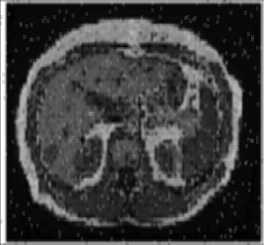
(c) Applying Adaptive Filter
(c) Applying Adaptive Filter
(a) Original x-ray image

(c) applying Adaptive Filter
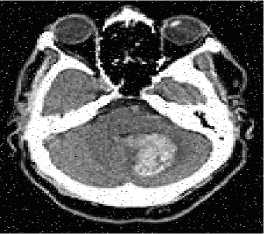
Table 4.10
|
Image |
Original Image |
Noisy Image |
Filtered Image |
|||
|
Std |
Mean |
Std |
Mean |
Std |
Mean |
|
|
MRI |
70.0623 |
182.2473 |
74.0267 |
180.0172 |
0.2518 |
0.6999 |
|
Cancer |
61.2939 |
62.4918 |
64.0972 |
63.9113 |
0.2073 |
0.2446 |
|
X-Ray |
65.4542 |
145.47576 |
68.2635 |
144.9646 |
0.2409 |
0.5613 |
|
Brain |
91.0872 |
85.9561 |
92.5692 |
87.1018 |
0.6649 |
0.3414 |
(a)Original image(Brain image)
(a) Original MRI image


(c) Applying Adaptive Filter
(c) Applying Average
Fig4.6.1 Shows finding the salt and pepper noise in MRI, Cancer, X-ray, Brain images and applying the adaptive filter on these images.
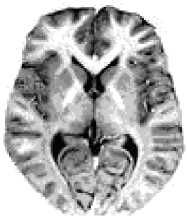
After finding the salt and pepper noise and applying the average filter on these images.
(a) Original Cancer image

(c) Applying Average Filter
(c) Applying average Filter
(a)Original image (Brain image)
(a) Original x-ray image


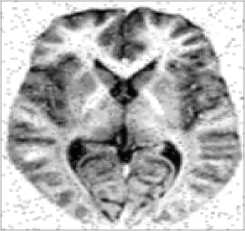
Fig4.10.1 Shows finding the salt and pepper noise in MRI, Cancer, X-ray, Brain images and applying the average filter on these images.
-
III- DISCUSSION:
As per discussed in Different medical images like MRI, Cancer, x-ray and brain images have been studied. After finding the salt and pepper noise in MRI image various filtering techniques have been applied and it is found that the adaptive filter works better for the noisy image. The standard derivation for the noisy image is 74.0267 and the standard derivation for the adaptive filtered image is 65.7016.
After finding the salt and pepper noise in Cancer image various filtering techniques have been applied and it is found that the median filter works better for the noisy image. The standard derivation for the noisy image is 64.0972 and the standard derivation for the adaptive filtered image is 53.1813.
After finding the salt and pepper noise in X-ray image various filtering techniques have been applied and it is found that the median filter works better for the noisy image. The standard derivation for the noisy image is 68.2635 and the standard derivation for the adaptive filtered image is 64.8242.
After finding the salt and pepper noise in Brain image various filtering techniques have been applied and it is found that the adaptive filter works better for the noisy image. The standard derivation for the noisy image is 92.5692 and the standard derivation for the adaptive filtered image is 89.1596
-
IV- CONCLUSION:
References Study of Noise Detection and Noise Removal Techniques in Medical Images
- Rafael C.Gonzalez & Richard E.Woods, “Digital Image Processing”, Second edition, 2005.
- Bhausaheb Shinde, Dnyandeo Mhaske, A.R. Dani “Study of Image Processing, Enhancement and Restoration “ IJCSI, Vol. 8, Issue 6, No 3, November 2011
- Rafael C.Gonzalez & Richard E.Woods, “Digital Image Processing using MATLAB”, Pearson education 2004.
- Bhausaheb Shinde, Dnyandeo Mhaske, Machindra Patare, A.R. Dani,A.R. Dani “Apply Different Filtering Techniques To Remove The Speckle Noise Using Medical Images” International Journal of Engineering Research and Applications, Vol. 2, Issue 1,Jan-Feb 2012, pp.1071-1079
- Bhausaheb Shivajirao Shinde, A.R. Dani “ The Origins of Digital Image Processing & Application areas in Digital Image Processing Medical Images” IOSR Journal of Engineering Vol. 1, Issue 1, pp.066-071
- S.S.Gornale et.al,”Evaluation & selection of wavelet filters for de-noising medical images using Stationary wavelet Transform (SWT)”International conference on systemic, cybernetics and informatics ICSCI2007.
- Adrian Low ,”Computer Vision & Image Processing”, McGraw Hill(1991)
- www.mathworks.com (Digital image processing)
- Milan Sonka et.al,”Image Processing Analysis and Machine Vision“, International Thomson computer press, UK-1996.
- A.Buades, B Coil, J.M.Morel (2005),”A Review Of Image Denoising Algorithms with New one”, Multiscale Model, Simulation, Vol.4, No.2, pp: 496-530, Industrial and applied Mathematics.
- Shalkoff R.J, 1989, John wiley and sons, New York, “Digital Image Processing and computer vision”.
- Rafael C. Gonzalez, Richard E. Woods, “Digital Image Processing”, 1st Edition
- Castleman, K.R [1996]. “Digital Image Processing”, 2nd ed., Prentice Hall, Upper Saddle River.
- www.mathworks.com (Digital image processing)
- Rafael C.Gonzalez & Richard E.Woods, “Digital Image Processing”, Second edition, 2005.
- Shalkoff R.J, 1989, John wiley and sons, New York, “Digital Image Processing and computer vision”.
- Milan Sonka et.al,”Image Processing Analysis and Machine Vision“, International Thomson computer press, UK-1996.
