Study of segmentation techniques for assessment of osteoarthritis in knee X-ray images

Author: Shivanand S. Gornale, Pooja U. Patravali, Archana M. Uppin, Prakash S. Hiremath
Journal: International Journal of Image, Graphics and Signal Processing @ijigsp
Article in issue: 2 vol.11, 2019.
Free access
Arthritis is one of the chronic joint disorders that have affected many lives including middle age and older age group. Arthritis exists in many forms and one among them is Osteoarthritis. Osteoarthritis affects the bigger joints like knee, hip, spine, feet etc. Early detection of Osteoarthritis is most essential if not treated properly may result in deformity. The researchers have become more concerned to detect the disorder in the early stage by merging their medical knowledge with machine vision approach in an appropriate way. The objective of this work is to study various segmentation techniques for the detection of Osteoarthritis in the early stage. The different segmentation technique like Sobel and Prewitt edge segmentation, Otsu’s method of segmentation and Texture based segmentation are used to carry out the experimentation. The different statistical features are computed, analyzed and classified. The accuracy rate of 91.16% for Sobel method, 96.80% for Otsu’s method, 94.92% for texture method and 97.55% for Prewitt method is obtained. The results are more promising and competitive which are validated by medical experts.
Osteoarthritis, Knee X-ray, Sobel edge detection, Prewitt edge detection, Otsu’s Segmentation, Texture based Segmentation, k-Nearest Neighbor
Short address: https://sciup.org/15016034
IDR: 15016034 | DOI: 10.5815/ijigsp.2019.02.06
Text of the scientific article Study of segmentation techniques for assessment of osteoarthritis in knee X-ray images
Published Online February 2019 in MECS
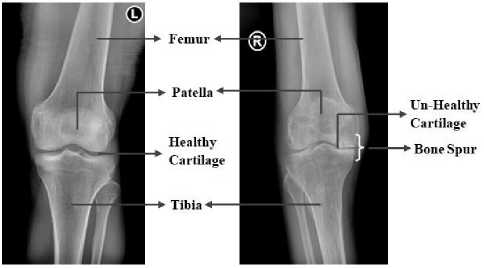
Table 1. KL Grading System
|
KL Grades |
OA Analysis |
|
G-0 |
OA related Radiographic elements absent |
|
G-1 |
Doubtful OA(thinning of joint space) |
|
G-2 |
Mild OA(exact thinning of joint space) |
|
G-3 |
Moderate OA (multiple osteophytes, sclerosis) |
|
G-4 |
Severe OA ( large osteophytes, severe sclerosis, bone deformity) |
The possibility of misinterpretation with respect to radiological parameter is high during early OA. Therefore to overcome this misconception extracting the middle/ centre region of the image is important task and this task can be implemented using various computer aided techniques. The researchers have become more concerned to detect the disorder in the early stage by merging their medical knowledge with machine vision approach in an appropriate way [5]. The purpose of this work is to study a range of segmentation methods for the early recognition of Osteoarthritis.
This section gives an overview of various segmentation methods used for analysis of medical imaging. In the literature, the detail description of manual segmentation and automatic segmentation methods are evaluated for the assessment of disease in the early stage.
Dzung L.Pham et al [1], have reviewed the current methods for automated segmentation of anatomical medical images. The authors have discussed various segmentation methods like thresholding approaches, region growing, classifiers, clustering approaches, Markov random field models, artificial neural networks, deformable models and atlas guided approaches along with advantages and disadvantages with respect to the medical imaging analysis. They concluded that in future the study of segmentation methods shall be discussed with respect to biomedical field.
Alireza Norouzi et al. [2] have described newest segmentation techniques useful in medical image analysis. Methods discussed are classified into 4 classes; region based methods, clustering, classifiers and hybrid methods. They concluded that the thresholding and region growing approaches are simple to implement but are sensitive to noise whereas clustering and classification approaches have high time complexities that are difficult to implement. Lastly they also presumed that hybrid approach obtained optimum results with reasonable accuracy.
Cristina Stolojescu- Crisan et al [7], have reviewed the most important segmentation methods like thresholding, region based, edge based, clustering, deformable models and atlas based methods that are applicable on X-ray images. The results predict that the simple medical image segmentation can be implemented using threshold, region based methods, edge based and clustering and also by combining two or more methods. Further the deformable or atlas based segmentation are considered to be more suitable for complex medical image segmentation. As a future work, combination of classical and complex segmentation methods is considered for better and competitive accuracy
Jing Wu et al [8], have used clustering based segmentation and active shape model based segmentation method to extract the distal femur and proximal tibia in knee x-ray. The methods have outperformed their previous experimental results by obtaining root means square error of 0.48 ± 0.13mm for femur and 0.53 ±0.18mm for tibia. Further the evaluation of joint space width (JSW) is considered as a future work.
Maxim D. Ryzhkov [9], have critically reviewed various methods present in the literature mainly for segmentation of knee cartilage. In the work, each method used has their own pros and cons based on the type or quality of the image used. They concluded that not only the manual segmentation is considered as a golden standard for segmentation, but from recent literature semi automated or fully automated methods can also become a standard method for quantification of knee cartilage.
S. S. Gornale et al. [3-5], have used a semi-automated machine vision approach for the analysis of Osteoarthritis in digital knee x-ray images. In [3-5] active contour segmentation method is used and various textural based, shape based and statistical based features are evaluated using Random forest classifier, which yielded the classification accuracy of 87.92% [3]. Further various textures based and Zernike moments were computed and implemented using K-nn classifier obtaining the accuracy rate of 88.88% [4]. In [5] HOG features were computed and multiclass SVM was used for classification by achieving classification accuracy of 95%.
From the literature, it is observed that various segmentation methods including classical as well as complex have been elaborated with respect to medical imaging. However, there is still a need to statistically analyze these segmentation methods for proper diagnosis of ailment. In this paper, the main objective is to analyze the disorder in the early stage for the appropriate assessment of Osteoarthritis in knee x-ray images using different segmentation methods and evaluating according to the standard KL grading framework.
-
III. Proposed methodology
The proposed methodology comprises the Knee X-ray images with DICOM standards, extraction of region of interest (OA region), basic statistical feature computation and K-nn classification of OA into KL grades. The block diagram of the proposed methodology is shown in the Fig 2.
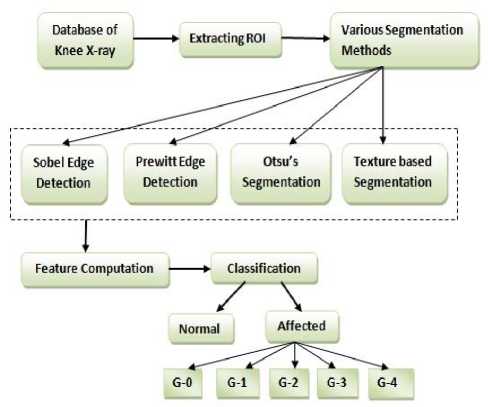
Fig.2. Block Diagram of the proposed methodology (G-0: Normal, G-1: Doubtful, G-2: Mild, G-3: Moderate, G-4: Severe)
-
A. Data set
For experimentation of the proposed work, own dataset is prepared by collecting 532 digital knee X-ray images by consulting various hospitals and diagnostic centers of rural and urban population. The knee x-ray images are acquired with 1345x2455 dimensions compliant with DICOM standard (Digital Imaging and Communications in Medicine). The images collected are primarily based on demographic characteristics namely, age, gender, blood group, occupation and weight. Out of 532 patients 301 are female and 231 are male. The most elevated number 304 were accounted in an age group of around 41-50 years and 218 were accounted in the age group of 51-60 years as depicted in Table 2.
Table.2. Demographic data of patients
|
Age in years |
Male |
Female |
Total |
|
41-50 |
115 |
189 |
304 |
|
51-60 |
110 |
108 |
218 |
|
61-70 |
06 |
04 |
10 |
Every single knee x-ray image was assigned a KL grade by two different medical experts. The two experts are orthopedicians who read 50 to 100 radiographic images every day. The total number of images with different KL grading by two experts is given in the Table 3.
Table 3. KL grades assigned by 2 Medical Experts
|
KL Grade |
Medical Expert-I |
Medical Expert-II |
|
Normal(G-0) |
337 |
348 |
|
Doubtful(G-1) |
139 |
128 |
|
Mild(G-2) |
31 |
31 |
|
Moderate(G-3) |
09 |
09 |
|
Severe(G-4) |
16 |
16 |
B. Extracting ROI
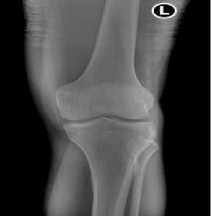
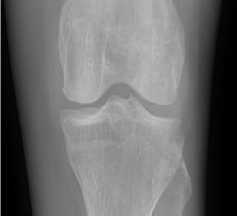
Extracting the region of interest (ROI) is a challenging work in processing of the images. The intended ROI of knee x-ray is mostly present in the central bidirectional axis [11]. The primary step is to segment the entire image into numerous parts row wise along the axes. The second step incorporates extracting the necessary region from each segmented part. The third step is to calculate the density/thickness of each segmented part [6, 12]. The region in the image with high density value is always more dense or thicker, which results in high density value. The region with high density value is extracted and used for further processing. The input image and its ROI is shown in Figure 3
(a)
(b)
Fig.3(a) Input Knee X-ray, (b) Extracted Region of interest
-
C. Segmentation
Image segmentation is a process of partitioning an image into multiple sub-areas based on characteristic of objects in the image. In the proposed experiment various segmentation methods are applied to the extracted ROI which will help in detecting the disease in early stage. The segmentation techniques used are Sobel edge detection, Prewitt edge detection, Otsu’s based segmentation and Texture based segmentation.
Sobel Edge Detection : Sobel edge detection is one of the simplest and robust methods that mainly highlight the region of high spatial frequency and carry out 2-D spatial gradient measurement [14]. The goal of the operator at a given point is to find the approximate gradient magnitude from the given input gray image. The operator consists of two 3x3 convolution kernels. One is simply the other rotated by 90o.
G
x
G y
Fig 4. Sobel convolution kernel
These kernels are composed such that they should have the capacity to react to edges running vertically and horizontally at its maximum [17]. For the given input image different orientations are considered and these kernels are applied separately for each orientation that generates different gradient components. Finally all the measurements are merged to obtain absolute magnitude of the gradient and its orientation. The gradient magnitude is given by help in getting the information regarding local variations of pixels intensity values in an image.
Prewitt Edge Detection : Prewitt operator is one of the traditional operators used in computer vision and image processing. The overall performance of Sobel and Prewitt operator is same except the kernel [14]. Prewitt have a different convolution kernel with number of orientations limited to 8 [17, 19]. In this operator 3x3 neighborhood for 8 directions is calculated and convolution mask with highest component is chosen. The convolution masks are shown in Fig. 5.
|
-1 |
-1 |
-1 |
|
0 |
0 |
0 |
|
+1 |
+1 |
+1 |
|
-1 |
0 |
+1 |
|
-1 |
0 |
+1 |
|
-1 |
0 |
+1 |
I g| = G + G У
G x G y
Fig.5. Prewitt convolution kernel
Appropriate magnitude is figured out using
I G = G J+ G y
The angle of orientation of the edge is specified by
0 = arctan
( G y/ )
I / G . J
Otsu’s Segmentation : Otsu’s method is imperative techniques used in computer vision and processing of the images [2]. The main task of the method is to lessen the gray values of an image to obtain a binary image. According to the Otsu’s algorithm, the image consists of two class pixels i.e. foreground and background pixels, which are further used in calculating the finest threshold by segregating the two classes so that their collective spread is negligible [2].The procedure is to reduce the intra class variance (weighted sum of variances of the two classes) by exhaustively searching the appropriate threshold as given in the equation (4)
O„(t) = too(t)a0(t) + ®i(t)№ (t) (4)
Where, ω0 and ω1, are the probabilities of the two categories segregated by a threshold t and o 0 and o ! are variances of these two classes.
Texture based Segmentation : Texture segmentation can be widely used for detailed visualization and evaluation of medical images. The method can help in highlighting the texture region of the image that is not visible through naked eyes. During medical image analysis it is observed that there is very little gray level transition of background image compared to the foreground image. Thus the contours of foreground image exhibit more texture resulting high range values with more variability [8]. The texture analysis function mainly uses a standard statistical measure that helps in characterizing the texture of an image [16]. They also
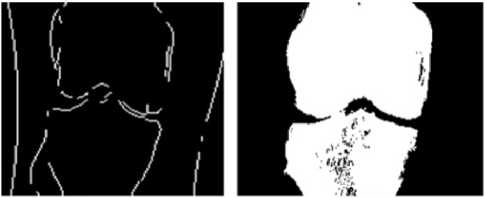
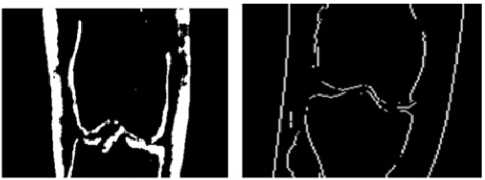
The output of all segmentation methods are shown in Figure 6 below
(a) (b)
(c) (d)
Fig.6: Segmented images: (a) Sobel edge detection (b) Otsu’s Segmentation (c) Texture based segmentation (d) Prewitt edge detection
-
D. Feature Extraction
Feature Extraction is important modules in processing of images. In the experimentation various statistical features are computed that results in recognition accuracy with very simple classification module [3, 15]. The feature computation includes simple features like Major axis length, Minor axis length, entropy, variance and standard deviation.
-
• Major axis length is the length of the major axis of the ellipse where as Minor axis Length is the length of the minor axis of the ellipse that has the same normalized second central moments as the region.
MajorAxis = ( a + b ) (5)
Where, a, b are the distances from each focus to any points on the ellipse.
MinorAxis = (a a + b) — f (6)
Where, f is the distance between foci and a, b are the distances from each focus to any points on the ellipse.
-
• The Entropy and Variance statistical measures are specified in the below equations
Entropy = E p , log 2 p, (7)
Where, p contains the normalized histogram counts obtained from the image histogram.
2 E ( X i - P ) (8)
^ =---- n----
Where, x i is each term, µ is the mean and n is the number of terms in the distribution.
-
• In statistics Standard deviation is most widely utilized measure of inconsistency or variability. The standard deviation represented as σ is given in the equation below
a = ^ ( x i -JiL (9)
n
Where, xi is each term, µ is the mean and n is the number of terms in the distribution
-
E. Classification
K nearest neighbors is a straightforward memory based model that accumulates all the known instances and classifies new outcome instance based on a similarity measures. The reason for the k Nearest Neighbors (kNN) calculation is to utilize a database in which the information are isolated into to a new separate classes to anticipate the characterization of new sample point. The classifier uses all the possible patterns available in the test pattern [2]. The training phase is pretty fast in KNN algorithm that does not make any hypothesis based on primitive data propagation [18]. In this algorithm the trained data set does not use any abstraction and all training data is required during testing phase. The affinity between the test data and the training set is virtually obtained by the classifier. The class label obtained is equated to the test pattern of the nearest neighbors [15]. Let n be the training patterns,
(X1,θ),(X2,θ).....(Xn,θ) ,where Xi is the dimension and θi is the class label of ith pattern. If p is the test pattern, then d (P, Xk ) = min {d (P, Xi)} (10)
Where, i=1......n, pattern P is assigned to the class θk associated with Xk .
The algorithm has different behavior based on k that is represented in experimental analyses section.
-
IV. Experimental Analyses
For the experimentation own dataset of 532 digital Knee X-ray images with DICOM standards is considered in consultation with medical experts. These images are collected from various hospitals and diagnostic centers. The basic statistical features are computed and classified using K- nearest neighbor classifier. The algorithm proposed for the experimentation is given below.
Input: Knee X-ray image with DICOM standards
Output: KL Grade-wise classification
(Normal/Affected)
Step-1: Image acquisition.
Step-2: Extracting region of interest
-
• Initially bone edge detection is carried out
-
• Extracting the region of interest using pixel
density
Step-2: Different Segmentation methods applied on extracted ROI.
-
• Sobel edge detection
-
• Otsu’s based segmentation
-
• Texture based segmentation
-
• Prewitt edge detection
Step-3: Computation of basic statistical features.
Step-4: Classification of computed features using k-NN classifiers.
-
• for nearest neighbor value k=1
-
• for nearest neighbor value k=3
Step-5: End
The proposed method is implemented using MATLAB R2016 (a) with Corei3-4030U Processor and 4GB RAM. In the work the K-nearest neighbor classifier is used for classification in which we have considered two nearest neighbor values for k, i.e. k=1 and k=3 and the results obtained are more promising and competitive. The classification accuracies of different segmentation methods used in the experimentation are represented in the confusion matrices (for nearest value k=1 and k=3) with reference to the two medical experts I and medical expert II opinions.
The confusion matrices obtained using Sobel edge detection for medical expert-I and medical expert-II opinions for the nearest neighbor values k=1 and k=3 are given in Table 4. From this, the accuracy rate of 90.60% is obtained for medical expert-I and accuracy of 86.27% is obtained for medical expert-II database for the value of k=1. Similarly, for k=3, it is found that the accuracy rate of 91.16% is obtained for medical expert-I and accuracy of 88.34% is obtained for medical expert-II database.
The confusion matrices obtained using Otsu’s based segmentation for medical expert-I and medical expert-II opinions for the nearest neighbor values k=1 and k=3 are given in Table 5. From this, the accuracy rate of 96.61% is obtained for medical expert-I and accuracy of 93.79% is obtained for medical expert-II database for the value of k=1. Similarly, for k=3, it is found that the accuracy rate of 96.80% is obtained for medical expert-I and accuracy of 94.54% is obtained for medical expert-II database.
The confusion matrices obtained using Texture based segmentation for medical expert-I and medical expert-II opinions for the nearest neighbor values k=1 and k=3 are given in Table 6. From this, the accuracy rate of 94.17% is obtained for medical expert-I and accuracy of 90.97% is obtained for medical expert-II database for the value of k=1. Similarly, for k=3, it is found that the accuracy rate of 94.92% is obtained for medical expert-I and accuracy of 92.85% is obtained for medical expert-II database.
Lastly, the confusion matrices obtained using Prewitt edge detection for medical expert-I and medical expert-II opinions for the nearest neighbor values k=1 and k=3 are given in Table 7. From this, the accuracy rate of 96.61% is obtained for medical expert-I and accuracy of 93.23% is obtained for medical expert-II database for the value of k=1. Similarly, for k=3, it is found that the accuracy rate of 97.55% is obtained for medical expert-I and accuracy of 95.11% is obtained for medical expert-II database.
|
Segmentation methods |
K=1 |
K=3 |
||
|
Medical Expert-I |
Medical Expert-II |
Medical Expert-I |
Medical Expert-II |
|
|
Sobel Edge Detection |
90.60% |
86.27% |
91.16% |
88.34% |
|
Otsu’s based Segmentation |
96.61% |
93.79% |
96.80% |
94.54% |
|
Texture based Segmentation |
94.17% |
90.97% |
94.92% |
92.85% |
|
Prewitt Edge Detection |
96.61% |
93.23% |
97.55% |
95.11% |
The comparative analysis of proposed method with medical experts opinion by using k-NN classifier (k=1 and k=3) is represented graphically in the Figure 7 and 8 respectively.
From the experimental results, it is observed that the attainment of Sobel method is inferior as compared to other methods used in the experiment whereas Prewitt and Otsu’s method obtained competent and adequate results. The proposed method outperformed the methods in [3-5] by obtaining the accuracy rate of 97.55% for Prewitt method and 96.80% for Otsu’s method.
-
V. Conclusion
The purpose of this study is to assimilate the cartilage structure to overcome the disease progression by using different segmentation methods. Based on the cartilage structure the patients are advised with appropriate treatment in early stage, which leads to minimal pain and less expense. The Prewitt and Sobel edge methods consider edge feature as important information for the image segmentation. A Prewitt method is more sensitive to the vertical and horizontal edges whereas Sobel operator is more sensitive to the diagonal edge. One of the challenging task in segmentation is to separate the objects. If the numbers of objects are more the segmentation becomes more complex. Otsu’s method is more suitable for the objects with homogeneous region.
In Otsu method as the number of objects increases the computational complexity increases for multilevel threshold selection. The texture method provides small values for smooth area and has large values for rough area images. The input images used in this work have high contrast between foreground and background and also have less diagonal edges, thus the performance of Otsu and Prewitt method is high compared to Sobel operator. The proposed method has outperformed the methods in [3-5] by achieving classification accuracy of 97.55% for Prewitt method and 96.80% for Otsu’s based segmentation. In future, one can enhance segmentation accuracy and classification rate by using still better methods for preprocessing, segmentation and classification.
Conflict of interest
The authors declare no conflict of interest regarding the publication of this work.
ACKNOWLEDGEMENT
References Study of segmentation techniques for assessment of osteoarthritis in knee X-ray images
- Dzung L. Pham, Chenyang Xu, and Jerry L. Prince, “Current Methods in Medical Image Segmentation”, Annual Review of Biomedical Engineering 2000, Volume 2, pp: 315-337, DOI: 10.1146/annurev.bioeng.2.1.315, 2000.
- Alireza Norouzi, Mohd Shafry Mohd Rahim, Ayman Altameem, Tanzila Saba, Abdolvahab Ehsani Rad, Amjad Rehman & Mueen Uddin (2014) “Medical Image Segmentation Methods, Algorithms, and Applications”, IETE Technical Review, 31:3, 199-213, DOI:10.1080/02564602.2014.906861
- Shivanand S. Gornale, Pooja U. Patravali, Ramesh R. Manza, “Detection of Osteoarthritis using Knee X-Ray Image Analyses: A Machine Vision Based Approach”, International Journal of Computer Applications (IJCA), ISSN-0975-8887, Volume 145, Number 1, July 2016,pp.20-26.
- Shivanand S. Gornale, Pooja U. Patravali, Ramesh R. Manza, “Computer Assisted Analysis and Systemization of knee Osteoarthritis using Digital X-ray images”, Proceedings of 2nd International Conference on Cognitive Knowledge Engineering(ICKE), Chapter 42, pp:207-212, ISBN 978-93-86751-04-1, Excel Academy Publishers, Aurangabad, Maharashtra, December 2016.
- Shivanand S. Gornale, Pooja U. Patravali, Kiran S. Marathe, Prakash S. Hiremath," Determination of Osteoarthritis Using Histogram of Oriented Gradients and Multiclass SVM", International Journal of Image, Graphics and Signal Processing(IJIGSP), Vol.9, No.12, pp. 41-49, 2017. DOI: 10.5815/ijigsp.2017.12.05
- Shivanand S. Gornale, Pooja U. Patravali, Ramesh R. Manza“A Survey on Exploration and Classification of Osteoarthritis Using Image Processing Techniques”, International Journal of Scientific & Engineering Research, Volume 7, Issue 6, June-2016 ISSN 2229-5518 ,pp.334-355.
- Cristina Stolojescu-Crişan, Ştefan Holban, “A Comparison of X-Ray Image Segmentation Techniques”, Advances in Electrical and Computer Engineering, Volume 13, Number 3, pp: 85-92, 2013, DOI: 10.4316/AECE.2013.03014
- Jing Wu, Mohamed R. Mahfouz, “Robust X-Ray Image Segmentation by Spectral Clustering And Active Shape Model,” Journal of Medical Imaging. 3(3), 034005 (2016), DOI: 10.1117/1.JMI.3.3.034005.
- Maxim Ryzhkov, “Knee Cartilage Segmentation Algorithms: A Critical Literature Review”, Faculty of Medicine theses (Master’s thesis), Utrecht University Repository, 2015
- Aleksei Tiulpin, Jerome Thevenot, Esa Rahtu, Petri Lehenkari, Simo Saarakkala, “Automatic Knee Osteoarthritis Diagnosis from Plain Radiographs: A Deep Learning-Based Approach”, Journal Scientific reports, Volume 8, Issue 1, DOI:10.1038/s41598-018-20132-7, 2018
- Cristina Stolojescu-Crisan and Stefan Holban, “An Interactive X-Ray Image Segmentation Technique for Bone Extraction”, International Work-Conference on Bioinformatics and Biomedical Engineering, IWBBIO 2014, Granada, Spain, April 7-9, 2014, Volume 13, Issue 3, pp: 85 – 92, ISSN: 1582-7445, e-ISSN: 1844-7600, DOI: 10.4316/AECE.2013.03014
- Nithya R and Santhi B, “Computer Aided Diagnostic System for Mammogram Density Measure and Classification”, Biomedical Research (0970-938X), Volume 28, Issue 6, 2017, pp.2427-2431.
- Luca Minciullo, Tim Cootes, “Fully Automated Shape Analysis for Detection of Osteoarthritis from Lateral Knee Radiographs 2016”, 23rd International Conference on Pattern Recognition (ICPR), December 4-8, 2016, pp: 3787-3791, DOI: 10.1109/ICPR.2016.7900224.
- Cristina Stolojescu-Crisan, and Ştefan Holban, “A Comparison of X-Ray Image Segmentation Techniques”, Advances in Electrical and Computer Engineering, Volume 13, Number 3, 2013, DOI: 10.4316/AECE.2013.03014.
- S.S.Gornale, Pooja U. Patravali, “Medical Imaging in Clinical Applications: Algorithmic and Computer based approaches”, Basic Chapter, “Engineering and Technology: Latest Progress”, pp: 65-104, ISBN 978-81- 932850-2-2, 2017.
- Reska D., Boldak C., Kretowski M, “A Texture-Based Energy for Active Contour Image Segmentation”, In: Choraś R. (eds) Image Processing & Communications Challenges 6. Advances in Intelligent Systems and Computing, Vol 313. Springer, Cham 2015, pp:187-194, doi.org/10.1007/978-3-319-10662-5_23
- Ajenaghughrure Ighoyota Ben, Ogini Nicholas.O., Onyekweli Charles O.,"Optimum Fuzzy based Image Edge Detection Algorithm", International Journal of Image, Graphics and Signal Processing(IJIGSP), Vol.9, No.4, pp.44-55, 2017.DOI: 10.5815/ijigsp.2017.04.06
- Amit Pandey, Achin Jain,"Comparative Analysis of KNN Algorithm using Various Normalization Techniques", International Journal of Computer Network and Information Security(IJCNIS), Vol.9, No.11, pp.36-42, 2017.DOI: 10.5815/ijcnis.2017.11.04
- Shiv Gehlot, John Deva Kumar," The Image Segmentation Techniques", International Journal of Image, Graphics and Signal Processing (IJIGSP), Vol.9, No.2, pp.9-18, 2017.DOI: 10.5815/ijigsp.2017.02.02.
