Study of the auroral emissions and electron precipitation depending on the solar activity

Author: Guineva V., Trondsen E., Marple S., Hall Ch.M., Cannon P., Hansen T.L.
Journal: Солнечно-земная физика @solnechno-zemnaya-fizika
Article in issue: 12 т.2, 2008.
Free access
Simultaneous observations of the OI 5577 A and 6300 A emissions, the electron precipitation, the terrestrial magnetic field and the plasma parameters, and the corresponding solar wind, Interplanetary Magnetic Field and geomagnetic activity indices data have been used in order to study the Sun-Earth interactions under various conditions. Images of 5577 A and 6300 A emissions have been obtained from the All-Sky Imager (ASI), positioned at ARR, Andenes (69.3° N, 16.03° E). The Imaging Riometer for Ionospheric Studies (IRIS), at Kilpisjarvi, Finland (69.05° N, 20.79° E) gave information about the precipitating electrons with energies in the range 10-100 keV and deposition heights centered at about 90 km. The magnetic field components have been measured by the Andenes magnetometer (69.3° N, 16.03° E). The essential ionosphere parameters have been acquired from the measurements of the Digisonde, situated at Troms0 (69.6° N, 19.2° E). A good correlation between the spatial and temporal evolutions of the optical emissions, the precipitating electron fluxes and the terrestrial magnetic field has been observed. The response of the ionosphere to the solar and geomagnetic activity changes has been studied. The study is performed under a project, part from the ALOMAR eARI Project, EU's 6th Framework Programme, Andenes, Norway.
Short address: https://sciup.org/142103243
IDR: 142103243 | UDC: 523.98,
Изучение влияния солнечной активности на авроральную эмиссию и высыпание электронов
Для изучения взаимодействия Солнца-Земля при различных условиях использовались одновременные наблюдения за эмиссией OI 5577 А и 6300 А, высыпанием электронов, магнитным полем Земли и параметрами плазмы, а также данные показателей соответствующего солнечного ветра, межпланетного магнитного поля и геомагнитной активности. Изображения эмиссий 5577 А и 6300 А были получены на камере всего неба (All-Sky Imager), расположенном в ARR, Анденесе (69.3° N, 16.03° Е). Благодаря использованию риометра изображений для изучения ионосферы (IRIS) в Кил-письярви, Финляндия (69.05° N, 20.79° Е), была получена информация о высыпании электронов с энергиями в диапазоне 10-100 кэВ, и высотами высыпания, центрированными примерно на 90 км. Компоненты магнитного поля измерялись магнитометром в Анденесе (69.3° N, 16.03° Е). Основные параметры ионосферы были получены по данным дигизонда, расположенного в Тромсе (69.6° N, 19.2° Е). Наблюдается хорошая корреляция между пространственными и временными эволюциями излучения в оптическом диапазоне, потоками высьшающихся электронов и магнитным полем Земли. Изучен отклик ионосферы на изменения солнечной и геомагнитной активности. Исследование выполнено в рамках проекта, являющегося частью Проекта ALOMAR eARI, 6-ой Рамочной Программы ЕС, Анденес, Норвегия.
Text of the scientific article Study of the auroral emissions and electron precipitation depending on the solar activity
The generation and dynamics of the auroral arcs are in close relation with all processes in the magnetosphere and ionosphere, the Solar influence on the Earth atmosphere and the chemistry and the energy balance in the lower atmosphere. For that reason the study of the optical events at high latitudes and their connection to other occurring phenomena is of great importance for the understanding of the complex and multiform interactions, describing the Sun–Earth relations. The variety of the auroral forms and their behaviour, as a result of the complexity of the processes in the upper atmosphere at high latitudes and the connection between them as well as the large number of influencing factors give the researchers a lot of possibilities for new investigations. The improvement of the observational equipment and the opportunities for simultaneous multi-instrument observations by different instruments, as well by sets of instruments of the same kind, often including both ground-based and satellite or rocket measurements (for example [1–9]. Each instrument individually provides valuable information concerning certain aspects of the ionosphere, yet taken together, the data from several different instruments complement each other to give a comprehensive picture of the polar ionosphere.
For a number of cases, several interpretations of the observations can be presented [1, 10, 11, 12, 13] or suggestions can be made [12, 14, 15]. More multi- instrument observations and studies are needed to clarify and explain the high-latitude ionospheric phenomena and the complex relations between the optical auroral structures, and the geomagnetic conditions and the solar activity, solar wind and IMF parameters.
The Norwegian island Andøya affords excellent opportunities for the Arctic atmosphere and ionosphere research not only thanks to its geographic position, but to the rich complex of instruments, installed and functioning in ALOMAR and Andøya Rocket Range.
Examined periods
In this work, the emissions and the precipitating electron fluxes in the Northern polar oval areas under different space and geomagnetic conditions are studied and their relation to other ionospheric and magnetospheric processes is examined. During November 2005, measurements of the 5577 Å and 6300 Å emissions have been performed by the All Sky Imager (ASI), when the needed climatic conditions were present. Simultaneous All-sky camera data are used to watch the atmospheric conditions.
Taken into account the measurement days, the observed intensities and the space and geomagnetic conditions, two periods were chosen: a quiet night (November 7, 2005, 15:30:00 UT – November 8, 2005, 5:50:00 UT) and one at highly disturbed geomagnetic conditions (November 3, 2005, 15:50:00 UT–November 4, 2005,
5:40 UT). The first night is among the quietest ones (Nov. 8 is Q4) and the second one – among the most disturbed ones (Nov. 3 and 4 are D1 and D2, the most disturbed days) for November 2005.
Space and geomagnetic conditions in November 2005
Satellite data are used to trace out the course of the Interplanetary Magnetic Field (IMF), the solar wind parameters, the energy input in the Northern hemisphere and the geomagnetic indices. The values of the IMF are shown in Fig. 1. The solar wind speed, the proton density and the ion temperature are presented in Fig. 2. These data are from the magnetometer (MAG) and the Solar Wind Electron Proton Alpha Monitor (SWEPAM) on board the Advanced Composition Explorer (ACE) satellite. The auroral particles power input in the Northern hemisphere in November 2005 is given in Fig. 3. Data of the power flux carried by protons and electrons that produce aurora in the atmosphere are recorded by the instruments on board the NOAA Polar-orbiting Operational Environmental Satellite (POES). In Fig. 4, the course of the planetary indices kp and Ap in November 2005 is given. These indices are estimated on the basis of the measurements of a set of stations. The examined periods are marked in all figures with rectangles. For these periods, noticeable difference in the total value of the IMF is observed (Fig. 1). The Bz component of the IMF is negative during the disturbed period and positive during the quiet one. In the solar wind speed and ion temperature, an abrupt increase is registered some 24 hours before the most disturbed period. A peak in the proton density at the same time is seen (Fig. 2). A sharp increase in the auroral particles power input occurred about 24 hours before the disturbed period, as well (Fig. 3). The values of the power input during the disturbed and the quiet period differ by one order. The values of kp and Ap are maximal during the disturbed period and much lower during the quiet one (Fig. 4).
Observations
Images of 5577 Å and 6300 Å emissions during the examined periods are obtained from the All-Sky Imager (ASI). The distribution of the energetic particles precipitation is given by the Imaging Riometer for Ionospheric Studies (IRIS) measurements. The changes in the magnetic field components are recorded by the Andenes Magnetometer. The Tromso Digisonde provides information about the plasma parameters.

Fig. 1. Total value of the IMF in November 2005 after ACE Satellite data.
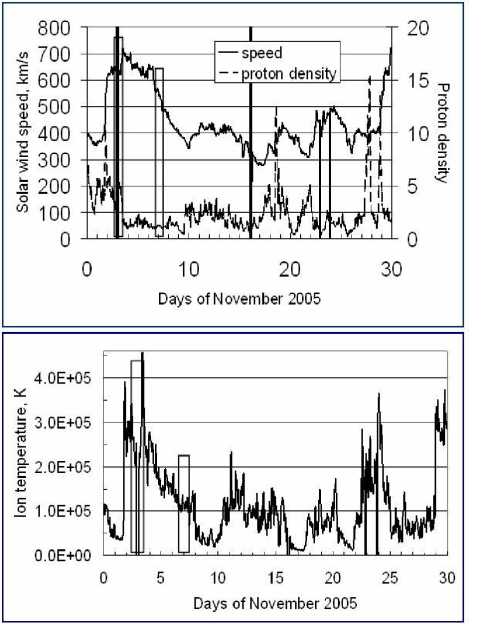
Fig. 2. Some Solar wind parameters in November 2005 (ACE data).
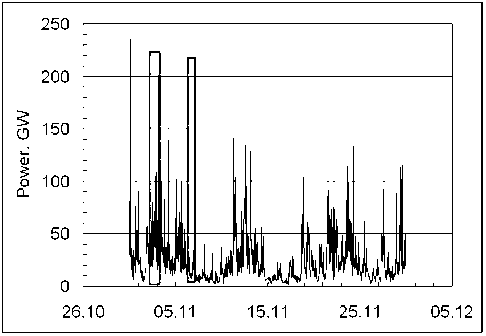
Fig. 3. Auroral particles power input in the Northern hemisphere during November 2005 (NOAA POES measurements.
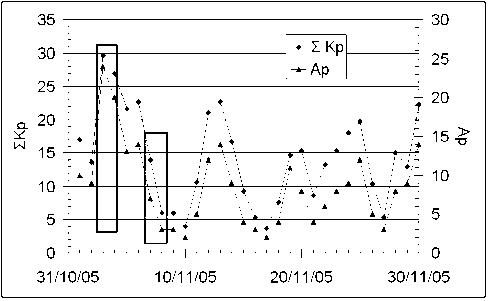
Fig. 4. kp and Ap geomagnetic indices in November 2005.
All-Sky Imager (ASI)
ASI is positioned at ARR, Andenes (69.3°N, 16.03°E). It records automatically the 5577 Å and 6300 Å emissions with 10 s time resolution, from a 180° field of view in a 512 x 512 matrix. The row data are processed in the Oslo University.
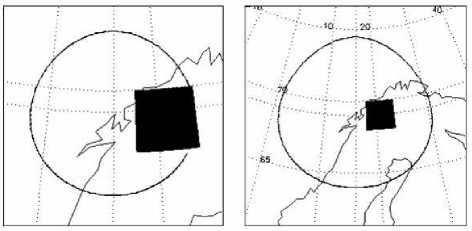
Fig. 5. Projected fields of view in geographic coordinates of ASI and IRIS.
Imaging Riometer for ionospheric Studies (IRIS)
IRIS, at Kilpisjärvi, Finland (69.05°N, 20.79°E), measures the absorption of cosmic noise at 38.2 MHz by 49 beams (7 x 7 area) every second. This absorption corresponds mostly to ionisation by electrons with energies in the range 10÷ x 100keV and deposition heights centered at about 90 km. The database is organized by the Lancaster University.
Andenes Magnetometer
The Andenes magnetometer (69.3°N, 16.03°E) measures the magnetic field components every second.
AND 03 Nov. 2005 UT18 5537A
AND 03 Nov. 2005 UT22 5577A AND 07 Nov. 2005 UT22 5577A
□ППНЕИВЯЯ48ВЯЯЯЯППЕП^4*
UasaaSHLO^ □□□□□□□□□!
□зввпппяиз' пппппппппа
МмМКЫИЫЯЯН □□□□□□□□□□
SRSSSStJ^jidtjl J32 зззяиаж-;:!
AND03Nov. 2005UT18 6300A
Lib □□□□□□□□□□
AND 03 Nov. 2005 UT22 6300A
□□□□ПВСВИ138
ЯЯЯЯЯЯВЯЯЯР6ВВВВВВВВЯЯ з.4
■3.6
яяяяяняяа
Г
1з.о
IRIS Absorption images м 03 Nov. 2005 UT18-19 A
■■■■■■■■■■
■■■■■■■■■■
■■■■■■■■■I
в^емевавв
■•tici^eM
0 2 4dB
3.4
3.3
3.2
3.1
3.0
2.9
AND 07 Nov. 2005 UT22 6300A
i| ПМВВВВВВГ5 L ■ BBDDEEBBKlU
^LJ^JLJ^JbJ^JkJ^JkJ ВПППППаППС
□□□□□□□□□□зз DDQnCQQann 2
□□□□□□□□□□r
IRIS Absorption images м 03 Nov. 2005 ПТ22-23Л
ВВВВВВВВВВ
DBBBBDBBBDr qqqqqhbbqqI
IRIS Absorption images i
07 Nov. 2005 UT22-23A вввввввввв вввввввввв вввваввввв вввввввввв вввввввввв вввавввввэ
0 0.4 dB
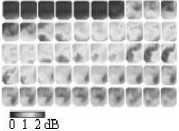
Fig. 6. Typical examples of 1-hour plots of the 5577 Å (up) images, 6300 Å ones (further down) and IRIS absorption ones (bottom). The left column presents the images of 18:00÷19:00h on 3 Nov. 2005 (when the most intensive glow for this day was observed), the central one is for 22:00÷23:00h on 3 Nov. 2005, and the right one is for 22:00÷23:00h on 7 Nov.2005 (when the most intensive glow for this day occurred).
Ab*ipl*ih(dB; 38 2MHz) Ab*qi1i3ii(dB, 38 2MHz)
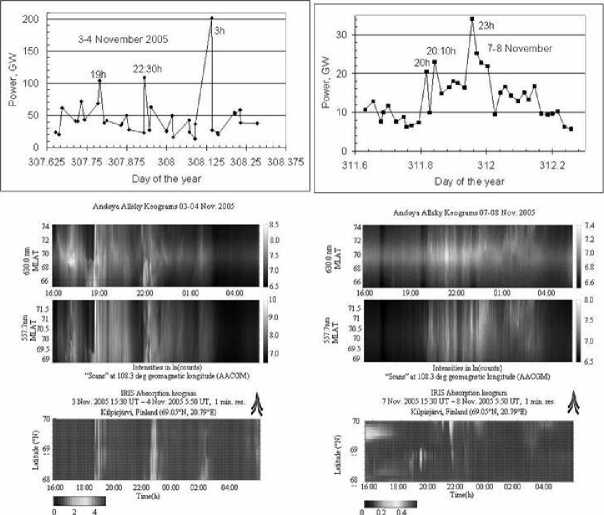
Fig. 7. Auroral particles power input (up), ASI (further down –6300 Å up, 5577 Å down) and IRIS (bottom) keograms for the examined periods. The keograms of 3–4 Nov. 2005 are on the left side and the ones of 7–8 Nov. 2005 are on the right side.
The vertical component (Z), the horizontal one (H) (along the magnetic meridian) and the declination (D) (perpendicular to H) are accumulated and processed at the Tromsø Geophysical Observatory, University of Tromsø, Norway.
Tromsø Digisonde
Ionograms, describing the essential ionosphere parameters are acquired at 15 minutes’ intervals after processing the data, registered by the Digisonde, situated at Tromsø (69.6N, 19.2E).
Projected fields of view in geographic coordinates of ASI and IRIS
ASI and IRIS are situated in the same area, not far each to other, and their fields of view overlap. The positions of the projected fields of view of the instruments are shown in Fig. 5 in geographic coordinates for both cases: 5577 Å and 6300 Å measurements by ASI. The ASI field of view (fenced in the circles) is taken ± 70° from zenith (the way the images are obtained), with assumed height of 120 km for the 5577Å emitting features and 250 km for the 6300 Å ones (the left and right pictures, respectively). The IRIS field of view is 18°÷23.5°E and 65.2°÷66.8°N, with energy deposition height, considered 90 km (the black rectangles). It is seen that the IRIS field of view falls within the ASI field of view in both cases.
Spatial distributions
The obtained ASI and IRIS images with 1 min. resolution for the quiet and disturbed periods are examined. The images present the spatial distribution of the auroral forms. The temporal evolution is given by the consecutive images. In Fig. 6, typical examples of 1-hour plots of the 5577 Å (up), 6300 Å (further down) images and IRIS absorption ones (bottom), are shown. The left column presents the images of 18:00÷19:00h on 3 Nov., 2005 (the most intensive glow on 3–4 Nov.), the middle column is for 22:00÷23:00h on 3 Nov. 2005, and the right one is for 22:00÷23:00h on 7 Nov.2005 (when the most intensive glow for this day occurred). In all images, North direction is up.
Fast glow changes (with the time scale of seconds) are observed during the disturbed period. Immense variety of forms generate, move through the field of view, changing in form and intensity. The observed arcs usually have sharp edges, and in most cases their direction is almost East–West, sometimes turning into NE-SW or NW-SE. On the common background of increased intensity, considerable glow enhancement occurred several times and persevered for more than half an hour (like the one presented in the figure). During the quiet period the glow is much weaker. Even in the time of higher glow values, the increase is slow and gradual. No separated arcs are observed. The enhanced glow represents just slightly brighter patches with smooth edges. A close connection between the distribution and development of the intensity of 5577 Å and 6300 Å and the absorption images, presenting the electron flux distribution, is visible.
The course of the emissions intensity and the particles flux is the same. This is clearly seen especially in the disturbed period. The maximum glow and particle flux coincide with the maximal k p and A p indices.
Temporal development
To see better the changes with the time, the so called “keograms” are constructed. They present the data along a geomagnetic meridian in dependence of the time. ASI and IRIS keograms are constructed for one and the same geomagnetic meridian, passing through the center of the field of view of IRIS (1030.62°E). The magnetic field components course, measured in Andenes, is examined, too. The auroral particles power input in the Northern hemisphere, the ASI and IRIS keograms for the examined disturbed and quiet period are presented in Fig. 7. The times of the highest values of the power input are pointed out. The bulk of emission is not symmetric towards midnight in the disturbed period. Highly enhanced glow is observed from about 16 h till 3 h in the morning, but the most intensive part is up to midnight. During the quiet period, the glow intensity is more symmetric (20 h to 4 h), and again higher up to midnight. A good correlation between the auroral particles power input, the optical emissions, the precipitating electron fluxes and the terrestrial magnetic field during the examined periods is observed.
Conclusions
Close connection between the space and geomagnetic conditions and the auroral emissions activity is observed. Noticeable differences are registered during disturbed and quiet periods in the total value of the IMF, and in the auroral particles power input, as well. An enhancement of the sunspot number occurred 2 days before the disturbed period. An abrupt increase in the solar wind speed, the ion temperature and the power input, as well as a peak in the proton density are registered some 24 hours before the most disturbed period. The maximum glow and particles flux coincide with the maxima in the k p and A p indices course.
Fast glow intensity changes (with the time scale of seconds) are observed during the disturbed period. The observed in the disturbed period arcs usually have sharp edges, and in most cases their direction is almost E-W, sometimes turning into NE-SW or NW-SE. Considerable glow enhancement occurred several times and persevered for more than half an hour.
During the quiet period the glow is much weaker, the increase is slow and gradual. No separated arcs are observed.
A close connection between the distribution and development of the intensity of 5577 Å and 6300 Å and the absorption images, presenting the electron flux distribution, is seen. A good correlation between the optical emissions and the precipitating electron fluxes, and the terrestrial magnetic field during the examined periods is observed.
Acknowledgments: The work was supported by the European Union’s 6th Framework Program within the ALOMAR eARI (22_VeGi) Project. We are thankful for the data originated from (IRIS), operated by the Department of Communications Systems at Lancaster University (UK) in collaboration with the Sodankylä Geophysical Observatory, and funded by the Particle Physics and Astronomy Research Council (PPARC).
We are grateful to the Tromsø Geophysical Observatory, University of Tromsø, Norway, for providing the magnetometer data and the ionograms.
