Study on Overburden's Destructive Rules Based on Similar Material Simulation

Author: Ruyu Zheng, Kan Wu, Ru Li
Journal: International Journal of Modern Education and Computer Science (IJMECS) @ijmecs
Article in issue: 5 vol.3, 2011.
Free access
Analysis on the current research status, this article studies on the dynamic subsidence principles of overburden rock strata during coal mining based on similar material simulation test. Close ranged industrial photogram metric system was introduced to collect data. After coordinate transformation, matching and model amendment, dynamic subsidence curves which can be used to analyze the continuity characteristics of overburden subsidence, changes of boundary angle and displacement angle, volume transferring law from rock to surface, etc. were got. The result is useful in further study of the dynamic rule of overburden strata and enriches mining subsidence principles.
Similar material simulation, close ranged industrial photogram metric, subsidence curve, dynamic subsidence, the failure of overburden strata
Short address: https://sciup.org/15010265
IDR: 15010265
Text of the scientific article Study on Overburden's Destructive Rules Based on Similar Material Simulation
Published Online August 2011 in MECS
Similar material simulation based on the similar theory study the practical problem with the model combined with some physical parameters structured by certain similar material and practical similar material model. We can get usual laws and deformation mechanism with the theory and field parameters during the simulation test of study [1]. Because of the rock body quality of mine is a complicated composite medium, strata and ground movement caused by mining is also a complicated mechanical process. Different strata in different time may produce different deformation during the mining active process. This phenomenon is invisible, non-contact, cause great difficult to theoretical research and practical observation of overburden deformation and movement. Study deformation and movement of overburden in actual mining process, the workload is heavy, cost is expensive and need longer time. Sometimes the mining parameter, order and process are limited. Test measures and observation methods may be invalid. Consequently, in the laboratory through similar material simulation test simulated mining process is an important means to study
Sponsored by State Environmental Projection Fund for Non-profit Industry specific (Project number:200809128) and Qing Lan Project.
deformation and movement of overburden.
Similar material simulation test is proposed by Cuznetov in Soviet in the In the 1930s. It first adopted by BHNMN in 1937 to study deformation and movement of ground. After the World War Two this method is widely used and developed, become a key measurement to study deformation and movement of overburden indoor. Meanwhile this method is used in Poland, Czech, Germany and so on. In China, the institute of coal in TangShan first carried out this aspect research in 1958. Subsequently, some research institution such as Beijing Mining College establish laboratory to study strata movement. In recent years, many domestic research institution study overburden strata movement use this method, provided theoretical basis for design of mining. Because of its outstanding characteristics, similar material simulation adapts to some areas on the mining and slowly become the effective method on the laws of the mine pressure and rock. Similar material simulation becomes the qualitative research from quantitative research [2-4]. This paper studies the laws of the rock mass dynamic subsidence.
Researchers in abroad and domestic have made many studies on the mining subsidence steady prediction, and proposed many applicable theories and methods such as continuum theory, stochastic medium theory, probability integral method, curve prediction method and profile function prediction method. But in dynamic prediction there still no good theory. Professor Kan Wu and Yue Han Wang have applied mined rock mass dynamic mechanical model to study the space-time low of overburden deformation and movement accused by mining [5-6]. In addition they have studied the settlement regularity and strata movement both in overburden and ground during mining and subsidence dynamic prediction used time series analysis method [7-10]. Researcher Guang Ming Yu has made study on fractal increasing law of dynamic subsidence of ground point [11]. Researcher Jian Rong Tang proposed function relations between the maximum subsidence speed and mining area based on study of overburden movement and deformation used similar material simulation test [12].
-
II. The design and observation of the similar
MATERIAL MODEL
Common rock in China and its compressive strength are shown in table 1. This paper design the chart of the rock distribution according to the geological and mining conditions of the study areas and compressive strength, it is shown in fig1.
TABLE 1 Common Rock in China And it’s Compressive Strength
|
Rock type |
Uniaxial compressive strength(Rc/MPa) |
|
|
Sandstone |
fine sandstone |
103.9 ~ 143 |
|
medium sandstone |
85.7 ~ 133.3 |
|
|
gritstone |
56.8 ~ 123.5 |
|
|
siltstone |
36.3 ~ 54.9 |
|
|
Conglomerate |
glutenite |
6.9 ~ 121.5 |
|
conglomerate |
80.4 ~ 94 |
|
|
Shale |
sandy shale |
39.2 ~ 90.2 |
|
shale |
18.6 ~ 39.2 |
|
|
Limestone |
limestone |
52.9 ~ 157.8 |
|
Coal |
4.9 ~ 49 |
|
The distribution of rock above the coal is contained in table 2. For the rock below the coal reference to common distribution in China coal mining is show in figure 2.
TABLE 2 Prototype and Design of Similar Material Simulation Test
|
Actual wall rock of coal in research region |
Thickness (m) |
Wall rock in test |
Thickness (m) |
|
Topsoil |
115.1 |
Topsoil |
20 |
|
Argillaceous medium sandstone (weak) |
86.1 |
Sand - mudstone (weak) |
50 |
|
Fine sandstone interbedding (medium hard) |
13.56 |
Mudstone (weak) |
30 |
|
Argillaceous siltstone(weak) |
4.14 |
Sandy shale (medium hard) |
14 |
|
Fine sandstone interbedding (medium hard) |
21.89 |
Limestone (hard) |
4 |
|
Conglomerate(hard) |
9.85 |
Shale(weak) |
22 |
|
Siltstone (medium hard) |
11.54 |
Glutenite (medium hard) |
10 |
|
Fine sandstone interbedding (medium hard) |
14.09 |
Siltstone(medium hard) |
26 |
|
Coal(weak) |
5.78 |
Coal(weak) |
4 |
The distribution of rock above the coal is contained in table 2. For the rock below the coal reference to common distribution in China coal mining is show in figure 1.
TABLE 3 Similar Material Prescription of Level Seam Coal
|
Rock type |
Pressive strength |
Density (kg/m3) |
Table search: R(N/cm2) |
Material |
agglutinate |
|||||
|
Reality (Mpa) |
Model (N/cm2) |
Reality |
Model |
Sand |
Mica powder |
Agglutinate |
Plaster |
Calcium carbonate |
||
|
Mudstone |
12.7 |
3.74 |
2550 |
1500 |
3.67 |
80 |
17 |
3 |
3 |
7 |
|
Sand-mudstone |
27.7 |
7.71 |
2693 |
1500 |
7.41 |
80 |
17 |
3 |
7 |
3 |
|
Sandy shale |
37.2 |
10.61 |
2630 |
1500 |
10.12 |
71 |
23 |
6 |
3 |
7 |
|
Shale |
20 |
5.66 |
2650 |
1500 |
5.20 |
80 |
18 |
12 |
7 |
3 |
|
Limestone |
87.8 |
20.98 |
3139 |
1500 |
21.00 |
70 |
12 |
18 |
3 |
7 |
|
Glutenite |
54.7 |
15.84 |
2590 |
1500 |
15.53 |
71 |
23 |
6 |
5 |
5 |
|
Siltstone |
76.2 |
21.45 |
2664 |
1500 |
21.52 |
70 |
22 |
8 |
5 |
5 |
|
Gritstone |
91.2 |
26.82 |
2550 |
1500 |
26.06 |
74 |
16 |
10 |
5 |
5 |
|
Conglomerate |
90.8 |
23.89 |
2850 |
1500 |
21.73 |
71 |
23 |
6 |
7 |
3 |
The similarity coefficient is 1:200 between model and prototype. The length of the model support is 4m. The height and thickness of the model is 1.39m and 30cm. We can get the relationship between the time proportion and the model proportion according to the Newton laws and the similarity coefficientof the rock movement: α t = α l , the model proportion is 1:200, the time proportion is 1:14. Its mining progress is 20cm/d, the length of mining is 2m and coal thickness is 2cm according to the mining progress 2.8m/d. The prescription of similar material is defined according to the quality and compressive strength of the main rock. The prescription of similar material is shown in table 3.
This paper get the monitor data with 3D optical points measurement system called Digital close ranged industrial photogram metric, the composition is shown in Figure 3. The principle of close range industry photogram metric is use a high resolution digital camera take several photos for the workpiece, through survey software calculate 3-d coordinate of key points in on the workpiece. When be used to observe motional objects digital close range industry photogram metric is called video photogram metric, such as video photogram metric model deformation can survey dynamic movement, deformation and attitude. It includes single cameral and two cameral two forms; it has virtue of high precision, non-contact and portable. What’s more, it’s rapid, efficient and slow to interference of temperature change and shock.
The fourteenth surveying line(fault zone)
|
gj surface soil |
||||
|
sand-shale |
The fifth surveyin line(fault zone) |
gV |
The twelfth surveying line(fault zone) |
|
|
mudstone |
The seventh surveying |
|||
|
Oj sandy shale |
ne(cav ngzone) |
О |
||
|
shale /— shale |
The third surveying |
The fifth surveying |
5 |
|
|
sandy conglomerate |
line(caving zone) |
|||
|
siltstone i |
||||
|
—1 ' м |
||||
The first surveying line(caving zone)
The second surveying line(caving zone)
sandy conglomerate shale gritstone conglomerate limestone
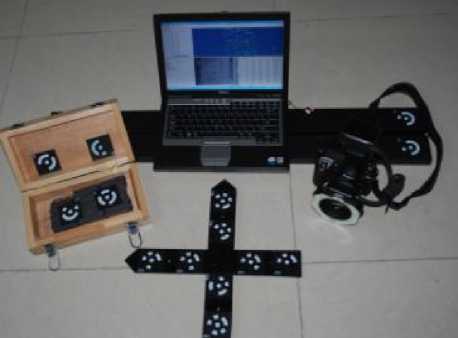
Fig.3 The composition of XJTUDP
-
III. The dynamic result of overlying strata
SUBSIDENCE
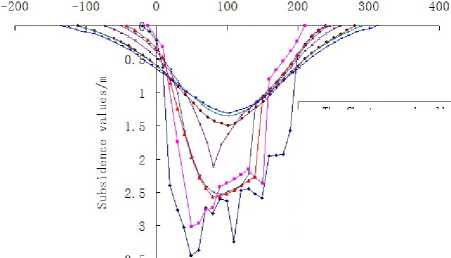
Draw the subsidence curve with observation result and plot the charts selecting 5 different mining progresses when mining progress are 72m, 140m, 206m, 272m and 374m from fig.1.
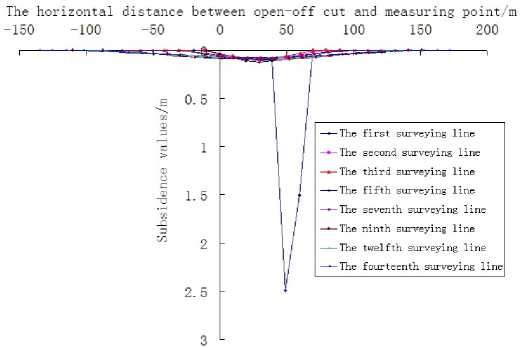
Fig.4 The subsidence curve of each surveying line when mining 72m
Fig.1 Similar material simulation experiment of horizontal coal seam
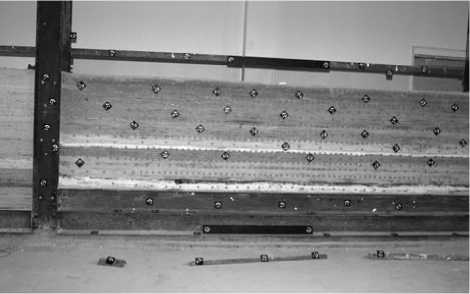
Fig.2 Surveying point distribution map on similar material simulation model
The horizontal distance between open-off cut and measuring poin
-200 -150 -100 -50 0 50 100 150 200 250 30
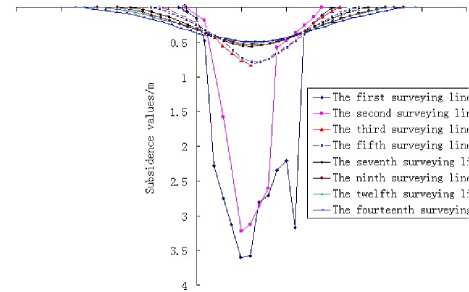
Fig.5 The subsidence curve of each surveying line when mining 140m
charts, we can get 8 different curve based on the different dynamic subsidence laws. Through the dynamic
The horizontal distance between open-off cut and measuring point/m subsidence curve, we can get the laws of the continuity, boundary angle, displacement angle change, and subsidence basin change laws.
—*— The first surveying line
—•—The second surveying line
—*— The third surveying line
—1—The fifth surveying line
— The seventh surveying line
—•—The ninth surveying line
— The twelfth surveying line
Fig.6 The subsidence curve of each surveying line when mining 206m
-
IV. The dynamic subsidence laws analysis of
THE INTERNAL OVERLYING STRATA
-
A. The subsidence continuity analysis
According to different subsidence curve of each
--The fourteenth surveying lineterrene, if the curve is smooth the subsidence is continuous; the rock of this part exist cross and fracture if the curve has mutation. Therefore, High degree of fault can be determined. For example, in the chart 4, when
mining progress is 72m, a small part points of the curve 1 appear great subsidence and this appearance show that falling fault zone arrive at this position; from the chart 5, when mining progress is 140m, the height of the crack arrive at the second observation line and the other curves
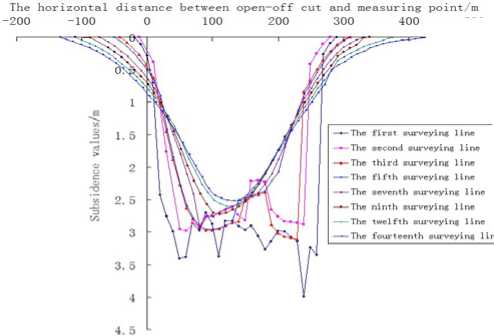
Fig.7 The subsidence curve of each surveying line when mining 272m
500 above the fourth curve is the typically symmetric subsidence curves; from the other charts, when mining progress is 206m, 272m, 374m, their subsidence value become bigger and bigger gradually, the subsidence of the observation line close to the mined areas is abnormal, and the subsidence value of the integral rock mass is abnormal and decreasing from bottom to top. The area close to the mined-out area appears greatly loose that the value of the subsidence is abnormal; the integral movement show well in the upper areas of the overlying strata. But the height of the crack is increasing along with the mining progress. For example, when mining progress is 206m, the height of the crack appear on the seven observation line; when mining progress is 272m and
374m, the height of the crack appear on the nine observation line. The table 4 show the different crack height at the different mining progresses (from the roof of coal seam).
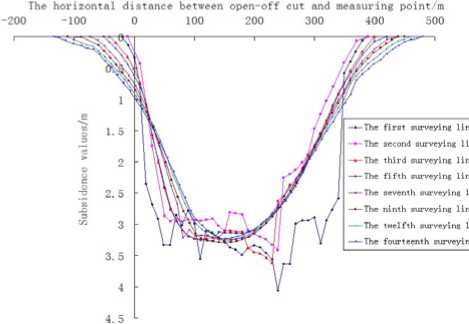
Fig.8 The subsidence curve of each surveying line when mining 374m
See fig 4-8. Chart 8 is the final subsidence curve and the other 4 charts express representative mining progress according to the rock destruction characteristics and adjacent observation periods when it is mining. From the
TABLE 4 The High of Caving Zone at Different Mining Length (From Coal Seam Roof)
|
Mining position |
The subsidence curve with abrupt change fast from coal seam roof |
The high of caving zone (from coal seam roof) |
|
72m |
The first surveying line |
14m |
|
140m |
The second surveying line |
26m |
|
206m |
The seventh surveying line |
76m |
|
272m |
The ninth surveying line |
106m |
|
374m |
The ninth surveying line |
106m |
-
B. The analysis of boundary angle and traveling angle
The factors influencing the boundary angle and traveling angle are many and complex when it is mining. The main factors are lithology, mining height, coal thickness, mined-out area, mining progress, coal inclination, mining methods, roof managerial approach and times of repeated mining. The study emphasis is laws of the mining length, boundary below angle and angle of critical deformation in this paper. The main factor about dynamic analysis is mining progress and the extent of the cover rock on different mining length show greatly different. The stability of the cover rock has time effect when coal is mined so the boundary angle, moving angle and the mining progress are coterminous.
The boundary angle( δ0 ): the included angle of the displacement angle, calculating three critical deformation value using the observation data of horizontal deformation, subsidence and distance between two point, we can determine the displacement angle and its value is show in table 6.
wired line about boundary point and mined-out area border and the level about virgin coal in the major crosssection of subsidence trough[1]. According to the dynamic subsidence curves, we can get boundary angle of different mining progress in different mining horizon. See table 5:
TABLE 5 Boundary Angle with Different Mining Length at Each Horizon
|
Mining length Surveying line |
72m |
140m |
206m |
272m |
374m |
|
The fourteenth surveying line |
69° |
56° |
54° |
53° |
53° |
|
The twelfth surveying line |
71° |
58° |
55° |
55° |
55° |
|
The ninth surveying line |
63° |
52° |
51° |
51° |
50° |
|
The seventh surveying line |
80° |
48° |
47° |
47° |
47° |
|
The fifth surveying line |
76° |
51° |
50° |
49° |
49° |
|
The third surveying line |
85° |
43° |
42° |
42° |
42° |
|
The second surveying line |
79° |
67° |
67° |
66° |
66° |
|
The first surveying line |
69° |
43° |
38° |
37° |
37° |
The fourteenth surveying line
The twd fib surveying line
The ninth surveying line
The seventh surveyingline
The fifth surveying line
The third surveying line
The second surveying line The first surveying line
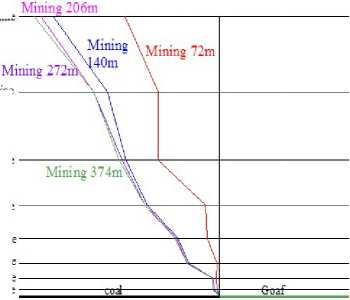
Fig.9 Curve line of boundary angle with different mining time at each horizon
TABLE 6 Displacement angle with different mining length AT EACH HORIZON
|
Mining length Surveying line |
72m |
140m |
206m |
272m |
374m |
|
The fourteenth surveying line |
— |
75° |
67° |
65° |
61° |
|
The twelfth surveying line |
— |
72° |
65° |
61° |
61° |
|
The ninth surveying line |
— |
76° |
63° |
58° |
58° |
|
The seventh surveying line |
— |
68° |
59° |
56° |
56° |
|
The fifth surveying line |
— |
73° |
62° |
56° |
56° |
|
The third surveying line |
— |
69° |
58° |
54° |
53° |
|
The second surveying line |
— |
79° |
72° |
72° |
71° |
|
The first surveying line |
74° |
66° |
58° |
52° |
52° |
The boundary angle on the different observation lines go smaller with the mining progress and the value of the boundary angle go steady when the surface go full subsidence which is in accordance with the formerly experience. The connected curve by subsidence boundary points in the different horizon and same moment is not straight related to the rock lithology and rock thickness. The hard parts of rock mass are aleurolite, glutenite, arenaceous shale, and tithonian. The soft parts of the rock mass are mudstone, sand shale, arenaceous shale and shale. The Specific interpretation is chart 1. From bottom to the top the rock mass go harder and the horizon boundary angle goes bigger. The above conclusions show that the softer boundary angle has smaller boundary angle. The boundary angles of the second observation line closed to the mined-out area appear mutation because of the Layer thickness ratio of the adjacent horizon. Rock mass nearer to the mined-out areas appear greatly destruction. The location on the fifth and twelfth
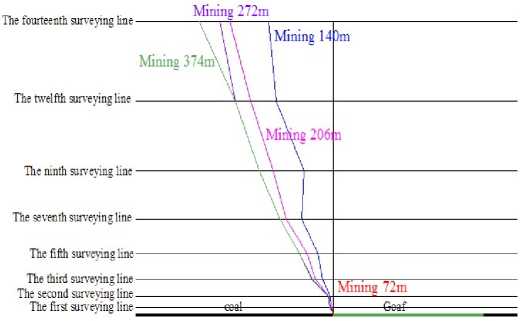
Fig.10 Curve line of displacement angle with different mining time at each horizon
observation line has small boundary angle and smaller destruction because they approach to the mined-out areas. The boundary angles of the different horizon and different moment show on fig.9.
Displacement angle ( δ ): find three points i= 3mm/m, K =0.2 ×10- 3 /m , ε = 2mm /m , at inclined, curvature, horizontal deformation curve on main section, the angle between line connection the outside point with the goaf and the horizontal line is displacement angle[1].according to calculate methods of three deformation and definition of
From the table 6, the moving angles of the different horizon go smaller with the mining progress. The moving angle of different horizon has some changes at the same moment but the integral trend is very close. See the visual fig.10. The rock moving angles are got by the all observation lines so the destroyed extent of the rock mass is little and the moving angle of the first observation is 74°when mining progress is 72m and the angle of the other horizon can not be got. With the greater extent of the rock mass the moving angle go smaller but the laws of the moving angle is in accordance with the boundary angle above this subsection.
-
C. Volume of subsidence basin analysis
The subsidence basin’s formatting is a dynamic process, during the underground mining the subsidence basin is constantly expanding. As to the end of mining, the surface is still sinking, after a time the subsidence is formed. For the bedded ore-body, It’s goaf roughly like a regular rectangle, when full mining the subsidence basin is locate on the goaf, and it’s range much large than goaf; the ground movement and deformation on main section is biggest; in horizontal core seam mining the contour of surface subsidence is to goaf symmetry center ellipse[1]; in this paper the similar material model is plane, the length of model is 4 m, the height if mode is 1.39m,the width of model is 0.3 m, and we select the main section to do our research. According to subsidence curves, drawing with AutoCAD, we can get the volume of rock in different surveying line. The result of compare it with corresponding goaf volume is follow as Table 7.
TABLE 7 The CompArison Table of The Volume of Subsidence Basin and Goaf at Different Position
|
Mining length |
72m |
140m |
206m |
272m |
374m |
|
|
The volume of goaf/m3 |
17280 |
33600 |
49440 |
65280 |
89760 |
|
|
The volume of strata subsidence on surveying line |
14th line/m3 |
664 |
5508 |
16111 |
33315 |
55451 |
|
12th line /m3 |
596 |
4840 |
15415 |
32399 |
54481 |
|
|
9th line /m3 |
715 |
4921 |
16186 |
32059 |
54267 |
|
|
7th line /m3 |
349 |
4521 |
15367 |
32235 |
53635 |
|
|
5th line/m3 |
393 |
4995 |
19361 |
33071 |
52888 |
|
|
3th line/m3 |
249 |
4796 |
20246 |
37120 |
53698 |
|
|
2th line/m3 |
334 |
11264 |
21403 |
36530 |
49539 |
|
|
1th line/m3 |
2718 |
17949 |
28905 |
46867 |
64320 |
|
TABLE 8 Rations of The Volume of Strata Subsidence and Goaf of Each Surveying Line at Different Time (%)
|
Mining length |
72m |
140m |
206m |
272m |
374m |
|
|
The volume of goaf/m3 |
17280 |
33600 |
49440 |
65280 |
89760 |
|
|
Rations of the volume of strata subsidence and goaf on surveying line |
14th line |
3.8% |
16.4% |
32.6% |
51.0% |
61.8% |
|
12th line |
3.5% |
14.4% |
31.2% |
49.6% |
60.7% |
|
|
9th line |
4.1% |
14.7% |
32.7% |
49.1% |
60.5% |
|
|
7th line |
2.0% |
13.5% |
31.1% |
49.4% |
59.8% |
|
|
5th line |
2.3% |
14.9% |
39.2% |
50.7% |
58.9% |
|
|
3th line |
1.4% |
14.3% |
41.0% |
56.9% |
59.8% |
|
|
2th line |
1.9% |
33.5% |
43.3% |
56.0% |
55.2% |
|
|
1th line |
15.7% |
53.4% |
58.5% |
71.8% |
71.7% |
|
From table 7 we can get that the volume of goaf, the failure of overburden strata is increased with the mining, and gradually transmission to ground, as the result the volume of rock subsidence is increased in order. Affected by the large range of subsidence basin, at the same surveying time on the first observation line the subsidence volume is largest, on different line the subsidence volume is different and especially on the 14th surveying line the ground sink volume is largest. The Rations of the volume of strata subsidence and goaf of each surveying line at different moments (%) is following in Table 8.
From table 8, the rations of the volume of subsidence basin and goaf of surface are from 3.84% to 61.78%. The rations acceleration was from slow increase in prophase to active subsidence stage in middle, and tends to become smaller then close to stable at the end. The other change law of the volume of different strata subsidence at different time is the same with it. When mining 374m, the rations of the volume of strata subsidence and goaf of 1 and 2 surveying line was less than it when mining 272m, it show that caving zone appeared gap and compacted later. All of these show that the degree of overburden strata failure and broken expand compaction of strata in the process of coal mining.
According to the subsidence curve distribution of each surveying at different time, selected rations of the volume of strata subsidence and goaf of each surveying line when mining 206m to analyze. The ration was from 58.47% at the most deep horizon to about 32% at bend zone horizon. All the volume of strata subsidence which close to the surface have not difference, because the strata movement was tend to integrity, each of maximum subsidence and the range of subsidence boundary are all minimal difference, so this part of rations are all minimal difference. And the rations of the volume of strata subsidence and goaf of some surveying line which close to the goaf are change greatly, it show that overburden strata which the closer to the goaf the destructiveness more violent, and broken expand compaction of strata is more stronger. The other change law at different time is the same with it.
-
V. Conclusions
According to the study area of the similar material simulation, analysis on the subsidence curve of overburden strata, as the conclusions follow:
-
(1) With coal seam mining, overburden destruction belt progressive development upward. Finally, the height of fracture development is 108m.
-
(2) Under the influence of the speed of the coal mining, the boundary angle and displacement angle with different mining length at each horizon have wave properties, but maintain the overall trend: boundary angle was from 70° to 55°, displacement angle was from nothing to the end of 63°.
-
(3) The rations of the volume of subsidence basin and goaf of surface are from 3.84% to 61.78%. Because the influence of the speed of the coal mining, the volume of strata subsidence each surveying line in turn larger.
-
(4) The rations of the volume of strata subsidence and goaf of each surveying line was from 58.47% at the most deep horizon to about 32% at bend zone horizon when mining 206m, and tended to be stable. The other change law of the volume of different strata subsidence at different time is the same with it.

Ruyu Zheng, was born in YunXiao county in China’s province FuJian in 1986 April 28th. From September 2005 to September 2009 he was studied in School of Environmental Science and spatial Informatics of China University of Mining and Technology and got the
bachelor’s degree of Surveying and Mapping. He Pursuing the Master degree of Geodesy and Survey in the same University begin from September 2009.
References Study on Overburden's Destructive Rules Based on Similar Material Simulation
- HE Guo-qing,YANG Lun and LING Geng-di,etc, Mining Subsidence Study,China University of Mining and Technology Press.1991,4.
- CHAI Jing, DUAN Shu-wu,“Study on internal displacement testing of simulation model,” Ground Pressure and Strata Control, 2003,3, pp.93-94.
- WANG Su-hua,GAO Yan-fa, LIAO Jun-zhan, “The theory of error offset in the course of equivalent materuls simulation experiment, ” Journal of Shandong Agricultural University,2005,36(3), pp.411-414. FU Zhi-liang, NIU Xue-liang, WANG Su-hua and GAO Yan-fa,etc, “Quantitative study on equivalent materials testing, ” Acta Mechanica Solida Sinica,2006,12, pp.169-172.
- WU Kan, WANG Yue-han, DENG Ka-zhong. Application of Dynamic Mechanics Model of Overlying Strata Movement and Damage Above Goaf [J].Journal of China University of Mining & Technolgy,2000,29(1), pp.34-36.
- WU Kan, WANG Yue-han, DENG Ka-zhong. Application of Dynamic Mechanics Model of Overlying Strata Movement and Damage Above Goaf [J].Journal of China University of Mining & Technolgy,2000,29(1):34-36.
- Wang Yue-han, Deng Ka-zhong, Wu Kan. On The Dynamic Mechanics Model of Mining Subsidence [J]Chinese Journal of Rock Mechanics and Engineering,2003,22(3),pp.352-357.
- WU Kan, JIN Jian-ming, WANG Juan-le. The Technique of Time Series Prediction on Mining Subsidence [J]. Engineering of Surveying and Mapping,2001,10(4),pp.20-23.
- Jin Jian-ming, Wu Kan. The Real time Prediction System of the Subsidence [J]. Surveying and Mapping of Geology and Mineral Resources, 2001, 10(14), pp.3-5.
- WU Kan; JIN Jian-ming. Prediction of Dynamic Mining Subsidence Parameters by Time Series Analysis Method [J]. Journal of China University of Mining & Technology, 2000, 29(4), pp.413-415.
- Chen Ting-wu, Hou Qing-ming, Chen Zhuo.Application of Time Series Analysis and Nonlinear Regression in Settlement Modeling and Prediction [J]. Geotechnical Investigation & Surveying, 2008, (10), pp.63-67.
- Yu Guang-ming, Sun Hong-quan,Zhao Jian-feng. The Farctal Increment of Dynamic Subsidence of The Ground Surface Point Induced by Mining [J].Chinese Journal of Rock Mechanics and Engineering, 2001, 20(1), pp.34-37.
- Kang Jianrong Wang Jinzhuang. Analysis of Dynamic Subsidence of Mining Overburden Strata [J].Journal of Taiyuan University of Technology, 2000, 31(4), pp.364-366.
