Studying dynamics and classification of attacks to corporate network web services

Author: Isaev S.V., Kononov D.D.
Journal: Siberian Aerospace Journal @vestnik-sibsau-en
Section: Informatics, computer technology and management
Article in issue: 4 vol.23, 2022.
Free access
The article presents a study of the dynamics of attacks onto the web services using the classification of cyber threats by types due to the example of the corporate network of the Krasnoyarsk Scientific Center of the Siberian Branch of the Russian Academy of Sciences. The analysis is carried out on the basis of web services logs and it allows to solve urgent problems of ensuring the integrated security of web services, including identifying both existing and potential cybersecurity threats. The article demonstrates a review of the main approaches to the processing and analyzing logs. The authors describe the type and composition of data sources and provide a list of the software used. A feature of the study is a long observation period. The structure of the processing system is proposed and software tools for attack analysis and classification are implemented. The research shows that the use of classified samples allows to detect periodicity and reveal trends of certain types of attacks. Unclassified attacks have similar distribution parameters for different years, while in the case of classification, the distribution parameters have changed significantly, which makes it possible to track risks in automated intrusion prevention systems. A correlation matrix by type of attack is constructed. The analysis shows that most attack types have weak correlation, with the exception of the attacks “command injection”, “directory browsing”, “Java code injection”, which can be aggregated. The authors propose a heuristic method of risk comparison based on cyber threat classification. The method uses statistical parameters of sample distributions and permits to deal with different time intervals. The paper georeferences the IP addresses from which the attacks are carried out, builds attack profiles for different countries, and provides a list of countries with a stable attack profile. The conclusion indicates the features of the proposed method and outlines the prospects for its use in other areas.
Analysis, security, web, internet, attack, corporate network
Short address: https://sciup.org/148329654
IDR: 148329654 | UDC: 004.056 | DOI: 10.31772/2712-8970-2022-23-4-593-601
Text of the scientific article Studying dynamics and classification of attacks to corporate network web services
Currently, many companies use web technology to organize corporate services of various levels (mail, cloud technology, hosting, video conferences). It should be highlighted that web services are subject to information security risks, since they operate on the open Internet. A significant feature of functioning modern information systems presents the task to ensure information security, that is complex and includes a set of measures at various levels, the implementation of which can reduce the risks of cyber threats. One of the important security components is to analyse various activity logs generated by the system [1]. In particular, the logs of the nginx and apache web servers present interest, their analysis makes it possible to identify cyber attacks onto the system. In web systems, the log volumes can be significant, which makes it difficult to analyze them manually; in this case, automated tools for data processing and analyzing are necessary [2]. As a rule, data analysis involves processing by various software tools and it is a multistage process [3; 4]. The data obtained during the analysis can shape the information security system [5] or compare behavioral patterns of equipment to real cyber attacks [6].
Adjoining activities
Different approaches are required to analyse logs. One of the most popular methods is signature analysis. Log handlers use predefined signatures to identify malicious events and classify them [7; 8]. At the same time, additional parameters and characteristics can be extracted from the log elements, which can be used for subsequent analysis, for example, clustering and anomaly detection [9]. Typically, failures during cyber attacks generate log entries that are different from the entries representing normal system behavior. Therefore, it is advisable to pay attention to individual journal entries that do not fit into the overall picture. During clustering, such entries are identified by a high degree of dissimilarity with all existing clusters or do not correspond to any signatures [10; 11]. However, not all adverse system events appear as single anomalous log entries, but rather as dynamic or sequential anomalies. Therefore, approaches are needed to group sequences of records or identify temporal patterns and correlations. Dynamic clustering allows to identify events having several log entries that are heterogeneous and scattered in time [12; 13], which makes it possible to detect implicit abnormal behavior.
Existing operations use various methods to analyze service logs. Authors often describe the analysis methodology and use test data as an example, which does not permit to evaluate the performance of the non-real data approach, or real data are used with short time intervals, which makes it difficult to analyze the dynamics of ongoing processes for different periods.
The research considers the security of the corporate network of the Krasnoyarsk Scientific Center (FRC KSC SB RAS) based on the analysis of web service logs. Its purpose is to analyze the security of web services over the past 2 years, classify cyber attacks by type, and identify dependencies among various attack parameters. In contrast to the existing research, the analysis is performed over long time intervals, that allows to identify the dynamics of the behavior of web services per hours, days, months and years. The research is a continuation of the security study of corporate network web services [14], in comparison with the previous research, a classification of cyber threats by types is performed, and a risk assessment method is proposed.
Data source and processing methodology
The data sources for the research analysis are web services data for 2020–2021 and incomplete 2022 (45 GB, 176 million elements). The analysis is performed using the following software tools: UNIX tools, GAccess, libmaxmind, JSON tools, Python, Microsoft Excel. Fig.1 presents stages of data processing. Front-end processing includes aggregation of logs from all web services and unification of the format for further processing. For all data, the source is georeferenced - the country is determined by IP address (GeoIP). Then failure handling is performed (both client and server) with aggregation for different time ranges (year, month, day, hour). Attacks are also processed, which includes classification by type followed by aggregation due to geodata. Classification of attacks by type is carried out according to OWASP [15] using the ModSecurity Core Rule Set [16] designated to identify cyber threats to web applications. To process the attacks, a set of GSec programs is developed in the Go and C languages, that performs an automated classification of attacks by type and aggregation of data per different time intervals.
Перевод подписей рисунка 1: первичная обработка - front-end processing; геопривязка данных - georeferencing; обработка ошибок - failure processing; обработка атак - attack processing; разделение по типам - separating by types; фильтрация исключений - exception filtering; извлечение меток - label extracting; классификация по типам - type classifying; аггрегация по интервалам времени - aggregating per time interval; аггрегация по геоданным - aggregating due to geodata.
Первичная обработка
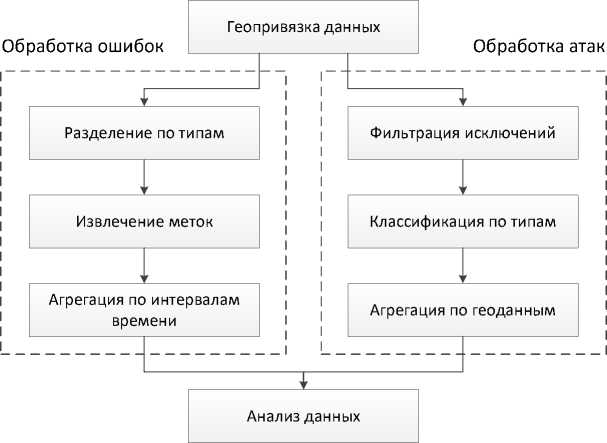
Рис. 1. Стадии обработки данных
WWW data analysis
Fig. 1. Stages of data processing
Analysis of the total number of attacks for 2020–2022 shows that, on average, their daily number varies within a small range: 3664 in 2020, 3481 in 2021 and 3698 in 2022 (3% deviation from the average for the year). At the same time, the maximum number of attacks varies widely from 8,500 to 21,000 per day, which indicates the simultaneous operation of several uncoordinated sources. Fig. 2 shows the general dynamics of detected attacks per months for 2020–2022. We outline the absence of a pronounced periodicity both for daily and monthly summation.
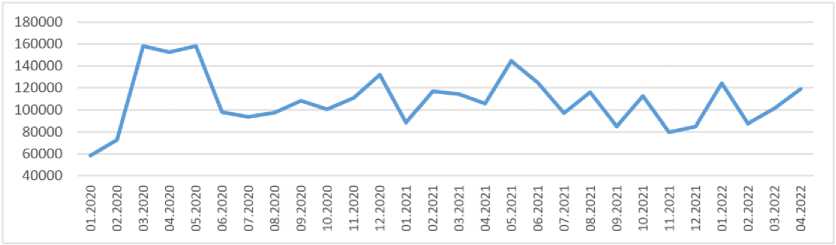
Рис. 2. Общая динамика атак по месяцам
Fig. 2. General dynamics of attacks per month
Further analyzing attacks by types, clear trends can be identified for an increase in the number of attacks of certain types. Fig. 3 shows the monthly number of attacks of POLICY/EXT_RESTR (forbidden extension) and WEB/FILE_INJ (file injection) types, it clearly demonstrates an increase in intensity by 2 or more times, which is imperceptible in Fig. 2.
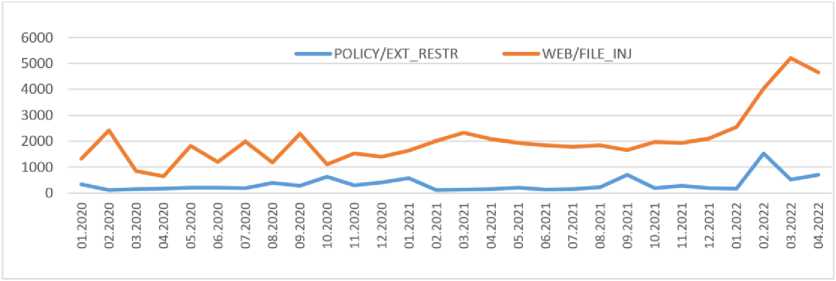
Рис. 3. Динамика классифицированных атак по месяцам
Fig. 3. Dynamics of classified attacks per month
The aggregation chart by days for 2022 (Fig. 4) does not reveal the uptrend, found in Fig. 3. A separate peak is visible around February 26, 2022, which can be associated with massive cyber attacks on Russian Internet resources. Therefore, the most effective way to detect an increase in the risk of cyber threats is to analyze classified threats with aggregation per month.
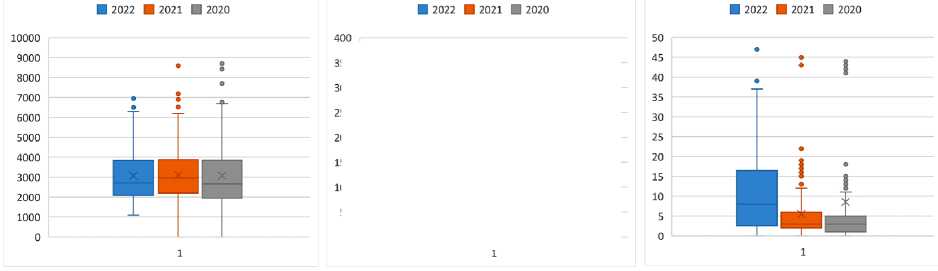
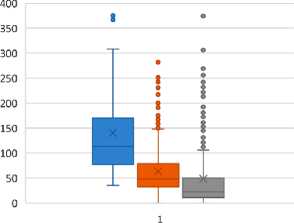
Fig. 5 shows the range diagrams for the distributions for 2022, 2021, and 2020: unclassified attacks ( a ), WEB/CMD_INJ attacks (command injection) ( b ), and WEB/FILE_INJ attacks (file injection) ( c ).
If the unclassified distribution of attacks has got similar parameters for different years, then if classification is applied, the distribution parameters change quite significantly, especially for 2022, which is characterized by an increase in the risk of cyber threats. To select a set of indicators, a correlation matrix of their daily distributions is constructed for the entire observed period of 2020–2022. (Fig. 6). Most of the metrics are weakly correlated, with the exception of WEB/CMD_INJ (command injection), WEB/DIR_TRAVERSAL (directory browsing), and WEB/JAVA_INJ (Java code injection), which can be aggregated.
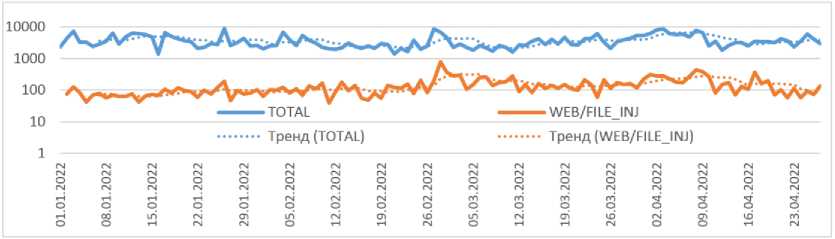
Рис. 4. Динамика неклассифицированных атак и атак типа «инъекция файлов»
-
Fig. 4. Dynamics of unclassified attacks and file injection attacks
а
б
в
Рис. 5. Диаграммы размаха атак по годам:
а – неклассифицированные; б – WEB/CMD_INJ; в – WEB/FILE_INJ
-
Fig. 5. Range diagrams of attacks by year: а – unclassified; b – WEB/CMD_INJ; с – WEB/FILE_INJ
1
2
3
4
5
6
7
8
9
10
11
12
13
14
15
1. AUTO/CRAWLER
0,21
0,44
0,38
-0,34
0,10
-0,09
-0,10
-0,14
0,24
0,00
0,20
0,25
0,31
-0,20
2. AUTO/SCRIPT
0,21
0,10
-0,02
-0,06
-0,01
-0,15
-0,18
-0,34
0,13
-0,05
0,66
-0,34
0,28
-0,11
3. AUTO/SEC_SCAN
0,44
0,10
0,04
-0,24
-0,06
-0,30
-0,25
-0,29
-0,04
-0,22
0,09
0,17
0,29
-0,19
4. OTHERS
0,38
-0,02
0,04
-0,18
0,63
-0,08
-0,06
-0,09
0,23
-0,01
0,09
0,06
0,52
0,01
5. POLICY/EXT_RESTR
-0,34
-0,06
-0,24
-0,18
-0,09
0,55
0,60
0,46
0,12
0,50
-0,16
-0,09
-0,17
0,82
6. PROTOCOL
0,10
-0,01
-0,06
0,63
-0,09
0,20
0,18
0,06
0,09
0,28
0,41
-0,26
0,64
0,01
7. WEB/CMD_INJ
-0,09
-0,15
-0,30
-0,08
0,55
0,20
0,99
0,73
0,04
0,97
0,11
-0,11
-0,10
0,47
8. WEB/DIR_TRAVERSA
-0,10
-0,18
-0,25
-0,06
0,60
0,18
0,99
0,75
0,07
0,96
0,05
-0,06
-0,15
0,52
9. WEB/FILE_INJ
-0,14
-0,34
-0,29
-0,09
0,46
0,06
0,73
0,75
0,31
0,62
-0,11
0,07
-0,40
0,59
10. WEB/HEADER_INJ
0,24
0,13
-0,04
0,23
0,12
0,09
0,04
0,07
0,31
-0,01
-0,02
0,28
0,08
0,15
11. WEB/JAVA_INJ
0,00
-0,05
-0,22
-0,01
0,50
0,28
0,97
0,96
0,62
-0,01
0,22
-0,13
0,00
0,42
12. WEB/PHP_INJ
0,20
0,66
0,09
0,09
-0,16
0,41
0,11
0,05
-0,11
-0,02
0,22
-0,27
0,41
-0,13
13. WEB/RFI
0,25
-0,34
0,17
0,06
-0,09
-0,26
-0,11
-0,06
0,07
0,28
-0,13
-0,27
-0,26
-0,11
14. WEB/SQL_INJ
0,31
0,28
0,29
0,52
-0,17
0,64
-0,10
-0,15
-0,40
0,08
0,00
0,41
-0,26
-0,11
15. WEB/XSS
-0,20
-0,11
-0,19
0,01
0,82
0,01
0,47
0,52
0,59
0,15
0,42
-0,13
-0,11
-0,11
Рис. 6. Матрица корреляций распределений классифицированных атак
-
Fig. 6. Distributions correlations matrix of classified attacks
Method to assess changes in the risks of cyber threats
Due to the analysis, certain classified types of attacks contain more information on the dynamics of risks than unclassified ones. While choosing independent classified types of attacks and calculating their statistical indicators for time samples, we can propose the following heuristic method for assessing changes in the risks of cyber threats, based on comparing the parameters of sample distributions. For samples V1 and V2 containing N independent indicators, we introduce the following function R for evaluating risk changes:
N
R(VV) = - E K i ,
N i = 1
1, если цi > 0,6745 - оi, where K = < 0, если - 0,6745 - ог < ц < 0,6745 - ог■ , цi - mean value of the i-th feature sample
- 1, если ц i < - 0,6745 - о i ;
for sample V 2 ; о i - standard deviation of the sample of the i-th feature of the sample V i . (не получилось изменить слово «если =if» в формуле)
According to the proposed method, if the average value of all N features of the V2 sample is greater than the third quartile of the V1 sample, then the risk change value is 1, which can be interpreted as a significant increase in risk for all indicators. If the mean value of all N features of sample V2 is less than the first quartile of sample V1 , then the risk change value equals -1 (risk reduction for all indicators). Value is R ( V 1 , V 2 ) е [—1,1], it allows to use this indicator for the analysis using artificial intelligence methods, in particular, the Shortliffe method.
Evaluation of attack profiles
Information about the geolocation of IP addresses was extracted from the logs and an analysis of attack sources by type was carried out. The correlations of the 2020 and 2021 samples were calculated. by types of attacks for countries from the top 15 due to attack intensity. In case we assume that the attack-indicators ratio of different types (attack profile) is determined by the set of software used to carry out the attack, then the high correlation of such samples for a country in different periods of time can be interpreted as a fixed set of software used for attacks (vulnerabilities under attack). The resulting diagram in Fig. shows that the countries with the most stable attack patterns are China, Russia, Germany, the UK, the US, and Poland.
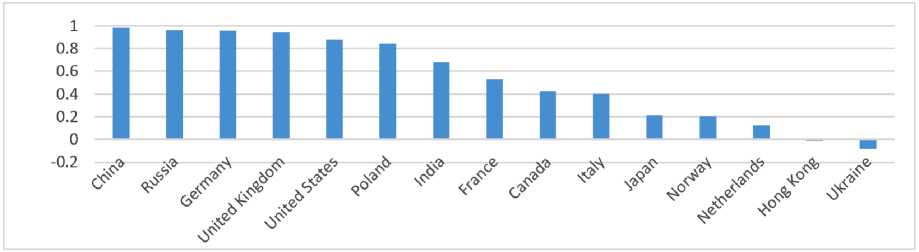
Рис. 7. Корреляция структуры атак 2020 и 2021 гг. по странам
Fig. 7. Correlation of attack patterns in 2020 and 2021 per country
Countries with low correlation (Holland, Hong Kong, Ukraine) have an inconsistent set of attack software and are likely to be used by different attacking groups controlling botnets.
Conclusion
The research considers the dynamics of attacks on web services per country, identifies the main country groups with a constant profile of attacks and their high intensity. A comparison of pairwise correlations of different attack types was made, attacks with a high correlation were identified, which could be aggregated when assessing risks. A method is proposed to compare cybersecurity risks for different periods, using a classification by attack types. The method does not depend on the compared time intervals and sample size, as it is based on statistical indicators. The cybersecurity risk evaluation method can be used in other areas where there is a classification of indicators.
References Studying dynamics and classification of attacks to corporate network web services
- Landauer M., Skopik F., Wurzenberger M., Rauber A. System log clustering approaches for cyber security applications: A survey. Computers & Security. 2020, Vol. 92, P. 101739.
- He P., Zhu J., He S., Li J. et al. Towards Automated Log Parsing for Large-Scale Log Data Analysis. IEEE Transactions on Dependable and Secure Computing. 2017, Vol. 15, No. 6, P. 931–944.
- Moh M., Pininti S., Doddapaneni S., Moh T. Detecting Web Attacks Using Multi-stage Log Analysis. IEEE 6th International Conference on Advanced Computing (IACC). 2016, P. 733–738.
- Zhu J. et al. Tools and Benchmarks for Automated Log Parsing. IEEE/ACM 41st International Conference on Software Engineering: Software Engineering in Practice (ICSE-SEIP). 2019, P. 121–130.
- Efimova Yu. V., Gavrilov A. G. [Modeling an information security system based on the analysis of system logs]. Inzhenernyi vestnik Dona. 2019, No. 6 (57), P. 40 (In Russ.).
- Bolodurina I. P., Parfenov D. I., Zabrodina L. S. et al. [Modeling the identification of a cyber attack profile based on the analysis of the behavior of devices in the network of a telecommunications service provider]. Vestnik Yuzhno-Ural'skogo gosudarstvennogo universiteta. 2019, No. 4, P. 48–59 (In Russ.).
- He P., Zhu J., Zheng Z., Lyu M. R. Drain: an online log parsing approach with fixed depth tree. Proc. of the International Conference on Web Services (ICWS). IEEE, 2017, P. 33-40.
- Reidemeister T., Jiang M., Ward P. A. Mining unstructured log files for recurrent fault diagnosis. Proc. of the Int. Symp. on Integrated Netw. Mgmt. IEEE, 2011, P. 377–384.
- Sidorova D. N., Pivkin E. N. [Algorithms and methods of data clustering in the analysis of information security event logs]. Bezopasnost' tsifrovykh tekhnologii. 2022, No. 1 (104), P. 41–60 (In Russ.).
- Juvonen A., Sipola T., Hamalainen T. Online anomaly detection using dimensionality reduction techniques for http log analysis. Computer Networks. 2015, No. 91, P. 46–56.
- Wurzenberger M., Skopik F., Landauer M., Greitbauer P., Fiedler R., Kastner W. Incremental clustering for semi-supervised anomaly detection applied on log data. Proc. of the 12th International Conference on Availability, Reliability and Security, ACM (2017), P. 31:1–31:6.
- Aharon M., Barash G., Cohen I., Mordechai E. One graph is worth a thousand logs: uncovering hidden structures in massive system event logs. Proc. of the Joint Eur. Conf. on Machine Learning and Knowledge Discovery in Databases. Springer, 2009, P. 227–243.
- Jia T., Yang L., Chen P., Li Y., Meng F., Xu J. Logsed: anomaly diagnosis through mining time-weighted control flow graph in logs. Proc. of the 10th Int. Conf. on Cloud Comp. (CLOUD). IEEE, 2017, P. 447–455.
- Kononov D., Isaev S. Analysis of the dynamics of Internet threats for corporate network web services. CEUR Workshop Proceedings. The 2nd Siberian Scientific Workshop on Data Analysis Technologies with Applications 2021. 2021, Vol. 3047, P. 71–78.
- Helmiawan M. A., Firmansyah E., Fadil I., Sofivan Y., Mahardika F. and Guntara A. Analysis of Web Security Using Open Web Application Security Project 10. 8th International Conference on Cyber and IT Service Management (CITSM). 2020, P. 1–5.
- OWASP ModSecurity Core Rule Set. Available at: https://owasp.org/www-project-modsecurity-core-rule-set/ (accessed: 13.05.2022).
