Studying the stock market of Ukraine with the use of the event analysis

Author: Malyshenko Konstantin Anatolevich
Journal: Economic and Social Changes: Facts, Trends, Forecast @volnc-esc-en
Section: Public finance
Article in issue: 1 (49) т.10, 2017.
Free access
The study presents basic principles of the event analysis developed for the purpose of improving the forecasting of market conditions. The aim of the study is to create the theoretical foundations of the event analysis of the stock market and their empirical substantiation. This type of analysis will make it possible to take into consideration the general trends in the stock market more comprehensively. For this purpose, the authors present the mathematical tools of the study, disclose the theoretical basis and genesis of the method proposed. In addition, the article contains the statistical analysis of the stock market performed with the use of traditional statistical methods and with the tools of the event analysis, first of all, the information elasticity. Empirical testing on the data on exchange rates and PFTS and the Ukraine Stock Exchange indices allowed the authors to establish the connection between events and changes in the indices, to identify several cases of excessive response that may be indicative of insider influence...
Efficient market hypothesis (emh), elasticity, stock market, efficient market, information efficiency
Short address: https://sciup.org/147223908
IDR: 147223908 | UDC: 336.764/.768 | DOI: 10.15838/esc.2017.1.49.13
Text of the scientific article Studying the stock market of Ukraine with the use of the event analysis
The reaction of the market to various economic events is to a great extent linked to the country’s historically established type of market efficiency. The stock market in post-Soviet countries is only being formed and, accordingly, has weak informational efficiency, which is typical for the achieved level of economic development. Event analysis is based on the study of the reaction of the market to significant events. The longer the response time and the less its uniqueness, the weaker market efficiency. Thus, the relevance of event analysis is in its strong indicative function. This type of analysis is a method which will help forecast the domestic stock market and evaluate the effectiveness of state authorities regulating its activities. Stock market event analysis is a type of economic express-analysis used to determine the impact of events on changes in stock market quotations. Its development is primarily linked to the increasing influence of the stock market on the country’s economy, the declining confidence in traditional sources of information and the advanced use of computer technologies for analyzing large amounts of information on events of in the economic and political sphere. In addition, it is deprived of shortcomings of fundamental analysis such as expert subjectivity, complexity, high costs and long process duration. Technical analysis, though simple, remains quite subjective; therefore it does not help see the real reason for change in quotations and does not always give unambiguous answers.
Thus, the research focus is to provide an objective evaluation of competitive freedom to handle stock market transactions through the use of event analysis. The need for stock market event analysis lies in the fact that this type of analysis is the most effective procedure for obtaining relevant data amid imperfect information disclosure system. This problem arises due to information asymmetry – a situation where one of the counterparties to the deals is more informed about the object to be sold or purchased. It should be noted that information asymmetry arises as a result of actions of the interested parties such as insiders, and is observed in any market. As a result, confidence in information sources declines reducing the level of activity and liquidity in the stock market as a whole. The relevance of the present research is in the need to ensure market transparency, fair terms of transactions, elimination of external impacts in the stock market without which it will not be attractive to investors and market efficiency is the indicator which shows the degree of its development. For addressing the issues of information support of stock market the authors developed tools for verifying information efficiency within the boundaries of the proposed event analysis, which will provide objective evaluation of competitive freedom of transactions, since it is based on initial data about events and quotations.
The theory of event analysis is reviewed in many studies, although it is a relatively new phenomenon in the practice of stock market analysis. In this regard, it is worth mentioning works of foreign scientists such as N. Tuma and M. Hannan1 (1970), Owen Humpage2 (1984), Dominguez and Frankel 3 (1993), Ben
Warwick4 (1996). Among Ukrainian authors the work by A.V. Zinenko5 should be noted, which considers the event indicator. Russian scientists N. Klimarev and S. Studnikov6 offer a universal classification of events considered in financial research. However, it is necessary to reveal the correlation between an event and changes in exchange rates in order to understand the possible market reaction to different types of events, and, above all, to define concepts such as “event”, “event profile” and “event analysis”.
“An event” is referred to as a change in the status measured in discrete variable which takes a countable number of mutually exclusive values. The units of analysis are individuals, groups and organizations, countries, political organizations, cultural processes. To predict the time of the event, a model similar to a regression equation is designed.
Events can have qualitative, quantitative and temporal characteristics. A current event is the event which is regarded at the present moment. Relative to current events, all events are divided into past and future. For any of the current events in the history of events, unless the event is first or last in the history, there are past and future events. The very first event has no past, and the last event has no future. There are no storms or accidents on the event market. Faster or slower, any event will be completed. The end of the event fixes the time of the beginning of the next event. Events follow each other and form series of events. The duration of events is different; their change is linear in time. An event is identified by the time of its beginning and end and is an analogue of time. A series of events is a sequence of events determining the state of the market as a set of events included in the series. The event market clearly demonstrates the cyclical nature of event series.
An event is considered as a function of all preceding events. Thus, the current event is a result (consequence) of all preceding events of the current series of events. The current series of events is the consequence of the preceding series of events, etc. At the same time, the current event is one of the causes of a series of events which will follow. The specific way of combining preceding, current and subsequent events into a series of events is an event-driven market profile. Thus, an event is the changes in the socio-economic sphere affecting economic and psychological bases of stock market conditions formation. Event analysis is a type of economic express-analysis for determining the impacts of events on changes in stock market quotations.
Technical event analysis is forecasting of prices through studying the projections of history and their graphic images. Forecasting implies interpolation of the past events and approximation of the obtained results in the future7.
Event analysis is a type of economic express-analysis for determining the impact of events on changes in stock market quotations.
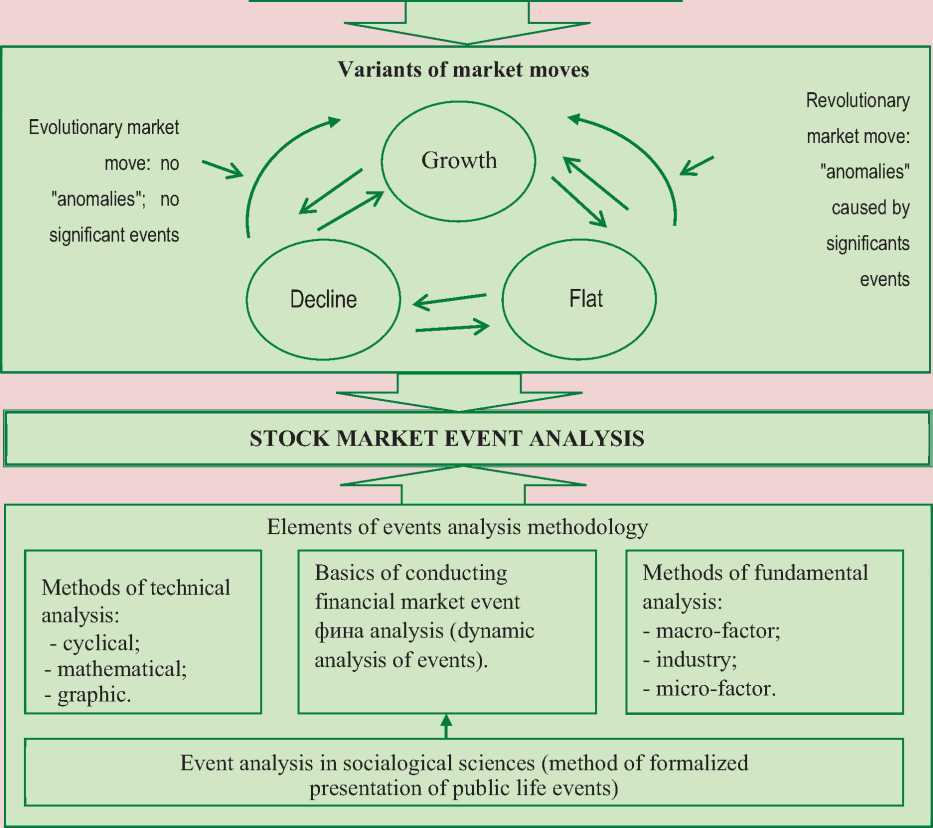
Philosophical and psychological justification of event analysis methodology is presented in the dialectical unity of events and dynamics stock market rates ( Fig. 1 ). The methodology of the proposed analysis includes the following elements:
– the object of event analysis methodology is the the correlation “event– index” (exchange rate dynamics);
– the subject of the methodology is a set of methods and tools for event analysis;
– the purpose for event analysis methodology is to define criteria of market inefficiency in the statistical form amid shortage of relevant information.
The general tool is stock market information efficiency implemented through a set of different methods. This set includes both traditional statistical techniques and methods and the author’s ones based on information elasticity.
Figure 1. Event analysis: theoretical basis and genesis of the method*
Stock market theories
EMH
Theories
allowing the possibility of forecasting
"Medium form"
"Weak form"
"Null form"
"Strong form "
Theori e s excluding the poss i bilit y o f forecasting
link with other theories
* Сompiled by the author.
The problem of event analysis methodology is the imperfection of information disclosure system and, as a consequence, the declining confidence in traditional sources of data on changes in stock market dynamics, which is typical for fundamental and technical analysis of the stock market in general. The modified Efficient Market Hypothesis (EMH) is used in event analysis methodology – formulated in four theory-based forms (amplified with the null form when market is not linked with the state economy and does not react to events).
The method of event analysis is information elasticity as an indicator of information efficiency. The proposed method ensures identification of the unfinished series of events and forecasting future events from these series on the basis of events which produced the complete series which are identical to events which previously produced the already completed series of events. Nowadays, there are actively developing quantitative approaches to the description of influence of political and macro-economic events (news) on financial markets. A unified methodology of the so-called stress testing of scenario event market simulation has not yet been developed. Investment companies in the USA and Europe use event analysis to improve their businesses management efficiency. Interest to event analysis is associated with the ability to predict changes in prices, volatility and traded value on stock market.
Unlike traditional event analysis (R. Ball and P. Brown 8 , E. Fama and others 9 ) implying rationality of market actors, their reactions are often non-linear (irrational). Moreover, during this analysis the issue of “clustering” arises – related events not included in the model occur at the same time. It is only possible to define the efficiency in a dichotomous format: either “Yes” (market is efficient) or “No” (market is inefficient). The author’s approach has some significant advantages as it is objective, it takes into account the non-linearity (irrationality) of reactions of market entities and implies an interval result.
Event analysis is a relatively new tool designed to facilitate the investors’ trading strategies. It is closely connected to the theory of behavioral finance and is in conflict with EMH which states that any available information is already reflected in stock prices. This condition makes it impossible to attempt to beat the market during a long period of time through the use of information available at the market.
Thus, it is necessary to begin with determining the impact of an event on changes is stock exchange prices and, as a consequence, indices.
Calculation of event profile of the day. The previously given definition of “event” makes it impossible to identify and limit the impact of a specific event and justify the correlation between stock prices. Thus, it is not the event itself which affects the market, but a complex events, which in information theory is commonly called an aggregate of events. The author calls this aggregate of events an even profile of the day. Event profile of the day is a complex of events (an aggregate) formally presented through assigning significance (weight) to different events depending on their type and summing them up.
The difference of the proposed approach is that classified events are assigned significance according to various characteristics. Accordingly, the event profile of the day will be calculated according to the following formula:
IvP = Z n0 W v x W t X W d X W f X W p X w x W l , (1)
event units, where Wv – the significance of the event type (from 1 to 6 according to types of events, excluding rumors and expectations, the significance of which is assigned depending on the scope of event itself: for example, if rumors (expectations) are of a political nature it is assigned 6 units of significance);
Wt – significance of event type (1–3);
Wd – weight of impact duration (1–2);
Wf – weight of impact type (- 1–1);
Wp – weight of event center (1–2);
Ws – weight of impact force (1–3);
Wl – weight of analysis level (1–3);
n –number of events.
The unit of measurement – event unit is conditional, it is a subjective measure of entropy in expert evaluation. Of course, all significance indicators have integer values.
This approach is based on the following conditions:
-
1. Definition of types of events which are used the event profile of the day (it is advisable to consider the following types of events: political, economic, sociological, technological, environmental, rumors and expectations). The presence of more event types is inconvenient as they are psychologically difficult for a human to evaluluate;
-
2. Definition of event “weight” (significance) (it is required to group them by weight). The definition of event “weight” is usually subjective. Provision of information in the media is somewhat different in structure and methods of delivery, especially over time. For purposes of analysis, the following categories (seven) have been assigned significance: 6 – for political events, 5 – for force majeure; 4 – for economic 3 – for sociological, 2– for technological, 1– for environmental events. There is also a special category of rumors and expectations – they are assigned weight depending on the type event. If the rumors are of political nature – their weight equals 6, as have already been described above.
-
3. Determination of direction of the influence of events: upward (↑) or downward (↓), i.e., descending or ascending events.
-
4. Classification according to other previously developed criteria and assignment of appropriate weights.
Calculation of event factor of the day. Event-factor differs from event profile of the day, i.e., it will include not only impacts of events occurred during any particular day, but the impacts of all previous days, of course, at a certain time interval. It can be calculated according to the following formula:
IFi = IvPi + I vPi-2 /4 + ( IvPi-1 + IvPi-2 /2)/2 , (2)
where IF – event-factor of the day, event units; IvP – event profile, event units;
i – date of event day in the period under review.
Calculation of information elasticity. It is necessary to focus special attention on the proposed method of information elasticity of the market. The essence of this method consists in the following. EMH is characterized by immediate reaction of exchange rate differences to changes in the existing information. Market is the most efficient in relation to the received information if this information is immediately and fully reflected in asset prices. In real stock exchange markets, market efficiency may be different; the longer market prices adjust to new information, the less efficient the market. Ukrainian stock exchange market can hardly be considered competitive to an extent where it is effective without external pressure or control. This happens for a number of reasons.
First, there is monopoly on information and semi-legal insider trade. A prerequisite for free-competitive efficient market is absence of monopoly on information. Information is public and is received by all investors at the same time. In an efficient market where participants seek to gain maximum profits, any price discrepancy will be eliminated quickly. In the Ukrainian market, insider information becomes a source of profit.
Secondly, the Ukrainian market does not fully use methods of market regulation practically tested by economically developed Western countries. The essence of this regulation is that if you subtract penalties, profit from insider trade must be lower than from the keep-it-if-you-bought-it strategy.
If market actors have any important information they become “information monopolists”. And if they use this monopoly for their own profit then insider influence occurs, which is reflected in market activities. The degree of this influence is defined by the authors as “information elasticity”, namely, the ratio of information flow characteristics and changes in exchange rates. This concept should be considered in more detail. It is known that elasticity (Greek “elasticos” – flexible) is a numerical characteristics of changes in a single metric (e.g., demand or supply) compared to another metric (e.g. price or income). Elasticity is a derivative of one parameter to another: a change in one parameter resulting from increment of one metric by one. As can be seen from the definition, it is necessary to express changes in information flows in some discrete variables. This means that events of political nature must be presented in absolutely certain and exact figures. Thus, we should start with the identification of impacts of the event in the context of their influence on changes in stock prices and, as a consequence, indices.
An event is something that occurs at a random point of space and time; a significant incident, phenomenon or other activity as a fact of public or private life.
Attempts to formalize events has already been made, however, it is only possible to numerically determine information characteristics of events by applying an ordinal scale. Its use is quite possible; it is enough to remember the micro-economic approach to assessing consumer behavior. Accordingly, market actors are “consumers” of securities and, therefore, all characteristics of consumer behavior is also inherent in them. The result of classification of events during the day is the proposed event factor (IFi, formula 2). However, this indicator will not only be evaluated statistically, but also used for estimating information elasticity according to the following formula:
„ M or MP
Е-е = ’ (3)
where EIe – information elasticity index;
Δ I or Δ P –change in the index of stock exchange or stock exchange quotation, expressed as a percentage;
MFt – average change in event-factor of the i -th day.
As can be seen from the formula, the average change in event factor is calculated. In addition, the moving average will also be used. This is important to do to achieve a smaller range of index span because the number of events can vary significantly by individual days. The use of average values will give an opportunity for neutralizing this influence. The moving average will also help “smooth” the impact of individual days, which corresponds to the impact of one day on another and forgetting. That is, calculation of change in event factor requires the use of reference value taken modulo. This is done to ensure that, if the previous negative event factor is available, the subsequent negative factor increases it, which would be correct based on the logic of formation of this index. Next, the possible values and their interpretation should be defines ( Tab. 1 ). As can be seen from above table, the index has two “poles”: either market is not linked with the economy – and events do not cause the reaction of the market, or the market shows activity in the background of the event “calm” period, which indirectly confirms the insider effect. However, in both cases, the market is informationally inefficient. The last column of the table contains the type of market structure. The indicator is uncluded here in connection with the abovementioned additional null form of information efficiency in accordance with types of market structures.
Table 1. Values of stock market information elasticity index and their interpretation
|
Index value |
Form of elasticity |
Interpretation |
Type of market structure |
|
ЕIe< extreme values |
Absolutely inelastic |
Many events are not reflected in exchange rate dynamics – market is not linked with state economy. Market is inefficient. |
Monopoly (monopsony) |
|
0.09 < ЕIe< 0.9 |
Inelastic |
Low market responsiveness to events within the country, market share in total turnover is insignificant. Market is weakly efficient. |
Shared monopoly |
|
Е Ie ≈ 1 (0.9 < ЕIe< 1.1) |
Occasional elasticity |
Events directly influence stock exchange rate dynamics. Market is efficient. |
Monopolistic competition |
|
1.1 < Е Ie< extreme values |
Elastic |
Stock market rates (or stock exchange index) actively react to events. Market is strongly efficient. |
Perfect competition |
|
ЕIe = extreme values* |
Absolutely elastic |
Rates (index) significantly change for no apparent reason (events which may cause such changes are rare). Threat of insider influence. Market is inefficient. |
Monopoly |
|
* Extreme value is identified empirically on the basis of outlier analysis (compiled by the author). |
|||
Thus, the authors logically link the theoretical basis of the methodology of the present study.
Next, the authors show the practical application of the proposed method. First of all, it is necessary to describe the created event base of the research. This base, originally created in the form of Excel tables, covers the time period from May 3rd, 2008 to December 31st, 2013, namely, 1,857 days (five years). Various Internet news resources are used as a source of information. In addition, the database contains data on the US dollar exchange rate to hryvnia and indices of the First Stock Trading System (FSTS) and Ukrainian Stock Exchange from official websites of the National Bank of Ukraine (NBU), FSTS and Ukrainian Exchange (UE).
Coding of events and other preparatory procedures included the following steps:
– all events were assigned weight calculated in event units;
– all event weights were aggregated vertically, i.e., indices of the same events (if multiple events of the same type were recorded) were summed;
– the next step is the summing of events horizontally – the calculation of event profile.
Calculation of event factor and event profile of the day. After that the authors calculated the event profile of the day according to Formula 1, and event factor of the day according to Formula 2. Information elasticity index was calculated according to Formula 3. EMH should be tested with the use of ratio of information efficiency index in several stages:
-
1. Calculation of criterion limits of information elasticity index.
-
2. Grouping of the index depending on type of elasticity.
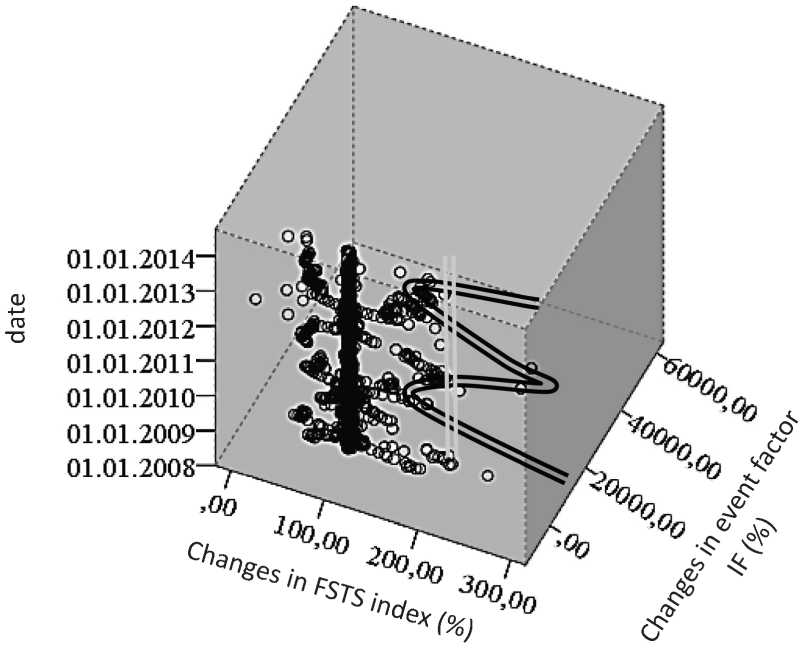
Figure 2. Scatterplot of ΔFSTS and ΔIFn with time reference (a W-shaped scatter trace of object-points)*
-
3. Determination of features of event-driven configurations causing changes in trend (correlation between outliers and events), etc.
-
4. Calculation of criterion limits information elasticity index.
* Compiled by the author.
The number of observation groups should also be determined. For this purpose, the authors make a scatterplot (simple dispersion and precise timing). Graphs are constructed in two coordinates: change in PFTS index and change in event factor of the day – with simple dispersion, three coordinates and the date ( Fig. 2 ).
These indicators, namely changes in index and event factor are chosen as coordinates as they are elements of the formula (3) of information elasticity. However, as seen from the graphs, there is no clear separation of certain groups – a large number of events have a certain impact (however, Figure 2 presents a double-line W-shaped “crossed” mark which will be discussed below). To solve this problem, the authors use a more powerful tool – cluster analysis. The method consists in the formation of groups based on preset variables.
Determination of the optimal number of clusters is based on the indicator displayed under the heading “Indices”.
This index implies the distance between two clusters defined on the basis of the selected distance metric taking into account the intended conversion of values. In this case, it is the squared Euclidean distance defined using standardized values (Tab. 2). At this stage, where the measure of distance between two clusters is increasing by leaps and bounds, the process of combining into new clusters should be interrupted, otherwise it would combine clusters located at a relatively great distance from each other.
In this case, this is the leap from 20.483 to 99,389. This means that after the formation of five cluster, there are no associations anymore, and the result of five clusters is optimal. The optimal number of clusters is the number which is equal to the difference in the number of observations (in this case: 1850) and the number of steps after which the index increases abruptly (step 1845). Thus, the optimal number of groups is five, which corresponds to the previously made assumption about types of information elasticity. After that, with the help of special software with the corresponding function of selection of five maximum and minimum index values (outliers), the authors define numerical boundaries of extreme groups (Tab. 3):
The table shows that extreme value is ≈ ± 3.
Let us convert Table 1 into the following table with specified working criteria ( Tab. 4 ):
Table 2. Agglomeration procedure (calculated on the basis of “Event base of Ukraine stock market information efficiency in 2008–2013” database)10
|
Step |
Cluster grouping |
Indices |
Step where the cluster is revealed for the first time |
Next step |
||
|
Cluster 1 |
Cluster 2 |
Cluster 1 |
Cluster 2 |
|||
|
1 |
1790 |
1857 |
0.000 |
0 |
0 |
2 |
|
2 |
2 |
1790 |
0.000 |
0 |
1 |
4 |
|
3 |
1725 |
1732 |
0.000 |
0 |
0 |
4 |
|
1844 |
882 |
1315 |
10.809 |
0 |
0 |
1847 |
|
1845 |
2 |
11 |
15.379 |
1843 |
1842 |
1848 |
|
1846 |
239 |
1386 |
20.483 |
1841 |
0 |
1848 |
|
1847 |
882 |
1309 |
99.389 |
1844 |
0 |
1849 |
|
1848 |
2 |
239 |
230.134 |
1845 |
1846 |
1849 |
|
1849 |
2 |
882 |
1631.989 |
1848 |
1847 |
1850 |
|
1850 |
2 |
1756 |
109673.216 |
1849 |
0 |
0 |
Note. Hereinafter, the source is the specified database.
-
10 A. s. 2015620988 RF, “Baza dannykh “Baza sobytii informatsionnoi effektivnosti fondovogo rynka Ukrainy 2008-2013 g.g.” Ros. Federatsiya: zaregistrirovana v gosudarstvennom reestre programm dlya EVM g. / K.A. Malyshenko (RF); zayavleno 3.04.2015; opubl. 20.07.2015, Byul. № 7. – 1 s. [A. s. 2015620988 Russian Federation, “Database “Database of the events of the information efficiency of the stock market of Ukraine in 2008–2013””. Russian Federation: registered with the state register of computer programs. K.A. Malyshenko (Russian Federation); declared 3 April 2015; published 20 July 2015, bulletin no. 7. 1 p.].
-
11 Malyshenko K.A. Informatsionnaya effektivnost’ fondovogo rynka: monografiya [Informational efficiency of stock markets: monograph]. Simferopol’: ARIAL, 2014. 443 p.
Table 3. Limiting (extreme) values of information elasticity index
|
Values |
No. of event |
Е Ie |
|
|
Maximum |
1 |
1386 |
17.96238 |
|
2 |
239 |
14.33097 |
|
|
3 |
1053 |
12.69184 |
|
|
4 |
1238 |
3.91086 |
|
|
5 |
1141 |
3.40330 |
|
|
Minimum |
1 |
882 |
-45.0109 |
|
2 |
1315 |
-41.7232 |
|
|
3 |
1309 |
-33.5341 |
|
|
4 |
1695 |
-5.28390 |
|
|
5 |
1236 |
-4.38490 |
Table 4. Criterion values of stock market information elasticity index and their interpretation11
|
No. |
Index value |
Form of elasticity |
Interpretation |
Type of market structure |
|
1. |
ЕIe<= – 5 |
Absolutely inelastic |
Market is inefficient |
Monopoly (monopsony) |
|
2. |
–5 < ЕIe<= 0.9 |
Inelastic |
Market is weakly efficient |
Shared monopoly |
|
3. |
Е Ie ≈ 1 (0.9 < ЕIe< 1.1) |
Occasional elasticity |
Market is efficient |
Monopolistic competition |
|
4. |
1.1 < ЕIe< = 3 |
Elastic |
Market is strongly efficient |
Perfect competition |
|
5. |
Е Ie > 3 |
Absolutely elastic |
Threat of insider influence. Market is inefficient |
Perfect monopoly |
In accordance with the chosen boundaries, the index values under review are grouped in five groups:
-
1. Group – Е Ie values – absolutely inelastic – the market does not respond to significant events.
-
2. Group – Е Ie values – inelastic – the market responds weakly to significant events.
-
3. Group – Е Ie values –occasional elasticity – the market proportionally responds to significant events.
-
4. Group – values Е Ie – elastic – the market reacts to significant events on a larger scale.
-
5. Group – values Е Ie – absolutely elastic – the market strongly reacts to significant events.
Reaction here is referred to as a significant change in indices exceeding normal fluctuations.
Back to Figure 2, let us present it more schematically with reference to the selected
-
11 Malyshenko K.A. Informatsionnaya effektivnost’ fondovogo rynka: monografiya [Informational efficiency of stock markets: monograph]. Simferopol’: ARIAL, 2014. 443 p.
subsets with the W -shaped trace with reference to forms of elasticity ( Fig. 3 ) distinguished above ( Tab. 4). The there are five groups (this corresponds with the results of cluster analysis), which contain values of information elasticity index from completely inelastic to completely elastic.
The line which passes through all five groups contains cases of occasional elasticity, and, consequently, the transition from one group approximately passes through this area.
Moreover, the resulting set of cases can be described in the form of multiple regression functions and can be used for forecasting. This reflects its theoretical importance.
It should be noted that: first, not all points precisely fit the selected groups – some of them are scattered around the lines – the entry of object-points is clearly observed in graphs of theoretical dependencies; second, the three-dimensional shape slightly distorts the perception of the scheme, however, if we remember the stock market demand graph which has a stepped configuration, the presented figure corresponds to this one; third, this graph contains relative values (indexes) as point-objects and they may be in error. After this, the author groups the indices using empirical data from database and assigns the corresponding group numbers. Thus, the
-
Figure 3. Schematic scatterplot with reference to forms of elasticity*
Change in event factor, %

2008 2009 2010 2011 2012
Data
Table 5. The number of cases in groups, EIe (frequency analysis)
Groups 1 and 5, as expected, (based on the established outlier range) contain five cases or 0.3% of the total set. The most numerous Group 2 contains 99.0% of all cases. The third group has only 2 cases, or 0.1%. The fourth group includes only 7 cases – 0.4%. Thus, the author concludes that Ukraine stock market is largely inelastic, i.e., the market is weakly efficient which corresponds to market type known as shared monopoly. This result confirms the previously made conclusion made as result of using traditional standard statistical procedures. However, the proposed method helps analyze daily dynamics of market behavior and evaluate its efficiency during when conducting activities in the framework of the state financial policy.
The author also uses the proposed method for analysis in the context of individual years (quarterly or monthly) of the period under review for evaluating market structure changes (shares of individual groups of EIe) ( Tab. 6 ).
Thus, during the analyzed period there were five questionable cases (the fifth group in the table) when the market was active which clearly did not correspond to the event profile. One case in 2008 and two cases in 2011 and 2012. It might have been the manifestation of insider influence. The revealed cases show that the event background is not consistent with market reactions, namely: significant changes in the index towards this or that direction cannot be explained, there are no visible events which could cause such outliers. This is confirmed by high information inelasticity indices. Let us consider these cases. The author specifies the month and date of the anomaly. The most significant were indices which characterized the market as inelastic in August 22nd, 2011, December 27th, 2008, February 29th and July 27th, 2012, November 21st, 2011.
It is necessary to find out what happened on the days in question and five days later to figure out the possible causes and eliminate improper conclusions caused by the fact that the recorder creating the event database missed a certain event. A more detailed study
Table 6. Number of cases in each group EIe by year
Thus, the author empirically confirmed considerable accuracy (in four cases out of five) of using the proposed method for detection of insider influence, which provides an opportunity of using it for purposes of prudential supervision of stock market transactions by relevant authorities.
The source of insider impact is the imperfect system of stock market regulation of countries with the developing economy, which helps use it to gain monopoly and excess profits, which results in violation of rights of small investors, first of all, to information. Despite the fact that EMH is actually an idealization, which does not fully reflect the actual state, it serves as a measuring instrument of relative market efficiency, which contains the practical value of event analysis conducted on its basis. To apply it it is necessary to have a perfect information disclosure system, which, unfortunately, is underdeveloped in CIS states. However, the following conclusions are made:
-
1. The presented approach helps conduct research of EFH amid insufficient information awareness on the basis of event study analysis. For this purpose the author explains the method of event analysis of information efficiency evaluation, develops the theoretical basis for the formation of event-driven research basis, etc.
-
2. Based on empirical research the author has determined the criterion values of stock market information elasticity index their interpretation, distinguished five groups according to type of market structures and with their help, grouped all observations.
-
3. As a result of grouping five questionable cases have been identified, when market was active, though this activity clearly did not correspond to the event profile. The author has also empirically confirmed the significant accuracy (in four cases out of five) of using the proposed method for detection of insider influence.
References Studying the stock market of Ukraine with the use of the event analysis
- A. s. 2015620988 RF, "Baza dannykh "Baza sobytii informatsionnoi effektivnosti fondovogo rynka Ukrainy 2008-2013 g.g." Ros. Federatsiya: zaregistrirovana v gosudarstvennom reestre programm dlya EVM g./K.A. Malyshenko (RF); zayavleno 3.04.2015; opubl. 20.07.2015, Byul. № 7. -1 s. ..
- Blishchik S.L. Problemi ta perspektivi rozvitku fondovogo rinku Ukraїni . Upravlinnya rozvitkom , 2011, no. 9 (108), pp. 65-67.
- Damodaran A. Investitsionnaya otsenka. Instrumenty i tekhnika otsenki lyubykh aktivov . Translated from English. Moscow: Al'pina Biznes Buks, 2004. 1342 p..
- Davis M.H.A. Lineinoe otsenivanie i stokhasticheskoe upravlenie . Translated from English by M.V. Burnashev and A.A. Novikov. Ed. by. A.N. Shiryaev. Moscow: Nauka, 1984. 205 p..
- Zinenko A.V. Sobytiinyi indikator finansovogo rynka . Vestnik Sibirskogo aerokosmicheskogo universiteta im. ak. Reshetneva, MF: sb. nauch. tr. , 2006, no. 6 (13), pp. 126-129..
- Klimarev N.V., Studnikov S.S. Metodologicheskie problemy primeneniya metoda sobytiinogo analiza v finansovykh issledovaniyakh . Vestnik Moskovskogo universiteta. -Seriya 6: Ekonomika , 2011, no. 6, pp. 58-67..
- Malyshenko K.A. Informatsionnaya effektivnost' fondovogo rynka: monografiya . Simferopol': ARIAL, 2014. 443 p..
- Moshenskii S.Z. Transformatsionnye protsessy na mirovykh rynkakh tsennykh bumag . Finansy Ukrainy , 2009, no. 7, pp. 54-63..
- Shevchenko I.G. Poryadok i khaos rynka aktsionernogo kapitala Rossii . M.: Upr. personalom, 2003. 216 p..
- Academic Economics: Strengths and Faults after Considering Interdisciplinary Needs. Herb Kay Undergraduate Lecture University of California, October 3, 2003.
- Bondt W. De., Thaler R. Does the stock market overreact. Journal of Finance, 1985, no. 40, pp. 793-808.
- Becker K.-G., Finnerty J., Friedman J. Economic news and equity market linkages between the U.S. and U.K. Journal of Banking and Finance, 1995, no. 19, pp. 1191-1210.
- Dominguez K.M., Frankel J.A. Does foreign exchange intervention work? Institute for International Economics. Washington, DC, 1993.
- Fama E. Efficient capital markets: a review of theory and empirical work. Journal of Finance, 1970, no. 25, pp. 383-417.
- Fama E.F., Fisher L., Jensen M.C., Roll R. The adjustment of stock prices to new information. International Economic Review, 1969, no. 10 (1), pp. 1-21. Available at: http://links.jstor.org/sici (accessed 21.03.2016).
- Holland J.H. Adaptation in natural and artificial systems. 2nd edition. The MIT Press, 1992.
- Humpage O.F. Dollar Intervention and the Deutschemark-Dollar Exchange Rate: A Daily TimeSeries Model. Working Paper 8404. Federal Reserve Bank of Cleveland, 1984.
- Shefrin H., Statman M. The disposition to sell winners too early and ride losers too long: theory and evidence. Journal of Finance, 1985, no. 40, pp. 777-790.
- Simon H. Administrative Behaviour: A Study of Decision Making Processes in Administrative Organization. New York, 1947.
- Tuma N.B., Hannan M.T., Groeneveld L.P. Dynamic analysis of event histories. American Journal of Sociology, 1979, no. 84 (4), pp. 820-854.
- Tversky A., Kahneman D. Prospect Theory: An Analysis of Decision under Risk. Econometrica, 1979.
- Warwick B. Event trading: profiting from economic reports and short-term market inefficiencies. Chicago: Irwin, 1996.
