Successive RR Interval Analysis of PVC With Sinus Rhythm Using Fractal Dimension, Poincaré Plot and Sample Entropy Method

Author: Md. Meganur Rhaman, A. H. M. Zadidul Karim, Md. Maksudul Hasan, Jarin Sultana
Journal: International Journal of Image, Graphics and Signal Processing(IJIGSP) @ijigsp
Article in issue: 2 vol.5, 2013.
Free access
Premature ventricular contractions (PVC) are premature heartbeats originating from the ventricles of the heart. These heartbeats occur before the regular heartbeat. The Fractal analysis is most mathematical models produce intractable solutions. Some studies tried to apply the fractal dimension (FD) to calculate of cardiac abnormality. Based on FD change, we can identify different abnormalities present in Electrocardiogram (ECG). Present of the uses of Poincaré plot indexes and the sample entropy (SE) analyses of heart rate variability (HRV) from short term ECG recordings as a screening tool for PVC. Poincaré plot indexes and the SE measure used for analyzing variability and complexity of HRV. A clear reduction of standard deviation (SD) projections in Poincaré plot pattern observed a significant difference of SD between healthy Person and PVC subjects. Finally, a comparison shows for FD, SE and Poincaré plot parameters.
ECG, Fractal Dimension, PVC, Sample Entropy, Poincaré plot
Short address: https://sciup.org/15012556
IDR: 15012556
Text of the scientific article Successive RR Interval Analysis of PVC With Sinus Rhythm Using Fractal Dimension, Poincaré Plot and Sample Entropy Method
PVC may be perceive as a "skipped beat" or felt as palpitations in the chest. In a normal heartbeat, the ventricles contract after the atria have helped to fill them by contracting. In this way, the ventricles can pump a maximized amount of blood both to the body and to the lungs [1]. The ventricle electrically discharges prematurely before the normal electrical discharges. These premature discharges are due to electrical "irritability" of the heart muscle of the ventricles can be caused by heart attacks, electrolyte imbalances, lack of oxygen, or medications. Conventionally used time and frequency domain parameters of HRV [2, 3] are not always suitable for analysis because of the non-stationary characteristic of the ECG. The visual analysis of variability of the Poincaré plot [4] and quantification of the unpredictability and complexity of the heart rate using sample entropy [5] is being increase because they can computed from shorter ECG records. RR interval means the R to R magnitude interval of QRS complex of ECG. Fractal is a mathematical investigation for characterizing complex, replicating geometrical patterns at different scale lengths [6]. Fractal behavior is exhibit by the heart of electrocardiogram signals and by the brain in electroencephalogram (EEG) signals [7], [8]. This paper presents the application of fractal theory, Poincare plot and SE method to the analysis of ECG data. The PVC cardiac abnormalities are discussion in this paper. The ECG’s are taking for 30 minutes and sample at 360Hz. At first FD of healthy persons (HP) are determined by the three methods. These three methods are than applied for patients with PVC diseases to determine its range of variation from healthy patients. So by determining the FD of an ECG signal, an estimation of heart condition can be make. The aim of this study was to determine how and which of the variability and complexity parameters of the HRV derived from the FD, Poincaré plots and sample entropy are different in patients with PVC compared with subjects with normal rhythm
-
II. METHOD
The ECG signal will processed through a series of steps to calculate fractal dimension (FD). Different methods of calculating FD such as relative dispersion
(RD) analysis, power spectral density (PSD) analysis, and rescaled range (RS) analysis [9], [10] will be applied. An algorithm based on indexes of Poincaré plots and sample entropy, developed to distinguish between ECG of HP and PVC subjects. The data sets of ECG taken from MIT-BIH arrhythmia database.
-
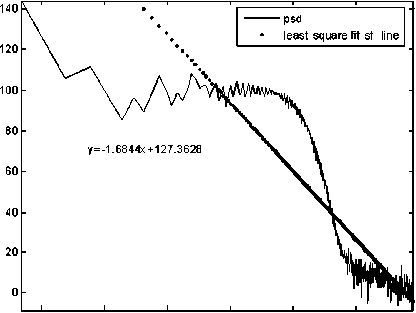
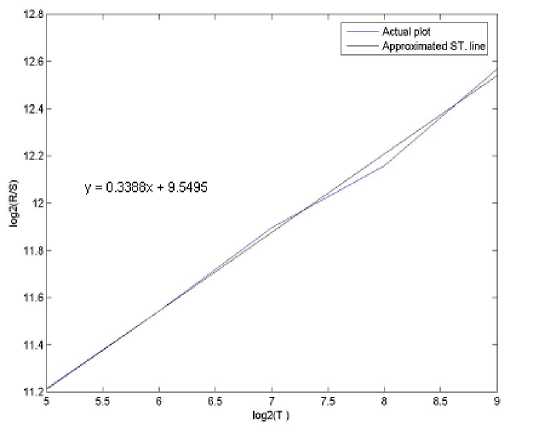
A. Relative Dispersion (RD) Analysis
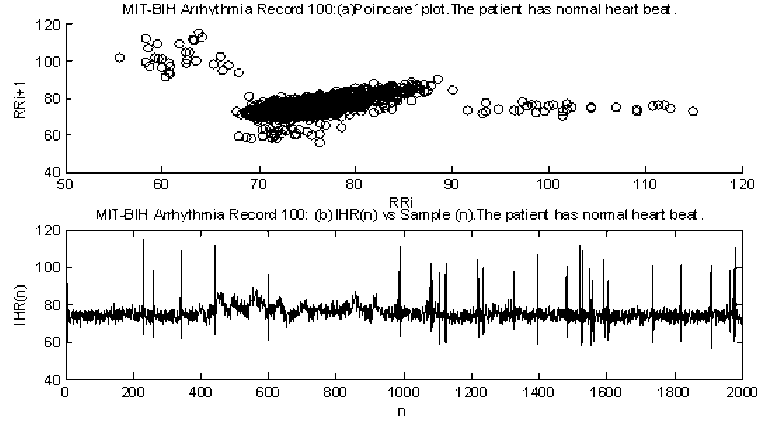
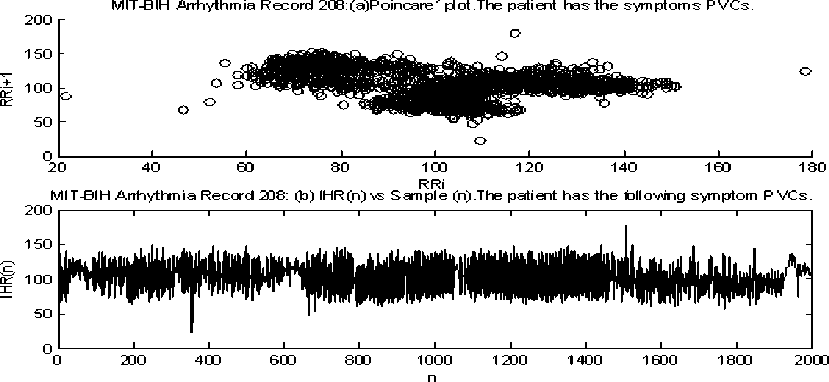
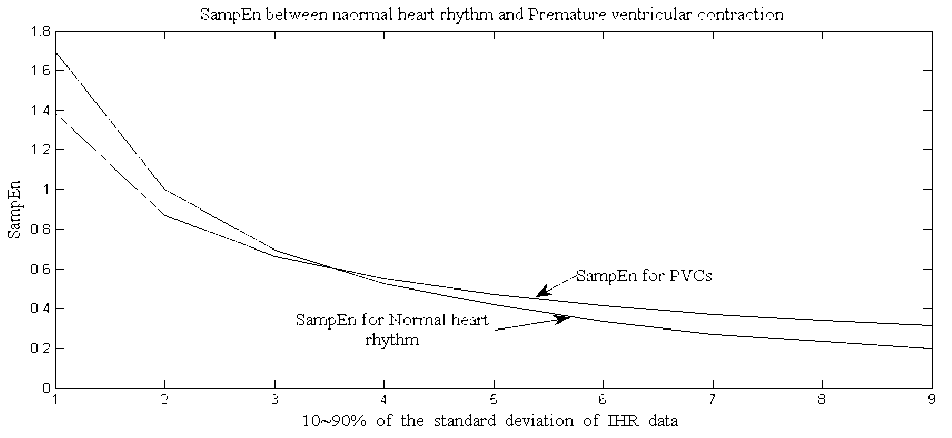
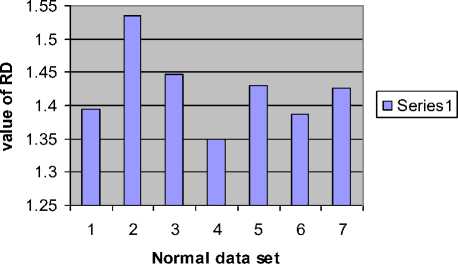
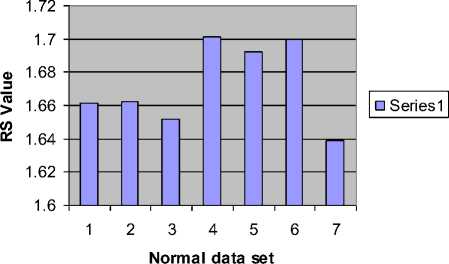
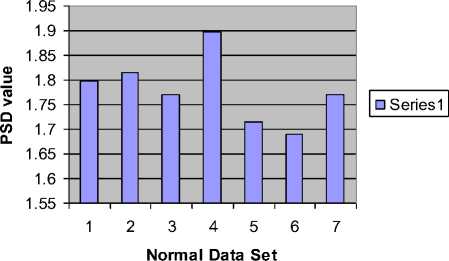
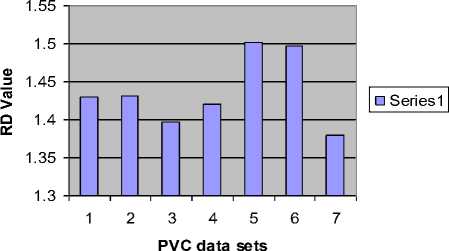
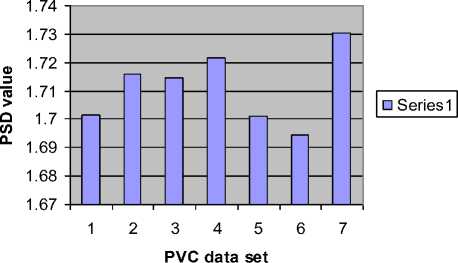
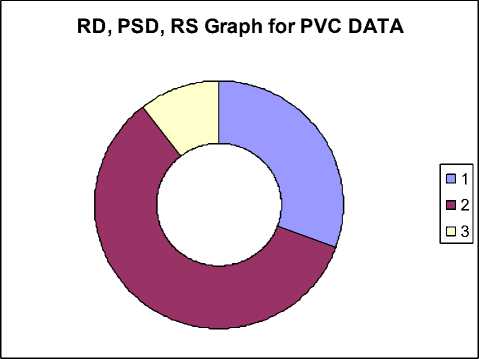
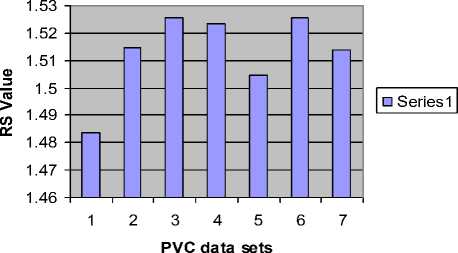
The basic principle of RD analysis is making estimates of the variance of the signal at each of several different levels of resolution form the basis of the technique. For fractal signals, a plot of the log of the standard deviation versus the log of the measuring element size gives a straight line with a slope of one - D, where D is the fractal dimension. H is a measure of roughness; the roughness in the signal is maximal at H near zero. White noise with zero correlation has H = 0.5. Smoother correlated signals have H near 1.0. For onedimensional series, H = two - D, where D is the fractal dimension, 1 , . 2 X? (%, -%) Standard deviation (SD) = ——1-^----- (1) Where, x = Random variable, x = Mean of the variables, N= Number of Samples. By calculating the RD for different bin sizes, n and fitting the square law function: ri"”1 RD -RD0(—) (2) Where, RD0 is the RD for some reference bin size n0. The whole data set used for each calculation of RD (n) at each level of resolution or number of pieces, n. The exponent can best estimated by a log-log transformation. log(^D) — log(T?D o) + (H - 1)logA (3) Here, H-1 = slope, for fractal dimension, D=2-H. D=2-(1+Slope) So, D=1-Slope (4) B. Power Spectral density The power spectrum of a pure fractional Brownian motion is known to be described by a power law function: Ml2—(5) Where |A| is the magnitude of the spectral density at frequency, with an exponent β = 2H + 1. Here again, a straight line is fitted from a log-log plot and H is calculated from the slope β. In the frequency domain, fractal time series exhibit power law properties, p (D — f-a (6) Where P(f) is the power spectral density f and the exponent α is the so called power-spectral index. For the values region between FD = 1 and FD = 2 the following relationship between FD and α is valid, FD — (—), for 1 < FD < 2 (7) 5—Slope Fractal dimension, D — —(8) C. Rescaled Range analysis Hurst laid the basis of the RS analysis. Mandelbrot and Wallis examined and further elaborated the method. Feder [11] gives an overview of theory and applications, and adds some statistical experiments. There are two factors used in this analysis: firstly the range R, this is the difference between the minimum and maximum 'accumulated' values or cumulative sum of X(t, t) of the natural phenomenon at discrete integer-valued time t over a time span t and secondly the standard deviation S, estimated from the observed values X((t). Hurst found that the following experiential relation very well describes the ratio R/S for a large number of natural phenomena. ^ *(9) Where Hurst took the coefficient c equal to 0.5 R and S defined as R(t) — maxX(t,T) - minX(t, t)(10) l And, S(T) — (|X?=Jf(u) - (Ш2У Where: (f)T—|XR(t) And, X(t,T)—^^^^(^-(f),] We calculate the individual calculations for each interval length. A straight line fitted in the log-log plot: log [s(i)] — c + H log(T) Where H = slope. So, Fractal dimension, D = 2 - H or D = 2 - Slope. D. Poincaré plot analysis The Poincaré plot is a two-dimensional visualization display of the dynamic properties of a system from a time series [12]. The Poincaré plot was generated as a scatter plot of current instantaneous heart rate (IHR) against the IHR immediately preceding it [13]. In this paper we define the Poincaré plot for a data vector RRi = (RR1, RR2 ... RRN) of length N. First, we define two auxiliary vectors: RRt — (RR!,RR2,.........,RRW-i) (15) RR-— (RR2, RR3,........., RRn) (16) The Poincaré plot consists of all the ordered pairs: (RRt,RR7), i=1.........N-1 SD1 and SD2 are two standard Poincaré plot descriptors. SD1 is defined as the standard deviation of projection of the Poincaré plot on the line perpendicular to the line of identity (y = -x) while SD2 as that on the line of identity (y = x). We can define SD1 and SD2 as: SD1 = ^V ar (X^ SD 2 = VVar(^) where, (rr - r rr т) X1 .. (RRt+RRT) We define a parameter S that reflects the total variability of the Poincaré plot, which is the area of the ellipse S S = n x SD1 x SD 2 E. Sample entropy analysis Sample Entropy is relate to dynamical systems and is define as the rate of information production. SE entropy measure frequently applied to clinical cardiovascular and other time series analysis of different types of abnormalities [5, 14]. Quantification of the irregularity and difficulty of the heart rate using sample entropy [13, 14] are increase because they can be compute from shorter HRV records. Using SE statistics a sequence of total N numbers of IHR such as IHR (1), IHR (2),………, IHR (N). To compute SE of each IHR data set, m-dimensional vector sequences pm (i) were constructed from the IHR time series pm(1),pm(2),.........pm(N - m + 1), where the index i can take values ranging from 1 to N-m+1. If the distance between two vectors pm(i) and pm(j) is defined as |pm(0 - pm(j)l, then, ^=7^ (22) where, M is the number of vectors such that |pm(i) -pm(j)l N-m-l m SE(N,m,r)=\n(^^_ C^) (23) ^i=i Ci v ) III. RESULTS AND DISCUSTION Figure 1, 2 and 3 show the RD, PSD and RS analysis for data 115 with data length N=4096. Table 1 summarizes the result from RD, PSD and RS for HP and PVC. Here the values of seven data sets (MIT-BIH data set # 115, 117, 122, 100, 105, 111 and 116) of HP ECG are compute. Same is done for seven data sets (119, 208, 221, 106, 201, 210 and 233) of PVC patients. The FD descriptors analyzed to see if any significant difference found between HP and PVC data series. Figure 4 and 5 show the Poincaré plot and IHR time series of normal and PVC data sets. Here, the average values of 8 data sets (100, 105, 111, 112, 116, 118, 121 and 122) of HP ECG are computed. Similarly, for rest eight data sets (106, 119, 201, 208, 210, 221, 223 and 233) of PVC patients. The SD descriptors analyzed to see if any significant difference found between normal and PVC data series. Figure 5 demonstrates the change of SE with m=2 and r=0.1*SD to 0.9*SD of IHR data for normal and PVC subjects. The mean values of SE of the healthy group were found to be lower than the PVC at all ‘r’ values except at 0.1*SD, 0.2*SD and 0.3*SD. Statistically, the SE of HP group is found to be significantly different from the PVC group at r > 0.3*SD. Figure 6 display the average sample entropy of normal and PVC beats. Figure 7, 8, 9, 10, 11 and 12 show the FD with RD, PSD, and RS method for HP and PVC. Figure 13 and 14 illustrate FD range variation for HP and PVC with RD, PSD, and RS methods. FD Range Variation = Maxim Value - Minim Value. Figure 15 show the Difference of FD variation between HP and PVC for RD, PSD, and RS methods. From Table 1, it is obvious that there is a clear reduction of FD for RD, PSD and RS in PVC data series. From Table 2 we found different range of FD with RD, PSD and RS for HP and PVC. For RD the range of PVC (1.38-1.51) falls in HP (1.34-1.54). For PSD the range of PVC (1.69-1.74) is lower than HP (1.69-1.90). For RS the range of HP (1.63-1.71) is higher than the ranges of PVC (1.48-1.53). Table 3 signifies the FD range variation for different beat type and its difference with different methods. From Table 4 it is obvious that there is a clear reduction of SD1, SD2, Ratio and S in the HP and PVC. The average SE values at different ‘r’ summarized in Table 5. Figure 1. Actual and approximated straight line for RD analysis (for Data Set-115). psd plot for N=4096, (data - 115) psd in log scale -40 -20 0 20 40 60 normalized freq in log scale -5 5 1----------------------------------1----------------------------------1----------------------------------1----------------------------------1----------------------------------1----------------------------------1 ■ 0 2 4 6 8 10 12 log n base 2 Figure 2. Actual and approximated straight line for PSD analysis for Data Set-115. Figure 3. Actual and approximated straight line for RS analysis for Data Set-115. Figure 4. (a) Poincaré plot and (b) IHR of MIT-BIH Record_100 For HP. Figure 5. (a) Poincaré plot and (b) IHR of MIT-BIH Record_208 for PVC. Figure 6. Average sample entropy of normal and PVC beats. RD chart for normal data set RS chart for normal data set Figure 7. FD with RD method for HP. Figure 9.FD with RS method for HP. PSD chart for normal data set Figure 8. FD with PSD method for HP RD Chart for PVC Figure 10. FD with RD method for PVC. PSD chart for PVC Figure 11. FD with PSD method for PVC. Figure 14. FD range variation for PVC with RD (□ 1), PSD (02), and RS (03) methods. RS Chart for PVC Figure 12. FD with RS method for PVC. Difference between normal data and PVC data RD, PSD, RS Graph for Normal Heart Figure 15. Difference of FD variation between HP and PVC with RD (□1), PSD (02), and RS (03) methods TABLE I. FD OF DIFFERENT BEAT TYPE FOR DIFFERENT METHODS WHEN DATA LENGTH N=4096 Figure 13. FD range variation for HP with RD (□I), PSD (02), and RS (03) methods. Beat Type Record No FD for RD FD for PSD FD for RS HP 115 1.3952 1.7965 1.6612 117 1.5349 1.8148 1.6626 122 1.4460 1.7704 1.6521 100 1.3492 1.8975 1.7012 105 1.4309 1.7142 1.6925 111 1.3861 1.6905 1.7001 116 1.4258 1.7709 1.6392 PVC 119 1.4302 1.7015 1.4836 208 1.4312 1.7159 1.5146 221 1.3975 1.7147 1.5256 106 1.4202 1.7215 1.5236 201 1.5012 1.7009 1.5046 210 1.4975 1.6947 1.5256 233 1.3802 1.7305 1.5136 TABLE II. RANGE OF FD FOR DIFFERENT BEAT TYPE FOR DIFFERENT METHODS WHEN N=4096. Beat Type FD range for RD FD range for PSD FD range for RS HP 1.34-1.54 1.69-1.90 1.63-1.71 PVC 1.38-1.51 1.69-1.74 1.48-1.53 TABLE III. FD RANGE VARIATION FOR DIFFERENT BEAT TYPE AND ITS DIFFERENCE Beat Type FD range Variation for RD FD range Variation for PSD FD range Variation for RS HP 0.186 0.207 0.040 PVC 0.121 0.234 0.042 Difference 0.065 0.027 0.002 TABLE IV. AVERAGE VALUES OF POINCARE PLOT PARAMETERS Parameter Normal rhythm PVC SD1 5.61 24.91 SD2 7.14 20.44 Ratio 0.74 1.31 Area of ellipse(S) 150.48 1607 TABLE V. AVERAGE SE VALUES OF HP AND PVC SUBJECT WITH (m=2) Similarity Criterion ® SE for HP SE for PVC 10% of SD 1.69 1.38 20% of SD 1.00 0.87 30% of SD 0.69 0.66 40% of SD 0.52 0.55 50% of SD 0.42 0.47 60% of SD 0.34 0.41 70% of SD 0.27 0.37 80% of SD 0.23 0.34 90% of SD 0.20 0.31 IV. CONCLUSION This work describes the application of fractal theory to heart rate dynamics. The fractal dimension for HP hearts as well as hearts with PVC calculated here. We compared three numerical methods to estimate the fractal dimension. RD analysis provides good result for longer data length, for PSD analysis the range of FD is close to the range of healthy person. We found better result for RD analysis because the difference between normal value and PVC is higher for RD data. The sample entropy (SE) and Poincare plot analysis to differentiate the normal rhythm from the PVC. Poincare plot can provide supplementary information about beat-to-beat HRV structure, which cannot obtain by conventional time and frequency domain analysis [15]. Poincaré plot images represent short and long-term variability. The results show that there is a significant difference between the Poincaré plot parameters of normal rhythm data sets and that of PVC data sets. Lower values of SE reflect more regular time series while higher values are associated with less predictable (more complex) time series [16]. The major finding of this study shows a lower SE is found for normal rhythm data sets and higher in PVC data sets. To make these methods applicable, works are needed to be done with all normal heart abnormalities, with a large number to samples for each abnormality. The nonlinear measures can be investigated further in future studies of heart rate variability in different cardiac diseases. The same methods can be used for analysis of two or three dimensional signals, the methods can be extended to account for anisotropy, making the analysis more complicated but adhering to the same basic theory. The fractal analysis can also be applied further in image analysis, fluid dynamics, investing natural phenomenon etc.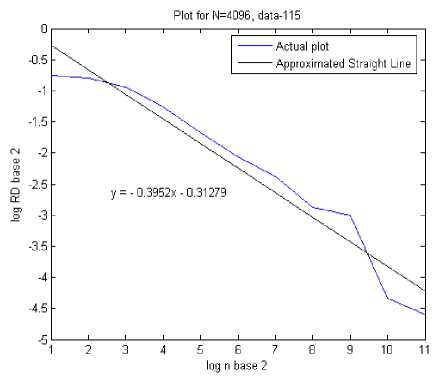
References Successive RR Interval Analysis of PVC With Sinus Rhythm Using Fractal Dimension, Poincaré Plot and Sample Entropy Method
- J. E. Keany and A. D. Desai, "Premature ventricular contraction" in http://emedicine.medscape.com/ article/761148-overview.
- D. A. Litvack, T. F. Oberlander, L. H. Carney and J. P. Saul, "Time and frequency domain methods for heart rate variability analysis: a methodological comparison," Psychophysics, vol. 32, pp. 492–504, 1995.
- N. V. Thakor and K. Pan, "Tachycardia and fibrillation detection by automatic implantable cardioverter-defibrillators: sequential testing in time domain," IEEE Trans. Biomed. Eng., vol. 9, pp. 21-24, 1990.
- P. Guzik, J. Piskorski, T. Krauze, R. Schneider, K. H. Wesseling, A. W. Towicz and H. Wysocki, "Correlations between the Poincaré Plot and conventional heart rate variability parameters assessed during paced breathing," J. Physiol. Sci., vol. 57, pp. 63–71, 2007.
- J. S. Richman and J. R. Moorman, "Physiological time-series analysis using approximate entropy and sample entropy," Am J Physiol, vol. 278, pp. 2039–2049, 2000.
- K. Falconer, Fractal Geometry: Mathematical Foundations and Applications, John Wiley & Sons, 1990, vol. 1, pp. 110-112.
- W. Deering and B. J. West, "Fractal Physiology," IEEE EMB Mag., vol. 12, pp. 40-46, 1992.
- A. L. Goldberger, D. R. Rigney and B. J. West, "Chaos and fractals in human physiology," Scientific American, vol. 262, pp. 42-49, 1990.
- H. E. Schepers, J. H. G. M. Van Beek and J. B. Bassingthwaighte, "Four methods to estimate the fractal dimension from self-affine signals," IEEE EMB Mag., vol. 12, pp. 57-71, 1992.
- P. Bak and K. Chen, "Self-organized criticality," Sci Amer, vol. 246, pp. 46-53, 1991.
- C. Tricot, Curves and Fractal Dimension, New York: Springer-Verlag, 1995, vol. 1, page 148-157.
- J. Piskorski and P. Guzik, "Filtering Poincaré plots," Computational Methods in Science and Technology, vol. 11, pp. 39-48, 2005.
- P. W. Kamen and A. M. Tonkin, "Application of the Poincaré plot to heart rate variability: a new measure of functional status in heart failure," ANZ J Med, vol. 25, pp. 18–26, 1995.
- P. Castiglioni and M. Di Rienzo, "How the threshold R influences approximate entropy analysis of heart rate variability?," Computers in Cardiology, vol. 35, pp. 561−564, 2008.
- M. Brennan, M. Palaniswami and P. Kamen, "Do existing measures of Poincaré plot geometry reflect nonlinear features of heart rate variability?" IEEE Trans Biomed Eng., vol. 48, pp. 1342–1347, 2001.
- S. Behnia, A. Akhshani, H. Mahmodi and H. Hobbenagi, "On the calculation of chaotic features for nonlinear time series," Chinese J. Physics, vol. 46, pp. 394-404, 2008
