Surface Electromyography Signal Acquisition and Classification Using Artificial Neural Networks (ANN)
")
Author: R.M.P.K. Rasnayake, M.W.P. Maduranga, J.P.D.M. Sithara
Journal: International Journal of Modern Education and Computer Science @ijmecs
Article in issue: 3 vol.14, 2022.
Free access
An electromyography (EMG) is an analytical tool used to record muscles' electrical activity, which produces an electrical signal proportional to the level of muscle activity. EMG signal plays a vital role in bio-mechatronic engineering for designing intelligent prostheses and other rehabilitation devices. Analysis of EMG signals with powerful and advanced methodologies is an essential requirement in EMG signal processing, as the EMG signal is a complex nonlinear, non-stationary signal in nature. It is required to use advanced signal processing techniques rather than conventional methods to exact EMG signals' features. Fourier transforms (FT) are not the most appropriate tool for analyzing non-stationary signals such as EMG. In this work, we have developed a system that can be useful for disabled persons to get a regular lifestyle using a functioning part of the body. Here, we studied the electrocution gram behavior of human body parts to feature extraction and trained the neural network to simulate the movements of mechanical actuators such as robotic arms. The wavelet transformation has been used to get high-quality feature extraction from electro cardio grapy and develops proper faltering methods for cardio systems' electrical signals. Finally, an artificial neural network (ANN) is used to classify the EMG signals through exacted features. Classification results are presented in this paper.
Surface electromyography, wavelet transforms, Artificial Neural Network, Fourier Transform, Machine Learning for Signal processing
Short address: https://sciup.org/15018460
IDR: 15018460 | DOI: 10.5815/ijmecs.2022.03.04
Text of the scientific article Surface Electromyography Signal Acquisition and Classification Using Artificial Neural Networks (ANN)
At present, many disabled people live around the world, those who unfortunately lost their limbs through accidents [1]. Moreover, many people from other countries mentally felt down because of these miserable incidences. There are various types of prosthetic devices found in today's world as a solution to amputees, those who have lost their limbs. Most of these prosthetic devices are fully mechanical driven, and there are no significant interactions of this prosthesis with a human biological sense [2-3]. But human-machine interaction, based on features of human biological signals, is one of the key focuses and has drawn significant research attention in medical robotics and biomedical engineering in the present world [4]. As a result of these researches, prosthetics with intelligent controlling techniques were developed. Most prosthetics use surface electromyography (sEMG) signals from the amputee's body to control the prosthesis device [5-6]. The facts mentioned above motivated to design of an sEMG pattern identification and classification methodology to control prosthetic devices.
Feature exaction and classification are the key concepts for processing and analyzing biomedical signals. Using accurate and computationally efficient classifying of the sEMG signals patterns, considerable research was concentrated in recent years, and various mathematical concepts were developed [7-8].
There are many mathematical methods to analyze signals. The frequency content is determined by using Fourier Transforms(FT). It is one of the main aspects of the feature exaction of signal processing [9]. Due to the non-stationary nature of the sEMG signal, obtaining the frequency component is not sufficient for analyzing the signals. This effect is because the FT loses time after transforming the time domain to a frequency domain signal [10]. Here, Fourier transformed is a based line for frequency domain information extraction. We expected the trained neural network for frequency information extracted from the highly compact signal burst in the time domain. However, with wavelet transformed, we can extend this high quality feature with very high accuracy since most cardio signal burst looks similar in the time domain. Therefore, it needs a method to analyze the signals without losing time when it converts to the frequency domain. This paper introduced a novel and robust algorithm to feature exaction based on Wavelet Transform(WT) and classification based on Artificial Neural Networks(ANN). The acquired sEMG signal was decomposed using CWT by scaling five times for better time-scale resolution. Filter design plays an essential role in capturing the sEMG signal in the signal acquisition step for exaction of the features and classification [12,13].
Primary research objectives include designing a low-cost body support system for disabled people. Further, The design system must help simulate body movements for disabled parts of a human body utilizing existing functioning parts in other body areas. During the design phase of this workout, we have been focused on identifying a suitable method for high-quality feature extraction from electrical signals produced by cardio activity produced by mechanical movements. Also, we have been given priority for proper system interfacing, as we have designed filters for a meager cost electronic system. In this stage of development, we expected an accuracy of more than 75% for feature extraction and neural network training. However, the proposed system is still influenced by a few noises. This can be overcome by advancing its noise filtering ability over the working environment of this system.
2. Background
FT is a powerful tool used in engineering and science, which transforms a signal from the continuous-time domain to the continuous frequency domain and vice versa and can be applied for periodic and aperiodic signals. Even though, a serious drawback arises when transforming a signal using FT. When transforming a signal to the frequency domain, time information will be lost. When looking at an FT of a signal, it is impossible to emphasize when a particular event took place [11], [12], [14].
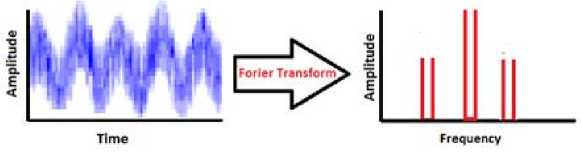
Fig.1. Time-domain to the frequency domain
To analyze the signal in time-frequency joint representation, it is needed to divide the signal into several parts. Then analysis can be done quickly to the separate parts of the signal. This method provides good information about when and where the different frequency components exist in the signal. But the most important and challenging thing is identifying the dividing point of the signal and selecting it for the analysis properly. A short time window can be used to separate the signal into parts. The time, frequency, and time resolution depends on the size of the window. Therefore, it is important to select a suitable window size to analyze the signal properly [15].
As a solution for the above issue in signal processing, Short Time Fourier Transform (STFT) was proposed by Gabour in 1946 [15]. It was the earliest time-frequency representation of the signal. The FT was computed, and a sliding temporal window was used to generate two-dimensional representations. It may examine how the signal's frequency varies over time using the STFT.
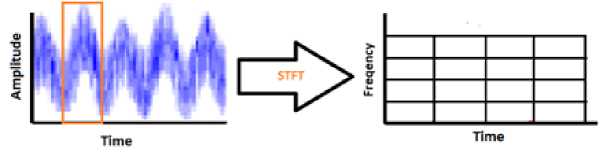
Fig.2. Time-domain to Time-frequency using STFT
The signal information can be obtained from that window, and its resolution depends on the size of the window. The narrow windows have good time resolutions. But its frequency resolution is poor because of its narrow size. The wide window has a good frequency resolution. But its time resolution is poor. Another drawback of STFT is assuming the signal is stationary within the window size. FT and STFT are efficient tools for global analysis of signals but not efficient for local analysis of the signals. STFT may have high time resolution or good frequency resolution, but not both at the same time. This issue is linked to Heisenberg's principle of uncertainty. [15].
According to Heisenberg's uncertainty principle, knowing the precise frequency and time of occurrence of this frequency in a signal is impossible. Another way, a signal cannot be described as a single point in time-frequency space. The uncertainty principle demonstrates the significance of signal separation. [15,16].
WT is one of the best transform techniques used as a powerful tool rather than FT and STFT in non-stationary signal processing. Its advantage, rather than other signal processing techniques, is, it facilitates the local analysis of signals using shifting and scaling operations. It decomposes the desired input signal into a collection of basic waveforms known as "wavelets." It allows you to examine these wavelets' coefficients (or weights) to evaluate the signal [12,14].
-
2.1 . Wavelet Transform and sEMG signal processing using Wavelet Transform
The physical meaning of WT is nothing. Nonetheless, it's a wavelike oscillation that, in a way, is confined, rises from zero to maximum amplitude, then drops and returns to zero. Because the structural functions were generated by scaling and translating the mother function, WT helps separate scale information while retaining some degree of time or spatial locality; time-scale wavelets are especially suitable for studying fractal fields. WT is defined as a convolution sum between the signal and wavelet function. Wavelet analysis used two types of functions, the scaling (□) function, and the wavelet (ψ) function. All waves cannot be defined as wavelets. Wavelets need to satisfy the number of conditions mentioned below [14,17,18].
A wavelet (v) is in L2 (B) , and it has other equivalent mathematical conditions.
Those are,
О|Фи,Х0|Гс^ < «(1)
L+<>u,s(t)|dt = 0
i^-■■ d_--,(3)
J-а |ш|
Ф и , х (<я) Is the FT of ф и , х (t) And the third equation is called the admissibility condition.
ф u , s (t)This is dilated with a scale parameter s and translated by u:
ФиДО^Фрт)(4)
The WT of a signal f ( t ) can be written as
W f(u, s) = £ fm ^ ф* (^dt(5)
DWT can be obtained by critically sampling CWT. Its integer translates are orthogonal to the scaling function. At low scales, the scaling function spans subspaces nested inside those covered at higher scales.
Pj,k(x) = 21/2
Vj = span{pj,k(x)'}(7)
V - a c^V —i cV o cV i C^V a
Wavelet function fills up the gap between two adjacent scaling subspaces.
^j,k(x) = 2j/2^(2jx - к)
Wj = span{^j,k(x)}
V+i = Vj Ф Wj(10)
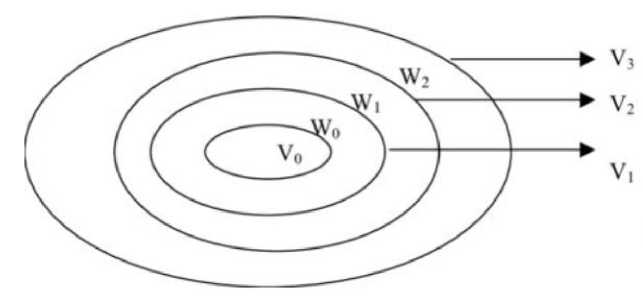
Fig.3. Scaling subspaces and Wavelet subspaces
Table 1. Scaling and wavelet bases behaviour
|
Functions |
Spaces |
Bases |
j |
7 ^ |
|
|
Approximations |
Scaling function 95 |
vi |
{^ Кег |
Coarser |
Finer |
|
Details |
Wavelet ^ |
wi |
{^Л Lez |
In the scaling function, j is fixed, and it gives that time localization of the signal, and the wavelet function gives both resolution and time information. There are different kinds of wavelets, and the choice of wavelets depends on the "family," and the application of the signal one is trying to analyze [13,19].
Table 2. Wavelet Families
|
Wavelet Families |
Description |
|
Morlet (morl) |
This wavelet is explicit but does not have a scaling function. |
|
Mexican Hat (mexh) |
This wavelet has a scale function and is generated from a Gaussian second derivative function proportional function. |
|
Meyar (meyr) |
The frequency domain is used to define the scaling function. |
|
Haar(haar) |
Discontinuous and resembles a step function. Haar represent as Daubechies db1. |
|
Daubecheis(dbN) |
One of the brightest stars in wavelet research. |
|
Symlets(symN) |
This wavelet is a modification to the db family. |
|
Spilinebiorthogonal wavelets (biorNr.Nd) |
This wavelet needed two wavelets for signal and image reconstruction. |
The selection of the Wavelet basis function and the method of feature exaction is essential in this research. The selection of wavelet basis depends on the application. According to most research, the Daubechies (Db) wavelet family is the best appropriate wavelet for sEMG signal processing. In this research, Daubechies wavelets, Db4 was used [20], [21].
2.2 Artificial neural network and neural classifier
3. Methodology
A neural network comprises units, or neurons, that are organized in layers that convert an input vector into an output vector. Every unit receives an input, performs a function, and then sends the output to the next layer. Typically, networks are designed as feed-forward, with each unit feeding its output to all units on the next tier but no feedback to the preceding layer. From input to output, signals in feed-forward ANNs can only go one way. Because no layer affects the same layer, there is no feedback to output. [22-24].
The neural network inputs are the features exacted using wavelet transform, feed to train the neural network. The network has an input layer that uses to receive the wavelet features.
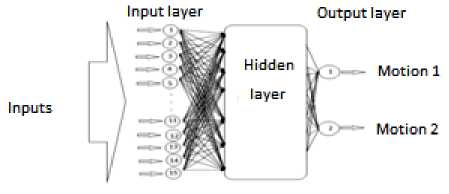
Fig.4. Neural network architecture
Applying conductive components or electrodes to the skin surface or invasively inside the muscle may be used to assess EMG. The most frequent measuring technique is sEMG, which is non-invasive and may be performed by nonmedical people with little danger to the patient. The sEMG amplitude ranges from a few microvolts to a few milivolts. Measurements of sEMG depend on several factors such as intensity of muscle contraction, distances of the electrode from the active muscles, properties of the overlying tissue, electrode and amplifier properties, and quality of contact between the electrode and the skin [25-26].
The raw signal includes essential information in a format that is not easily accessible. On the other hand, this information can only be turned into valuable data if it is quantified using signal processing techniques to produce precise and relevant structures in the data that can be used for tasks like pattern categorization. Data acquisition, Feature selection, Feature exaction, and pattern classification are the four stages of sEMG signal processing, which are explained below.
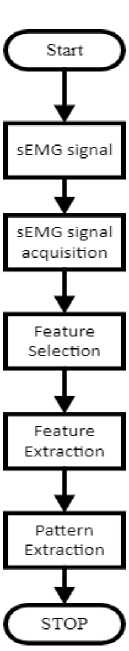
Fig. 5: Block diagram of the system
-
3.1 Data acquisition
For noise filtering of the signal, active high pass, active low pass, and notch filter were used after the preamplifier output signal. There are many active filter responses: Butterworth, Bessel, and Chebyshev. The responses of those filters are different, and the use of the appropriate filter type depends on the application. By considering the maximum flat response of the filer, active Butterworth filter architecture was used with Sallen-key topology [27-28]. Okawa electric design tool was used to design the filters [29].
In filtering, step 20Hz high pass and 500Hz bandpass active Butterworth filters were used in Sallen-key architecture. 50Hz twin T notch filter was used to eliminate the power line interference. The fourth-order high pass filter was designed by cascading two second-order fitters.
Cut-off frequency,
f = --- . 1
1 c 2T^R 1 C 1 R2C2
The transfer function of the filter,
u out(s) _ Gs2
^ in(s) s2+2^ ( 2^/c)s+(2^/c)2
Q-Quality factor and G-Gain,
Q = —
Q 2?
G =
R 3 +R 4
R 3
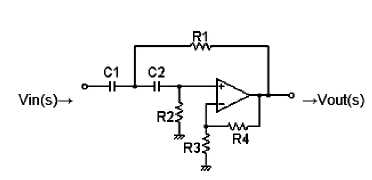
Fig.6. 2ndorder Sallen-key high-pass filter topology
To obtain the Butter-worth response of the fourth-order filter output, the gain of the first stage was set to 1.152, and the damping ratio was 0.924, and in the second stage of filter, the gain was set to 2.235, and the damping ratio was 0.3825.
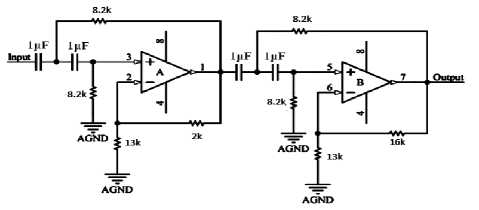
Fig.7. 4th order Butterworth high pass active filter
In designing the second-order active low-pass filter, the gain was set to 1.586, and the damping ratio was 0.707 for the Butterworth Sallen-key filter response.
Cut off frequency, fc =
2 ^V R 1 C 1 R 2 C 2
The transfer function of the filter,
^ out(s) G(2Kfc)2
V in(s) s2+2^ ( 2Hf c ) s+(2Hf c ) 2
Q-Quality factor and G-Gain,
Q = —
Q 2?
G =
5+5 4 R 3
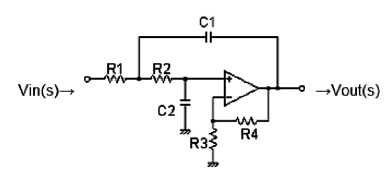
Fig.8. 2nd orderSallen key low pass filter topology
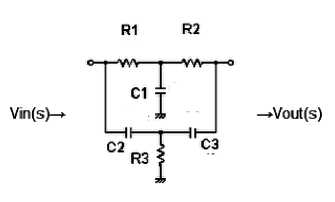
Fig. 9. Twin T notch filter topology
A Twin T notch filter was used to eliminate the 50Hz noise from the sEMG signal. The notch filter's response is characterized by a low degree of attenuation away from the notch frequency. The degree of attenuation increases as signals approach the notch frequency, resulting in the characteristic notch filter response. Theoretically, the level of attenuation provided by the Twin T notch filter at the notch frequency is infinite.
Center rejection frequency of notch filter, fo =
-1 [ 2^'
C3 C 2 ^ 1 5 1 5 2
f o =
-1 2"^
С2С з Я з (Я1+Я2)
-
3.2 Data collection and feature selection of sEMG signal
To achieve correct pattern recognition, the methodology for collecting sEMG signals is crucial. Only one person was selected as a subject to collect the data. One subject with a healthy left forearm was taken for this study. When the wrist moved in various motions, signals were gathered. For one movement, collected 60 sets of trials in one experimental test.
RMS value of the signals, mean frequency, and median frequency is selected as the features to exact from signals decomposed to various scales using CWT because many researchers used those features in their research [30,31]. The RMS value provides a proper measurement of the signal power or amplitude. The mean and median frequencies are two valid signal power spectrum measures. The average of all frequencies in the power spectrum is the mean frequency. The frequency had 50%, or half of the frequency distribution on either side is the median frequency.
As mentioned above, feature selection was aimed to determine the RMS values of the signals, mean and median frequencies from the average power spectrum for each signal at different scales of CWT.
RMS =
Where:
RMS: Root Mean Square, A ( : Amplitude in Ith sample, n: Total number of samples.
^^й n
A i
Where:
F: Mean Frequency
И 2
p _ ^i=0 f i A i
F = УИ a2
^i=0 Ai fl: Frequency in Ith sample Al: Amplitude in Ith the sample, n: Total number of samples.
The selection of the Wavelet basis function and the method of feature exaction is essential in this research. The selection of wavelet basis depends on the application. Most studies of the sEMG analysis have concluded that the Daubechies (Db) wavelet family is the most suitable wavelet for sEMG signal analysis. In this research, Daubechies wavelets, Db4, were used [20,21].
4. Testing Results
Responses of conceptually designed filters are simulated using MATLAB software [32]. We used MATLAB Simulink toolbox for a neural network trying purposes. The design system has been interfaced with a laptop to test the neural network accuracy for many similar mechanical movements producing cardio signals. Therefore, we have received successful mechanical movement identification through test results. Furthermore, we have been attached result categorization coloring graphs provided by the MATLAB software interface to concrete the pieces of evidence. The executable model was implemented by using the transfer functions of filters. The following figure shows the cascading filter's response before and after applying the notch filter. Figure A shows the wideband filter response without a twin T notch filter, and figure B shows the wideband filter response with a twin T notch filter.
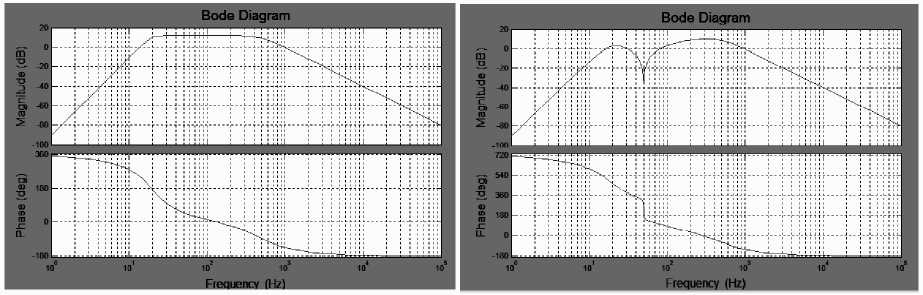
(A)
(B)
Fig.10. Filter response without notch filter and with notch filter
Simulated filters in MATLAB software were implemented using appropriate component values, designed 20 to 500 Hz signal filters with rejecting 50 Hz line interference. Considering the above characteristics of filters, 20 Hz to 500 Hz wide bandpass filter was implemented by cascading the High-pass filter, notch filter, and low-pass filter one by one.
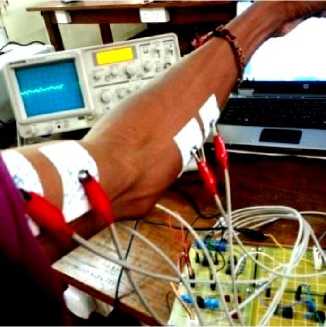
Fig. 11. Experimenting with filter circuits
They used the serial interface connection, sent the sEMG signal to MATLAB, plotted the signal in real-time, and collected data in an Excel table. The output of the sEMG acquisition circuit was connected to the Arduino Uno microcontroller board, and the signal was sent to MATLAB software by using serial communication. The Arduino platform is so popular that even companies such as Math Works, which produces MATLAB, have developed software to support it. MATLAB Arduino support package was used to connect the Arduino to MATLAB.
-
4.1 Feature Exaction Results
Feature exaction and selection play an essential role in classifying the sEMG signal. In this step, a Continuous wavelet transform was selected to exact the features from signals in five different scales. Five different scales used here are areas 8, 16, 32, 64, and 128. The exaction of lower scales contains high-frequency details, and the high scale component consists of low-frequency details of the signal [33].
Table 3. Sample data set of exacted features in one trial
|
Scales |
Median frequency (Hz) |
Mean frequency (Hz) |
RMS (mV) |
|
8 |
58 |
72.3893 |
1.7730 |
|
16 |
57 |
57.2386 |
2.9534 |
|
32 |
24 |
24.7210 |
0.3189 |
|
64 |
12 |
11.2593 |
0.3004 |
|
128 |
8 |
7.3936 |
0.1334 |
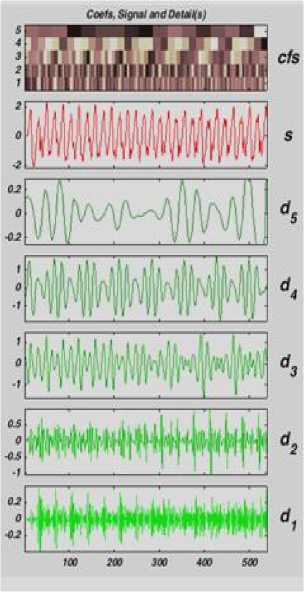
Fig.12. Signal decompose by using Daubechies wavelets
In this research, two sets of feature values were collected for two motions of the wrist arm. These features are the inputs for a neural network pattern classifier. Table 4 shows the tabulation procedure of collecting the feature values in one motion.
Table 4. Collection of feature values in all trials of one motion
|
FEATURE |
TRIAL 01 |
TRIAL 02 |
TRIAL 03 |
TRIAL 04 |
…… |
TRIAL 60 |
|
MEDIAN FREQUENCY |
57 |
87 |
58 |
60 |
57 |
|
|
57 |
58 |
58 |
59 |
56 |
||
|
27 |
18 |
20 |
20 |
27 |
||
|
12 |
14 |
12 |
11 |
13 |
||
|
8 |
8 |
8 |
9 |
8 |
||
|
MEAN FREQUENCY |
57.4457 |
87.0235 |
67.18 |
72.8396 |
68.7243 |
|
|
56.829 |
58.296 |
57.7634 |
59.0348 |
56.3247 |
||
|
27.6857 |
17.8358 |
19.9665 |
18.9003 |
19.8745 |
||
|
11.9555 |
13.8307 |
11.7706 |
10.9299 |
12.3211 |
||
|
7.3194 |
8.3437 |
7.7505 |
8.9669 |
7.5432 |
|
RMS VALUE |
1.636 |
1.3753 |
2.1477 |
2.7375 |
2.3124 |
|
|
3.36 |
1.9293 |
3.6234 |
4.1308 |
3.1239 |
||
|
0.8231 |
0.2914 |
0.4306 |
0.3893 |
0.4398 |
||
|
0.6057 |
0.3695 |
0.5454 |
0.7071 |
0.4765 |
||
|
0.2901 |
0.1263 |
0.2089 |
0.2874 |
0.2983 |
4.2 Pattern classification results
The ANN was utilized to categorize the raw signal and the signal after Wavelet Transform decomposition. It was created with the help of the MATLAB software program [34]. The network has one input layer (15 neurons), one hidden layer (25 neurons), and one output layer (2 neurons). All hidden nodes and the output layers used the sigmoid function as their threshold function. As a first step, the signals were decomposed using a continuous wavelet described earlier. Features were obtained by using the decomposed signals. The reason for choosing these levels because the critical frequency range of the SEMG (20 – 500 Hz) is covered by this range for the given sampling rate. The CWT was implemented using MATLAB's Wavelet Toolbox. Daubechies wavelet function is used here, which was explained earlier.
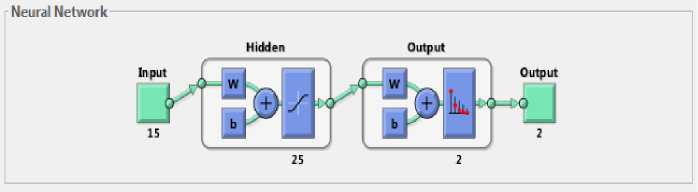
Fig.13. ANN building block in MATLAB GUI
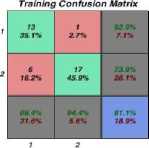
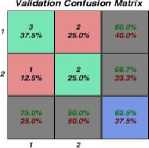
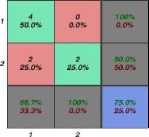
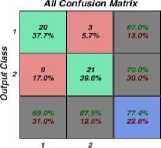
The ANN was trained for the wavelet coefficients for each of the levels of resolution. The network was trained using the MATLAB toolbox's feed-forward backpropagation training algorithm [34]. The confusion matrices for training, testing, and validation are shown in the figure below, and the three types of data are merged. The total accuracies are shown in the bottom right blue squares. If there are a large number of right answers in the green squares and a small number of erroneous responses in the red squares, the network outputs may be highly accurate.
Target Class
Target Class
Test Confusion Matrix
Target Class
Target Class
Fig.14. MATLAB figure showing training, validation, test, and all confusion matrixes for ANN
The confusion matrix result shows the system's training, validation, testing, and overall accuracy. According to these preliminary results, the overall accuracy of the pattern classification system is 77.4%. The pattern classification accuracy depends on many design factors used to implement the classifier. Otherwise, it can be concluded that the classification efficiency will increase if the network is provided with enriched EMG signals. A good classification can be obtained in that situation, leading to a suitable human-computer interaction.
5. Conclusions
This research's scope mainly covers three areas: the study of neuromuscular behavior of the human arm and designs of a signal acquisition circuit, selection and uses of the feature exaction, and finally, the design of a pattern classification system. Considering the characteristics of sEMG signals, wavelet transform was applied to the feature exaction step. There were some difficulties in capturing the sEMG signals due to noises and power line interference. Therefore it have to use filter circuits properly to acquire the row sEMG. During the experiment, data were collected for two hand movements and filtered the data. These data were exacted the features using wavelet transform, and those features were used to train an ANN to classify the patterns and overall accuracy of the pattern classification system was 77.4%.
After completing design, the system is implemented using the harwares, wavelet IC, Neural IC, and other components. TMS320C55x is a commercially used wavelet IC, and CM1K chip is a commercially used neural IC with 1024 neurons.Finally , the designed system was tested with many hand-movements and working accurately.
References Surface Electromyography Signal Acquisition and Classification Using Artificial Neural Networks (ANN)
- G Dr. S.I. Keethaponchalan, "Rehabilitation and reintegration of former rebels for sustainable peace in Sri Lanka: Postwar challenges," Depatmant of political science and public policy, University of Colombo, Economic review, Oct/Nov2004.
- Christ Lake, "Upper limb prosthetics: Using evidence-based practice to enhance patient care experiences," The academy Today, Supplement of the O & P EDGE, September 2011.
- D.G. Smith, W. Michael & J.H. Bowker, "Atlas of amputation and limb deficiencies-surgical, prosthetic and rehabilitation principles," American academy of orthopedic surgeons, 2004.
- Parker P., Englehart K., Hudgins B., "Myoelectric signal processing for control of powered limb prostheses," Journal of electromyography and kinesiology: official journal of the International Society of Electrophysiological Kinesiology, 2006, Volume 16, Issue 6, pp. 541–548.
- Erik Scheme, Kevin Englehart, "Electromyogram pattern recognition for control of powered Upper-limb prosthesis: State of the art and challanges for clinical use", Journal of Rehabilitation research &Develpoment,Volume 48, November 2011, pp. 643-660.
- SilvesterMicera, Jacopo Carpaneto&StanisaRaspopovic,, "Control of hand prosthesis using peripheral information",IEEE reviews in biomedical Engineering, Volume 03, 2010, pp.48-68.
- Buchenrieder K., "Processing of Myoelectric Signals by Feature Selection and Dimensionality Reduction for the Control of Powered Upper-Limb Prostheses", Computer Aided Systems Theory – EUROCAST 2007, Lecture Notes in Computer Science, 2007, Volume 4739/2007, pp. 1057–1065
- M. Oskoei and H. Hu, "Myoelectric control systems—A survey," Biomed. Signal Proc. Contr. J., volume 2, pp. 275–294, 2007.
- S. Karlsson, J. Yu, M. Akay, Time–frequency analysis of myoelectric signals during dynamic contractions: a comparative study, IEEE Trans. Biomed. Eng. 47 (2) (2000) 228–238.
- Gulshan, RuchikaThukral, Manmohan Singh, "Analysis of EMG signals based on Wavelet transform- A review", Journal of Emerging technologies and innovative research, July 2015, Volume 2, pp. 3132- 3135.
- J. Kilby, K. Prasad, "Continuous Wavelet Analysis," International Journal of Computer and Electrical Engineering, Volume 5, February 2013, pp 30 – 35.
- David Ozog, "Signal Analysis," May 2007, https://www.whitman.edu/Documents/Academics/Mathematics/ozogdm.pdf
- NebrasHussainGheab, SadeelSaleem, "Comparison study of Electromyography Using Wavelet and neural network," Al- Khwarizmi Engineering Journal, 2008, Volume 04, No. 03, pp 108-119.
- M.W.P Maduranga, Ruvan Abeysekera, "TreeLoc: An Ensemble Learning-based Approach for Range BasedIndoor Localization," Int. Journal of Wireless and Microwave Technologies, Vol.11, No.5, pp. 18-25, 2021.DOI: 10.5815/ijwmt.2021.05.03
- M.Sifuzzaman, M.R. Islam and M.Z. Ali, "Application of Wavelet Transform and its Advantages Compared to Fourier Transform," Journal of Physical Sciences, 2009, Volume 13, pp121-134.
- RobiPolikar, The Wavelet Tutorial, http://users.rowan.edu/polikar/WAVELETS/WTpart1.html
- Elin Johansson, "Wavelet theory and some of its applications," Licentiate thesis, Department of Mathematics, Lulia University of Technology, ISSN 1402- 1757
- O. Riolu and M. Vetterli, ``Wavelets and Signal Processing,'' IEEE Signal Processing Magazine, October 1991, Volume 8, pp 14-38.
- Michael weeks, 'Digital Signal Processing using Matlab and Wavelets', 2nd edition
- Nimrod Peleg, "The history and Families of wavelets," December 2000, http://cs.haifa.ac.il/nimrod/Compression/Wavelets/w3families2000.pdf
- Cedric Vonesch, Thierry Blu, Micheal Unser, "Generalized Daubechies Wavelet Families," IEEE transactions on signal processing, Volume 55, September 2007, pp 4415- 4429.
- Eason, B. Noble, and I. N. Sneddon, “On certain integrals of Lipschitz-Hankel type involving products of Bessel functions,” Phil. Trans. Roy. Soc. London, vol. A247, pp. 529–551, April 1955.
- J. Clerk Maxwell, A Treatise on Electricity and Magnetism, 3rd ed., vol. 2. Oxford: Clarendon, 1892, pp.68–73.
- I. S. Jacobs and C. P. Bean, “Fine particles, thin films, and exchange anisotropy,” in Magnetism, vol. III, G. T. Rado and H. Suhl, Eds. New York: Academic, 1963, pp. 271–350.
- A.Phinyomark, A. Nuidod, P. Phukpattaranont, C. Limsakul, "Feature exaction and reduction of wavelet transform coefficients for EMG pattern classification," Electrical and electronic engineering, Signal Technology, 2012, No. 6, pp 27- 32.
- Johan Borglin, "Classification of hand movements using multi-channel EMG," Master's thesis in Biomedical Engineering, http://publications.lib.chalmers.se/records/fulltext/159500.pdf
- Wu Ping, BaoJia-li, Xia Qiang, I.C. Bruce, "The use of artificial neural networks in the Motor Program," 26thAnual International Conference of the IEEE EMBS, San Francisco, 2004, pp 4611- 4613.
- Bassant M., Elbagoury, Thomas Schrader, Meteb M., "Design of Neural network for Rehabilitation Robotics," International Conference on Circuits, Systems and control, ISBN 978-1-61804, pp 89-95.
- Dr. Scott Day, "Important Factors in Surface EMG Measurement," Bortech biomedical, Calgary, www.bortec.ca.
- C.J.D.Luca, "The use of electromyography in Biomechanics," Journal of Applied biomechanics, 1997, volume 13, pp. 135-163.
- Thomas Kugelstadt, "Active filter design techniques," Op amps for everyone, Texas Instruments. https://focus.ti.com/lit/ml/slo088/sloa088.pdf
- Gianluca De Luca, "Fundamental Concepts in EMG signal Acquisition", DelsisInc, March 2003, Rev. 2.1
- Ogawa electrical design, "Filter design and analysis," http://sim.okawa-denshi.jp/en/Fkeisan.htm
- Rubana H. Chowdhury, Mamun B. I. Reaz, MohdAlauddin Bin Mohd Ali, "Surface Electromyography Signal Processing and Classification Techniques", Sensors 2013, pp 12431-12466.
- AngkoonPhiniomark, SirineeThongpanja, Huosheng Hu, "The usefulness of Mean and Median frequencies in Electromyography Analysis", Open access chapter, Instech. http://dx.doi.org/10.5772/50639
- Y. S. P. Weerasinghe, M. W. P. Maduranga and M. B. Dissanayake, "RSSI and Feed Forward Neural Network (FFNN) Based Indoor Localization in WSN," 2019 National Information Technology Conference (NITC), 2019, pp. 35-40, doi: 10.1109/NITC48475.2019.9114515.
- Matlab wavelet toolbox http://www.ltu.se/cms_fs/1.51590!/wavelet%20toolbox%204%20user's%20guide%20(larger%20 selection).pdf
- Matlab neural network tool box. http://www.image.ece.ntua.gr/courses_static/nn/matlab/nnet.pdf
