Sustainable development in Russia's northern regions: labor dimension

Author: Fauzer Victor V., Smirnov Andrei V., Lytkina Tatyana S., Fauzer Galina N.
Journal: Economic and Social Changes: Facts, Trends, Forecast @volnc-esc-en
Section: Regional economy
Article in issue: 5 (59) т.11, 2018.
Free access
The article points out that sustainable development is not the ultimate goal, but a dynamic process of adaptation, cognition and activity. We show that the transition to sustainable development is preconditioned by historical circumstances; we reveal the chronology of the concepts of sustainable development from the Brundtland Report to the 2030 Agenda. We analyze six international systems of sustainable development indicators; each of the systems contains social-labor indicators and indicators of living standards. We emphasize that the common disadvantage of all the systems is that their indicators are poorly adapted to Russian statistics. We consider it important to establish a set of labor indicators and develop a methodology to assess sustainable development. The novelty of our research lies in fact that we use our own approach to the assessment of sustainable development with the use of labor indicators. Labor stability is estimated according to four factors that include twelve labor indicators...
Northern regions, sustainable development, labor indicators, labor stability
Short address: https://sciup.org/147224088
IDR: 147224088 | UDC: 332.14(470.1/.2+571) | DOI: 10.15838/esc.2018.5.59.8
Text of the scientific article Sustainable development in Russia's northern regions: labor dimension
The problem of sustainable development of civilizations, societies, countries, and peoples was considered by ancient thinkers and our contemporaries, representatives of different branches of knowledge. In the modern sense, sustainable development comes to the fore due to a number of circumstances.
The first one is a report The Limits to Growth (1972) prepared by the Club of Rome. The authors of the study concluded that if the current trends of world population growth, industrialization, environmental pollution, food production and resource depletion remain unchanged, then the limits to growth on our planet will be reached within the next 100 years.
The second one is a report Our Common Future1 prepared by the UN World Commission on Environment and Development. It has expanded the concept of sustainable development beyond environmental issues to include the study and assessment of social aspects at the national and international level. The report for the first time introduced the basic formulation: “Sustainable development is development that meets the needs of the present without compromising the ability of future generations to meet their own needs”. It contains the key idea of sustainable development as a balance between generations.
The third one is the UN conference in Rio de Janeiro (1992), with the help of which the study and assessment of sustainable development was launched on a planetary scale. It defined 27 principles of conduct for the world community in the field of environmental protection and development2.
The fourth circumstance includes two important UN documents: the Millennium Declaration (2000) that contains eight development goals to be achieved up to 2015 and 21 targets3, and the document entitled Transforming our World: the 2030 Agenda for Sustainable Development , which defined 17 goals and 169 targets for sustainable development. Many of the goals are closely linked to labor processes, such as poverty eradication, hunger eradication, good health and well-being, quality education, gender equality, decent work and economic growth, and reducing inequality4.
Russia, like the rest of the world community, supports sustainable development principles; it is reflected in the presidential decree “On the concept of transition of the Russian Federation to sustainable development” (1996). The concept notes that Russia’s transition to sustainable development is possible only if the sustainable development of all its regions is ensured5.
In the context of the above documents, sustainable development (SD) should be understood not as an end goal, but as a dynamic process of adaptation, learning, and action. It is the process of identifying, exploring and using the relationships – especially those that exist between the economy, society, and natural environment. It is important to define a set of indicators and develop a methodology for assessing sustainable development.
Russian scientific literature contains a number of works reflecting the features and importance of application of sustainable development principles. Such works include [1; 2; 3; 4]. They describe in sufficient detail the theoretical and methodological issues of sustainable development and methodological approaches to the concept of “sustainability”. However, no one assessed sustainable development of territories on the basis of labor indicators alone. We know only one such work by K. van Treeck. It proposes to assess sustainable development from the perspective of labor factors. The approach is to estimate the share of employment income in gross domestic product, that is, the share of income related to labor. The indicator aims to achieve a goal of sustainable development – “decent work for all”. High-income work is seen as a way out of poverty and a means to reduce income inequality. However, this approach has its drawbacks. It considers sustainability only from a single perspective and ignores the sectoral structure of employment, gender inequality, and many other important drivers of sustainability [5].
The goal of our paper is to offer a methodology for assessing sustainable development of the northern regions on the basis of labor indicators.
The object of our covers 13 regions that are officially defined as regions of the Far North and areas equated to them.
The subject of the study is the assessment of the degree of labor stability in the northern regions with the allocation of critical, low, medium and high degrees.
Information base consists of the data of the Federal State Statistics Service of Russia (Rosstat) for 2000–2015 and the results of an expert survey in 2017. We chose the year 2000 as the base year, since there is no complete information on the selected labor indicators for the previous years.
We provide the results of ranking the northern regions according to the level of sustainable development on the basis of labor indicators.
Sustainable development indicators
Agenda 21, a UN action plan, encourages all countries and international organizations to develop the concept of sustainable development indicators (SDI). And the coordination of activities for the wide use of SDI should be carried out under the leadership of the United Nations Statistics Division, since this Division accumulates new experience in this sphere6. The first set of indicators for sustainable development goals was recommended by the UN Commission on Sustainable Development (UNCSD) in 1993 and included 132 indicators7. It was first published in 1995. Subsequently, this set was revised in 2001 and 2006. The set of indicators proposed by UNCSD is not mandatory and is not based on a single statistical database. It is intended to provide a common starting point to work out national sets of sustainable development indicators8.
World experience in the development of SDI has shown that there are two approaches to their construction. The first approach is to build a system of indicators, each of which reflects different aspects of SD. Most often, the environmental, economic, social, and institutional subsystems of indicators are singled out within the framework of the common system. According to the recommendations of the Conference of European Statisticians (CES), the measurement system can be based on conceptual thinking, scientific literature and theoretical ideas about “sustainability”, “development”, preservation of the object’s sustainability, etc. The set of SDI can also be designed to assess areas that are considered most important for policy makers and other stakeholders.
The second approach is related to the construction of an integral, aggregated indicator, on the basis of which it is possible to judge the degree of sustainability of socioeconomic development. The aggregation is usually done on the basis of three groups of indicators: environmental and economic, ecological and socio-economic, and environmental [6, p. 128]. In addition to indicators, satellite accounts are used (they are the tools for additional analysis of certain important aspects of economic and social development of society based on the approach of the system of national accounts) are used to assess sustainable development.
Comprehensive indicators developed in the 1990s by a number of economists were based on the results of the work initiated in the 1960s and the 1970s; they include such indicators as the index of sustainable economic welfare [7] genuine progress indicator [8], the index of economic well-being [9], true savings [10], and sustainable net benefit index [11].
During this period, other complex indicators emerged. The telling example is the Human Development Index (HDI), which is published annually by the United Nations Development Program (UNDP) and is calculated as a weighted average of economic, educational and health indicators. Another important indicator that appeared during this period is Ecological Footprint, which characterizes the area of biologically productive territory and water area necessary for the production of resources used by people and for the absorption of waste [12]. Other examples of complex indicators are the happy planet Index (international happiness index), the sustainable society index, and the Living Planet Index (LPI).
There are indicators that became known in the 1990s and 2000s and are based on the measurement of people’s subjective well-being. These indicators are calculated on the basis of estimates of people’s satisfaction with their lives or their feelings about recent events in their lives [13]. Although such subjective assessments have been discussed by economists since the early 1970s [14], this area has received a significant impetus to development in the latest decade [15; 16].
Since the mid-1990s, an increasing number of national statistical offices and international organizations have been using sets of indicators to assess sustainable development. When such an approach is used, then the multidimensional nature of sustainable development is not limited to a single assessment, but is represented by a wide range of indicators that provide information on various aspects of sustainable development. An important criterion for selecting SD indicators is their compliance with the quality standards of official statistics9.
Labor factors in the assessment of sustainable development are usually considered within the social unit of system indicators of sustainable development either in individual studies of social sustainability, that is, the studies in which the emphasis is placed on social rather than economic and environmental pillars of sustainable development. Different theoretical approaches to social sustainability highlight different indicators [17, p. 46]. Thus, the theories of justice are aimed at measuring different types of inequality: territorial, sectoral, gender, intergenerational, etc. Proponents of the capital approach measure human, labor and social capital indicators: qualitative characteristics of the population, investments in knowledge, skills and health, and the measures of social cohesion. Proponents of the institutional theory use indicators of the functioning of social institutions. Researchers studying corporate relations use indicators of corporate social responsibility.
In the first set (1993), all indicators are divided into three categories according to their target orientation: indicators that are a driving force that characterizes human activities, processes and characteristics that affect sustainable development; indicators of the state that characterize the current state of various aspects of sustainable development; response indicators that allow for a political or other kind of response to change the current state.
The group of social indicators included in the combating poverty block contains labor indicators: employment growth rate (%); ratio of average female wage to male wage; population living in absolute poverty (%); and ratio of income of the richest to the poorest. In other blocks, we can also point out indicators related to labor: women per 100 men in the labor force; ratio of income to residential rental payment; proportion of the undernourished (%) [18, pp. 9-15].
In 2007, the UN publishes a report headlined Indicators of Sustainable Development : Guidelines and Methodologies , which contains two blocks with a set of labor indicators. The Poverty block includes the following indicators: proportion of population living below national poverty line; proportion of population below 1 USD per day; the ratio of share in national income of highest and lowest quintile. The Employment block includes employment-to-population ratio; vulnerable employment; labor productivity and unit labor cost; share of women in wage employment in the non-agricultural sector10.
Since 2008, the official list of indicators of the Millennium Development Goals in the framework of the UN Millennium Declaration has been in force. The indicators for monitoring the progress include labor indicators: GDP growth per employed person; employment rate; proportion of employed population below 1.25 USD per day (PPP values); proportion of contributing family workers and own-account workers in employed population. Poverty eradication indicators include: proportion of the population with an income of less than 1.25 USD per day at purchasing power parity; poverty rate (the share of the poor and the extent of poverty); and the share of the poorest 20% in the structure of consumption. Labor indicators can include gender equality indicators such as the share of women in wage employment in the non-agricultural sector; and the proportion of seats held by women in national parliament11.
The Conference of European Statisticians (CES) made a significant contribution to the development of SDI. It proposed three sets of indicators: a large set based on a conceptual classification (60 indicators), a large set based on a thematic classification (90 indicators), and a small set based on a thematic classification (24 indicators)12. The Organization for Economic Cooperation and Development (OECD) has developed a system of 131 indicators that measure positions of Western countries in achieving these goals13. There are many other systems of indicators developed by different agencies.
The set of SDI in Russia is approved by the Resolution of the Government of the Russian Federation according to which the federal plan of statistical works is supplemented with the subsection “Indicators for achieving sustainable development goals of the Russian Federation”. The sub-section includes 90 indicators for achieving sustainable development goals in Russia14.
For the purposes of comparative analysis at the intergovernmental and domestic levels, all indicators must meet certain criteria:
-
1. Compliance with sustainable development goals . Each set of indicators should reflect all the most significant aspects of development of the labor market in a country or territory and should be related to sustainable development. Labor indicators should describe income, level and structure of employment, as well as other important characteristics of social and labor relations.
-
2. Non-redundancy. The set of labor indicators should correspond to the methodological principle of W. Occam: “Entities are not to be multiplied beyond necessity”. Indicators should not duplicate the meaning of each other and characterize the same processes.
-
3. Data availability. Reliable values of all statistical indicators or results of sociological research needed to determine the values of indicators should be available.
-
4. Taking into account international and Russian experience . In order to ensure comparability with the results of international studies, it is necessary to apply those indicators that have already been successfully used by major international organizations that study sustainable development.
Almost all existing systems include indicators of social and labor relations and living standards. It is quite difficult to draw a clear line between them; it can be done only conditionally. However, due to the fact that each group of indicators assesses different socioeconomic processes and aspects of human life, it is advisable to consider them separately. The authors [19; 20; 21] share a similar viewpoint.
Indicators of sustainable development of social and labor relations
The system of global indicators for achieving UN sustainable development goals15 includes 14 indicators reflecting social and labor relations. The Interstate Statistical Committee of the Commonwealth of Independent States (CIS)16 uses 11 indicators. The Organization for Economic Cooperation and Development (OECD)17 and Russia18 consider ten indicators. The World Bank (WB)19 proposes to use nine indicators. And only six indicators were recommended by the Conference of European Statisticians20 on measuring sustainable development. With the exception of indicators used by CES, all the indicators of the five systems are designed to quantify a particular goal of Agenda 2030 (Tab. 1).
Analyzing the six presented systems of sustainable development indicators of the social and labor sphere, we can note the following. Only one indicator has a crosscutting value – the annual growth rate of real GDP per employee (labor productivity index). Three indicators are presented in five systems. These include: a) proportion of time spent on unpaid care and domestic work, by sex, age and place of residence; b) unemployment rate, by sex, age and disability; c) proportion of young people (aged 15-24) who do not study, work or acquire professional skills. Two other indicators – a) share of informal employment in non-agricultural sectors, by sex; b) proportion and number of children between 5 and 17 years of age engaged in child labor, by sex and age – are present in four systems. Eleven indicators are present in only one of the six systems.
Sustainable development indicators and living standards
The system of global indicators for achieving the UN sustainable development goals and the system proposed by the Interstate Statistical Committee of the Commonwealth of Independent States included seven indicators reflecting the level of poverty and labor market indicators. The Organization for Economic Cooperation and Development and Russia include five indicators each. The World Bank considers four indicators. And only two indicators were recommended by the Conference of European Statisticians on measuring sustainable development of living standards (Tab. 2) .
Considering the above systems of sustainable development indicators of living standards, we can note the following. Two indicators are presented in five systems: a) the proportion of the population living below the international
Table 1. Systems of sustainable development indicators for the social and labor sphere
|
Code |
Indicator |
System of indicators |
|||||
|
UN |
WB |
OECD |
CIS |
Russia |
CES |
||
|
4.3.1 |
Level of participation of adults and young people in formal and non-formal education and training in the last 12 months, by sex |
+ |
+ |
+ |
+ |
||
|
5.4.1 |
Proportion of time spent on unpaid care and domestic work, by sex, age and place of residence |
+ |
+ |
+3 |
+ |
+7 |
|
|
5.5.2 |
Proportion of women in decision-making positions |
+ |
+1 |
+4 |
+ |
+ |
|
|
8.2.1 |
Annual growth rates of real GDP per employee (labor productivity index) |
+ |
+ |
+5 |
+ |
+ |
+ |
|
8.3.1 |
Share of informal employment in non-agricultural sectors, by sex |
+ |
+ |
+ |
+ |
||
|
8.5.2 |
Unemployment rate, by sex, age and disability |
+ |
+ |
+ |
+ |
+ |
|
|
8.6.1 |
Proportion of young people (aged 15-24) who do not study, work or acquire professional skills |
+ |
+ |
+ |
+ |
+ |
|
|
8.7.1 |
Proportion and number of children between 5 and 17 years of age engaged in child labor, by sex and age |
+ |
+2 |
+ |
+ |
||
|
8.8.1 |
Fatal and non-fatal occupational injuries, by sex and migration status |
+ |
+ |
+8 |
|||
|
8.8.2 |
Situation concerning the observance of labor rights at the national level, by sex and migration status |
+ |
|||||
|
8.8.2 |
Work intensity index (exceeding the requirements of work on resources: lack of time, health risks, inability to learn) |
+ |
|||||
|
8.b.1 |
Existence of a national youth employment strategy that has been developed and is now being implemented |
+ |
|||||
|
8.b.1 |
Share of public expenditure on social protection and employment programs in the state budget and GDP |
+ |
|||||
|
9.2.2 |
Employment in manufacturing, as a percentage of total employment |
+ |
+ |
+ |
+ |
||
|
9.5.2 |
Number of researchers (full-time equivalent), per million inhabitants |
+ |
+ |
+6 |
+ |
||
|
10.7.1 |
Employment costs of an employee, as a percentage of annual income in the country of destination |
+ |
|||||
|
10.7.1 |
Difference in unemployment level between migrants and the local population |
+ |
|||||
|
Employment rate |
+ |
||||||
|
Employment rate in women |
+ |
||||||
|
Employment rate in young people |
+ |
||||||
|
Hours worked (average hours per week) |
+ |
||||||
|
Average age of labor market exit |
+ |
||||||
The following clarifications have been made: 1 including the proportion of women in national parliaments; 2 aged 7 to 14, 3 difference between men and women; 4 share of top management positions occupied by women in major companies; 5 per hour of work; 6 in the workforce; 7 unpaid child care and domestic work; 8without breaking down by migration status.
poverty line, by sex, age, employment status and place of residence (urban/rural); b) growth rate of household expenditure or per capita income among the poorest 40% of the population and among the population as a whole. Three indicators in different combinations are presented in four systems. Two other indicators are used in three systems: a) proportion of the population living below the official poverty line, by sex and age; and b) proportion of men, women, and children of all ages living in poverty in all its manifestations, according to national definitions. Three indicators are used only by individual systems. Two indicators are used only by the OECD: the income to poverty ratio and the quality of earnings (relationship between income and well-being of employees). The Gini coefficient, which is quite convenient to be used in different systems, is recommended only by the CES.
Table 2. Systems of sustainable development indicators of living standards
|
Code |
Indicator |
System of indicators |
|||||
|
UN |
WB |
OECD |
CIS |
Russia |
CES |
||
|
1.1.1 |
Proportion of the population living below the international poverty line, by sex, age, employment status and place of residence (urban/ rural) |
+ |
+1 |
+3 |
+ |
+ |
|
|
1.2.1 |
Proportion of the population living below the official poverty line, by sex and age |
+ |
+2 |
+ |
+ |
||
|
1.2.1 |
Ratio of income to poverty level |
+ |
|||||
|
1.2.2 |
Proportion of men, women and children of all ages living in poverty in all its manifestations, according to national definitions |
+ |
+2 |
+ |
|||
|
8.5.1 |
Average hourly earnings of women and men by occupation, age, and disability |
+ |
+ |
+4 |
+ |
||
|
8.5.1 |
Quality of earnings (correlation between the income and well-being of employees) |
+ |
|||||
|
10.1.1 |
Growth rates of household expenditure or per capita income among the poorest 40% the population and the general population |
+ |
+ |
+ |
+ |
+ |
|
|
10.2.1 |
Proportion of people with incomes below 50% of median income, by gender, age, and disability |
+ |
+ |
||||
|
10.4.1 |
Share of incomes of employed in GDP, including wages and social security payments |
+ |
+ |
+ |
+ |
||
|
Gini coefficient |
+ |
||||||
The following clarifications have been made: 1 less that 1.25 USD per day, 2 total urban and rural population; 3less than 1.90 USD per day, 4without breaking down on the basis of disability.
Method of calculation of the index of sustainable development by labor indicators
We choose four labor factors: the size of people’s incomes, income differentiation, unemployment, and employment structure. Each factor includes a number of indicators. Labor indicators that reflect the size of income are aimed at achieving the goals of “decent work and economic growth”, “good health and well-being”, “poverty eradication” and “reducing inequality”. Sustainable development implies a high standard of living for the population, which cannot be achieved without rising incomes. The first indicator is the ratio of average income to the cost of a fixed set of consumer goods and services. It characterizes not only the amount of money income of the population, but also its purchasing power. The indicator varies greatly in the North: from 1.2 in Tyva to 3.8 in Yamal-Nenets Autonomous Okrug in 2015. One indicator of expenditure structure is taken into account: the share of household consumer spending on food. In 2015, its values ranged from 26.1 in Khanty-Mansi Autonomous Okrug to 42.4 in the Magadan Oblast. The third indicator – the ratio of the average wage in the region to the average wage in the country – assesses wages in uniform prices in the country and demonstrates competitiveness of the labor market in the region. In 2015, the highest value was recorded in Chukotka Autonomous Okrug (234%), the lowest – in the Republic of Tyva (83%).
Labor income differentiation contributes to the achievement of the same goals as the previous group. The rise in inequality is global. It is caused by the reduction in the number of workers with average wage, as a result of mechanization and the introduction of outsourcing [22, pp. 290-291]. In Russia and in the Russian North, inequality is exacerbated by the income gap between workers in different economic sectors, between urban and rural areas, and between men and women. The first indicator characterizes poverty – the share of population with monetary incomes below the subsistence level. Poverty is high in some regions of the North. For example, it is 38.2 in the Republic of Tyva, and 18.9 in Yakutia, which is also 1.4 times higher than the national average for Russia. Poverty eradication is one of the central goals of sustainable development. The Gini coefficient characterizes the degree of deviation of the line of the actual distribution of total incomes from the line of their uniform distribution. It varies between 0 (perfect equality – everyone’s incomes are equal) and 1 (perfect inequality –one person earns everything). In the North, the coefficient is high in oil and gas producing regions and low in the rest ones. Ratio of women’s wages to men’s wages shows the degree of gender equality in the labor market. In Chukotka Autonomous Okrug, the average salary of women is only 62.1% of men’s, in Kamchatka Krai – 85.4%.
Labor indicators of unemployment are linked to the goals of “decent work and economic growth” and “poverty eradication”. Two indicators show the same phenomenon, but from different angles: unemployment rate according to sample surveys data and registered unemployment rate . Unemployment problems are observed in most regions of the North. In total, registered unemployment rate in the three Northern regions – in Khanty-Mansi and Yamalo-Nenets autonomous okrugs and in the Sakhalin Oblast – is lower than the Russian average. Unemployment rate is extremely high according to sample surveys in Tyva (18.6%). The third indicator – average time of job search by the unemployed (in months) reflects the degree of tension in the labor market.
Labor indicators of the employment structure pursue the goals of “quality education”, “gender equality”, and “reducing inequality”. The first indicator is average educational level of the employed population, calculated in the years of training on the most common educational trajectory [23, p. 149] on the basis of sample survey data. It takes into account all levels of education at the same time. A sustainable labor market should encourage education. According to an OECD report, education correlates with such important factors of sustainable development as improving health, reducing crime, increasing charity and volunteering. Educated people feel happier and encourage education in the next generation, and respecting the interests of future generations is an essential goal of sustainable development21.
The second indicator is the share of people employed in the mineral production in the total number of employees . The high value of this indicator in the North of Russia hinders sustainable development due to the exploitation of natural environment, creation of social inequality, and the impact on the way of life of indigenous peoples of the North. In addition, minerals are non-renewable, and sooner or later they will be exhausted, which will cause employment-related problems. Therefore, reducing the dependence of the labor market on mining is considered as one of sustainable development goals for the North. In 2015, in four autonomous okrugs of the North, the share of people employed in extractive industries varied from 18 to 23%.
The third indicator is the difference in employment between men and women of working age . Reducing gender inequality in the labor market is among sustainable development goals. In the North, gender gap in employment is generally lower than the national average, but it is high in some regions.
According to a survey of 26 experts from Russian scientific organizations who work in the field of labor economics and demography, each factor and indicator received its weight (Tab. 3) .
Table 3. Labor factors and indicators of sustainable development, their weight according to experts (2017)
|
Labor factors |
Impact on sustainable development, weigh of the factor |
Labor indicators |
Impact on sustainable development, weigh of the factor |
|
People’s incomes |
0.284 |
Ratio of average income to the cost of a fixed set of consumer goods and services |
0.363 |
|
Share of household consumption expenditure on food |
0.343 |
||
|
Ratio of the average wage in the region to the average wage in the country |
0.294 |
||
|
Income differentiation |
0.253 |
Share of population with cash income below the subsistence level |
0.386 |
|
Gini coefficient |
0.333 |
||
|
Ratio of women’s wages to men’s wages |
0.281 |
||
|
Unemployment |
0.216 |
Unemployment rate according to sample surveys |
0.362 |
|
Average time of job search by the unemployed |
0.353 |
||
|
Registered unemployment rate |
0.285 |
||
|
Employment structure |
0.247 |
Average educational level of employed population, years of study |
0.391 |
|
Share of people employed in the mineral extraction in total employment |
0.342 |
||
|
Difference in employment level between men and women of working age |
0.267 |
||
|
Source: our own compilation. |
|||
Table 4. Ranking Northern regions of Russia by the degree of sustainable development according to labor indicators, 2000–2015
|
Degree of labor stability |
2000 г. |
2005 г. |
2010 г. |
2015 г. |
|
71–78 high |
Yamalo-Nenets AO |
Yamalo-Nenets AO Arkhangelsk Oblast Murmansk Oblast Sakhalin Oblast Kamchatka Krai |
||
|
63–70 average |
Khanty-Mansi AO |
Khanty-Mansi AO Chukotka AO Arkhangelsk Oblast Yamalo-Nenets AO |
Khanty-Mansi AO Chukotka AO Arkhangelsk Oblast Murmansk Oblast Sakhalin Oblast Kamchatka Krai Republic of Karelia Republic of Komi Nenets AO Magadan Oblast |
Khanty-Mansi AO Chukotka AO Republic of Karelia Republic of Komi Nenets AO Magadan Oblast Republic of Yakutia |
|
55–62 low |
Yamalo-Nenets AO Republic of Karelia Arkhangelsk Oblast Nenets AO Republic of Yakutia Chukotka AO Magadan Oblast Sakhalin Oblast |
Sakhalin Oblast Republic of Karelia Nenets AO Magadan Oblast Republic of Yakutia Kamchatka Krai Murmansk Oblast Republic of Komi |
Republic of Yakutia Republic of Tyva |
Republic of Tyva |
|
47–54 critical |
Republic of Komi Murmansk Oblast Kamchatka Krai Republic of Tyva |
Republic of Tyva |
||
|
Source: our own complilation. |
||||
First, the constituent entity of the Russian Federation with the best value of the indicator for the entire period (2000–2015) was assigned 100 points, and that with the worst value – 1 point. Then, all Northern regions received values on a scale from 1 to 100 by linear scaling based on extreme values. This makes it possible to take into account the extent to which some regions lag behind the leading regions. At the second stage, the values of the regions were determined according to the groups of indicators corresponding to the four factors as the arithmetic mean weighted score of all the indicators included in the group. Similarly, at the third stage, the final index was calculated based on the averages of the four factors. At all the stages, the values were rounded to integers. The maximum possible value of the index is 100 points and can be achieved only if the constituent entity of the Russian Federation occupies leading positions in all the indicators included in the index. The minimum possible index value is one.
Next, integral indices are calculated, the scope of their variation is determined as the difference between the highest and lowest values of the feature in the population under consideration for four years of the fifteenyear period. The difference between the polar values (47–78) was divided into four equal intervals. Then, according to the size of the integral index, all Northern regions were ranked according to the degree of sustainable development in labor indicators (Tab. 4, Fig. 1) .
According to the degree of sustainable development, the critical group in 2000 included Kamchatka Krai (54), Murmansk Oblast (54), Komi Republic (51), and Tyva Republic (47). There was one subject – Khanty-Mansi Autonomous Okrug (66) in the middle group. The remaining 8 subjects took their place in the low group. In 2005, the stability of the Northern regions in terms of labor indicators improved significantly. Only the Republic of Tyva remained in the critical group (53). Chukotka and Yamalo-Nenets autonomous okrugs (65) and the Arkhangelsk Oblast (65) moved from the low to the middle group. The other five retained their place in the low group. In 2010, the Northern regions have increased their stability. The Republic of Sakha (Yakutia) remained in the low group (62) and the Republic of Tyva moved there (59). Yamalo-Nenets Autonomous Okrug moved to the high stability group (72), and seven more subjects – to the middle group. In 2015, the position of the Northern regions in terms of labor stability increased significantly. Four subjects joined the high group: Kamchatka Krai (75), Murmansk (72), Sakhalin (72), and Arkhangelsk (71) oblasts. The Republic of Sakha (Yakutia) (68) moved from the low to the middle group. The Republic of Tyva (57) is the only region that remained in the low group of labor stability (Tab. 5).
In general, over the period under consideration, sustainable development assessed according to the employment indicators for the Northern regions was higher than the national level only in 2000. The ratio was 57/56; the evaluation of stability was equal in subsequent years. For reference, we can note that labor stability in the Arctic regions in all the years was slightly above the national level (Fig. 2).
During the period under consideration, the level of incomes in the North grew more slowly than the national average. The poverty rate in the Northern regions decreased, but social inequality increased. The share of people employed in the mineral production in the total number of employees increased. After 2010,
Figure 1. Map of sustainable development of the North of Russia by labor indicators, 2015
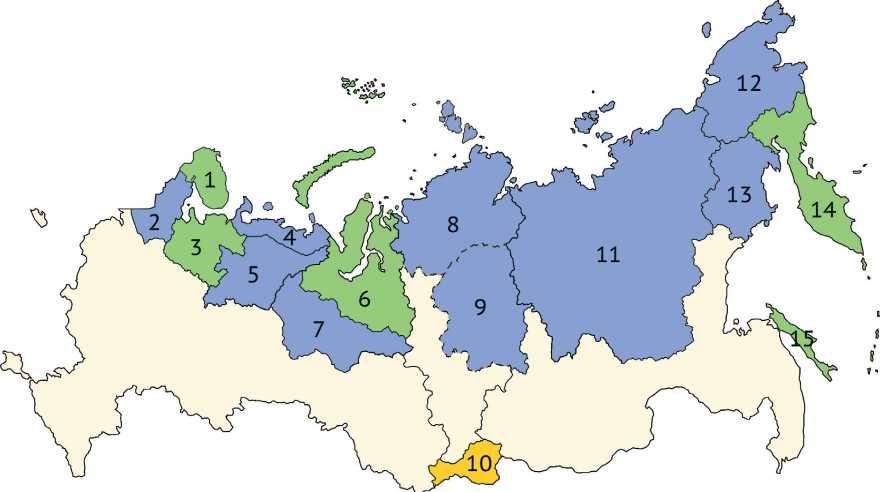
Sustainable development index based on labor indicators critical low average high
1 – Murmansk Oblast, 2 – Republic of Karelia, 3 – Arkhangelsk Oblast; 4 – Nenets Autonomous Okrug, 5 – Komi Republic, 6 – Yamalo-Nenets Autonomous Okrug, 7 – Khanty-Mansi Autonomous Okrug, 8 and 9 – Taimyrsky, Dolgano-Nenetsky and Evenkiysky districts of Krasnoyarsk Krai, 10 – Tyva Republic, 11 – Sakha Republic (Yakutia), 12 – Chukotka Autonomous Okrug, 13 – Magadan Oblast, 14 – Kamchatka Krai, 15 – Sakhalin Oblast.
Source: our own compilation.
the share of expenditures on food and the level of poverty began to increase. The increase in the integral index is caused primarily by a reduction in gender inequality, an increase in the educational level of the employed, a decrease in unemployment, and an increase in the ratio of income to the value of the consumer basket.
According to the indices of sustainable development calculated by labor factors for 2015, eight regions had the best values: according to “income size” – Yamalo-Nenets (84), Nenets (78) and Khanty-Mansi (70) autonomous okrugs; according to “income differentiation”– Kamchatka Krai (78), the Magadan Oblast (73) and the Republic of Karelia (71); by “unemployment” – Yamalo-Nenets (94) and Khanty-Mansi (92) autonomous okrugs and the Magadan Oblast (90); according to “employment structure” – Kamchatka Krai (84), the Arkhangelsk (79) and Murmansk (78) oblasts.
Conclusion
The paper considers six systems of indicators that are used to assess sustainable development. Out of the variety of indicators, we selected those that reveal social and labor relations and living standards. We show what specific goal of Agenda 2030 is estimated by the indicators. We note that the systems
Table 5. Sustainable development indices for the Northern regions of Russia, calculated by labor indicators, 2000–2015
|
Regions |
Sustainable development index calculated on the basis of labor indicators |
Sustainable development index, the value of the labor factor for 2015 |
||||||
|
Year |
I i § ° "о |
| s |
E E |
E § o’ E |
||||
|
2000 |
2005 |
2010 |
2015 |
|||||
|
Russian Federation |
56 |
62 |
66 |
70 |
53 |
68 |
86 |
76 |
|
Northern regions |
57 |
62 |
66 |
70 |
61 |
67 |
87 |
67 |
|
Kamchatka Krai |
54 |
62 |
69 |
75 |
54 |
78 |
89 |
84 |
|
Yamalo-Nenets Autonomous Okrug |
62 |
65 |
72 |
74 |
84 |
67 |
94 |
54 |
|
Sakhalin Oblast |
55 |
59 |
68 |
72 |
67 |
64 |
87 |
73 |
|
Murmansk Oblast |
54 |
61 |
66 |
72 |
59 |
70 |
83 |
78 |
|
Arkhangelsk Oblast |
57 |
65 |
67 |
71 |
54 |
66 |
89 |
79 |
|
Magadan Oblast |
55 |
60 |
64 |
70 |
59 |
73 |
90 |
62 |
|
Khanty-Mansi Autonomous Okrug |
66 |
63 |
67 |
69 |
70 |
67 |
92 |
48 |
|
Republic of Sakha (Yakutia) |
58 |
62 |
62 |
68 |
57 |
66 |
85 |
69 |
|
Nenets Autonomous Okrug |
56 |
62 |
70 |
68 |
78 |
69 |
86 |
39 |
|
Komi Republic |
51 |
61 |
63 |
67 |
55 |
63 |
87 |
69 |
|
Republic of Karelia |
58 |
60 |
65 |
67 |
46 |
71 |
79 |
77 |
|
Chukotka Autonomous Okrug |
55 |
65 |
63 |
65 |
68 |
64 |
84 |
47 |
|
Tyva Republic |
47 |
53 |
59 |
57 |
39 |
65 |
47 |
76 |
|
For reference: regions, whose the entire territory is included in the Arctic zone of the Russian Federation |
57 |
63 |
68 |
72 |
69 |
69 |
88 |
66 |
Source: our own calculations based on Rosstat data. Available at:
of indicators for assessing sustainable development do not always have the statistical content provided by Rosstat. This limits the possibility of using global systems for assessing sustainable development in Russia.
We suggest our own approach to the assessment of sustainable development of the Northern territories using 12 labor indicators characterizing the development of social and labor relations and living standards. This approach is a continuation of the work in which the assessment of sustainable development of the Northern territories is based on demographic indicators [24; 25].
Sustainability is considered in the dynamics with constant coefficients with the scaling of the indicators, which allows us to track the approach of the Northern regions to the achievement of sustainable development goals outlined in the UN documents. The values of the coefficients are determined on the basis of the indicators of not only the Northern, but also all subjects of the Russian Federation, which allows us to identify specific features of labor stability in the Northern regions.
We take into consideration particularly acute socio-economic problems of the North such as the significant share of employment in the mineral sector, high costs of food, social inequality, etc. Due to the well-elaborated technique, we reveal the degree of stability for individual labor factors like the size of incomes, their differentiation, unemployment, and the structure of employment.
Figure 2. Diagram of labor stability in Russia, the North and the Arctic zone of the Russian Federation (2000, 2015)
SD index based on labor indicators
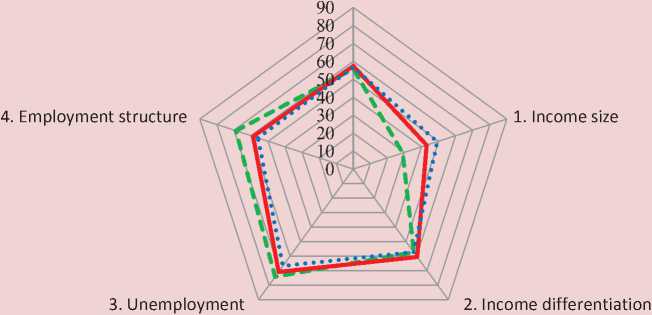
SD index based on labor indicators
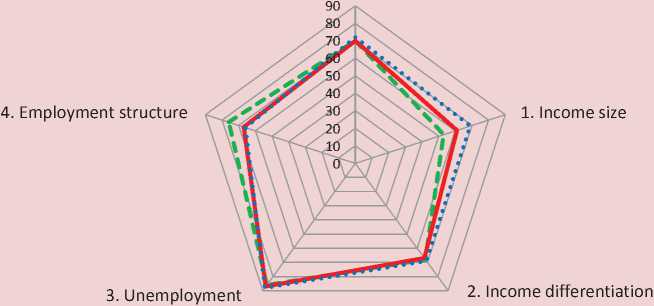
RF ^^^^^^^^ North AZRF
Source: our own calculations based on Rosstat data. Available at:
The degree of labor stability can be assessed as critical, low, average, and high. It is noted that the North of Russia has improved its labor stability. In 2000, the labor stability index was 57, and in 2015 – 70.
A methodology for forecasting demographic and labor stability, including at the municipal level, has yet to be developed. The results will be applied in the practice of strategic planning of the Northern regions. In order to improve their labor stability further, it is necessary to influence the employment structure by increasing employment in non-primary economic sectors. However, the diversification of the labor market may lead to a decrease in the average wage, the main advantage of the regions of the North.
References Sustainable development in Russia's northern regions: labor dimension
- Uskova T.V. Upravlenie ustoichivym razvitiem regiona: monografiya . Vologda: ISERT RAN, 2009. 355 p.
- Osipova M.Yu. Razrabotka statiko-dinamicheskogo podkhoda k otsenke i upravleniyu ustoichivym razvitiem regiona: diss.. kand. ekon. nauk . Perm, 2017. 263 p.
- Yurkov D.V. Upravlenie migratsiei kak mekhanizm ustoichivogo razvitiya territorii: diss.. dokt. ekon. nauk . Kazan, 2017. 408 p.
- Borisova N.G., Grigor'ev M.F., Dragileva L.Yu. et al. Faktory ustoichivogo razvitiya regionov Rossii: monografiya. Kniga 21 . Novosibirsk: Izdatel'stvo TsRNS, 2015. 164 p.
- Van Treeck K. The Role of Labor in Sustainable Development. Dissertation. Göttingen, August 2017. Available at: https://ediss.uni-goettingen.de/handle/11858/00-1735-0000-0023-3FB0-A (accessed: 17.01.2018).
- Tarasova N.P., Kruchina E.B. Sustainable development indicators and indices. In: Ustoichivoe razvitie: priroda -obshchestvo -chelovek: Materialy mezhdunarodnoi konferentsii . Moscow, 2006. Vol. 1. Pp. 127-144..
- Cobb J.B. For the Common Good: Redirecting the Economy Toward Community, the Environment and a Sustainable Future. Beacon Press, 1989. 534 p.
- Cobb C., Halstead T., Rowe J. Redefining Progress: The Genuine Progress Indicator, Summary of Data and Methodology. San Francisco, CA: Redefining Progress, 1995. 50 p.
- Osberg L., Sharpe A. An index of economic well-being for selected OECD countries. Review of Income and Wealth, 2002, vol. 48, pp. 291-316.
- Pearce D., Atkinson G. Capital theory and the measurement of sustainable development: an indicator of "weak" sustainability. Ecological Economics, 1993, vol. 8, pp. 103-108.
- Lawn P., Sanders R. Has Australia surpassed its optimal macroeconomic scale? Finding out with the aid of ‘benefit' and ‘cost' accounts and a sustainable net benefit index. Ecological Economics, 1999, vol. 28, pp. 213-229.
- Rees W., Wackernagel M. Ecological footprints and appropriated carrying capacity: measuring the natural capacity requirements of the human economy. In: Investing in Natural Capital. Washington DC: Island Press, 1994.
- Kahneman D., Krueger A. Developments in the measurement of subjective well-being. Journal of Economic Perspectives, 2006, vol. 20, pp. 3-24.
- Easterlin R. Does economic growth improve the human lot? Some empirical evidence. Essays in Honor of Moses Abramovitz. 1974. Pp. 89-125.
- Anielski M. The Economics of Happiness: Building Genuine Wealth. Canada: New Society Publishers, 2007. 288 p.
- Layard R. Happiness: Lessons from a New Science. UK: Penguin, 2011.
- Widok A. Social Sustainability: Theories, Concepts, Practicability. Environmental Informatics and Industrial Environmental Protection: Concepts, Methods and Tools (Part 2). Berlin: Shaker Verlag, 2009. Pp. 43-51.
- Hasan M. Indicators of Sustainable Development: The Malaysian Perspective. Available at: www.lgt.lt/geoin/files/S2_Paper1.rtf (accessed: 17.01.2018).
- Ryabova L.A., Toropushina E.E., Korchak E.A., Toichkina V.P., Novikova N.A. Social sustainability of regions of the Russian North and the Arctic: results of assessment and achievement priorities. In: Sever i Arktika v novoi paradigme mirovogo razvitiya: aktual'nye problemy, tendentsii, perspektivy: nauchno-analiticheskii doklad . Apatity: KNTs RAN, 2016. Pp. 276-294..
- Shabunova A.A., Leonidova G.V. Human capital as an indicator of sustainable development of the territory. Ekonomicheskie i sotsial'nye peremeny: fakty, tendentsii, prognoz=Economic and Social Changes: Facts, Trends, Forecast, 2011, no. 5 (17), pp. 101-115..
- Uskova T.V., Kopasova S.S. Sustainable development of the region: from conceptual framework to practical results. Ekonomicheskie i sotsial'nye peremeny: fakty, tendentsii, prognoz=Economic and Social Changes: Facts, Trends, Forecast, 2008, no. 43, pp. 21-31..
- Deaton A. Velikii pobeg: zdorov'e, bogatstvo i istoki neravenstva . Moscow: Izd-vo Instituta Gaidara, 2016. 368 p.
- Smirnov A.V. Рrediction of the demographic and educational processes on the territories of different levels. Korporativnoe upravlenie i innovatsionnoe razvitie ekonomiki Severa: Vestnik NITs KPUVI SyktGU (elektronnyi zhurnal)= Corporate Governance and innovative economic development of the North: Bulletin of Research Center of Corporate Law, Management and Venture Investment of Syktyvkar State University (Network Edition), 2016, no. 1, pp. 146-155..
- Fauzer V.V., Lytkina T.S., Fauzer G.N. Demographic aspects of sustainable development of the Northern territories. In: Novye podkhody i metody upravleniya ustoichivym sotsial'no-ekonomicheskim razvitiem regionov: Materialy Vserossiiskoi nauchno-prakticheskoi konferentsii 24-25 oktyabrya 2017 g., IPRE RAN . Saint Petersburg: GUAP, 2017. Pp. 229-234..
- Fauzer V.V., Lytkina T.S., Smirnov A.V., Fauzer G.N. Demographic indicators for assessing sustainable development of the Northern regions of Russia. In: Modelirovanie stsenariev ustoichivogo razvitiya severnykh regionov Rossii v sovremennykh usloviyakh . Syktyvkar: Izd-vo SGU im. Pitirima Sorokina, 2017. Pp. 268-277..
