Symbolic Representation of Sign Language at Sentence Level

Author: Nagendraswamy H S, Chethana kumara B M, Guru D S, Naresh Y G
Journal: International Journal of Image, Graphics and Signal Processing(IJIGSP) @ijigsp
Article in issue: 9 vol.7, 2015.
Free access
In this paper, we propose a model for recognition of sign language being used by communication impaired people in the society. A novel method of extracting features from a video sequence of signs is proposed. Key frames are selected from a given video shots of signs to reduce the computational complexity yet retaining the significant information for recognition. A set of features is extracted from each key frame to capture the trajectory of hand movements made by the signer. The same sign made by different signers and by the same signers at different instances may have variations. The concept of symbolic data particularly interval type data is used to capture such variations and to efficiently represent signs in the knowledgebase. A suitable similarity measure is explored for the purpose of matching and recognition of signs. A database of signs made by communication impaired people of Mysore region is created and extensive experiments are conducted on this database to demonstrate the performance of the proposed approach.
Sign language, Video sequence, Key frame, Interval valued features
Short address: https://sciup.org/15013909
IDR: 15013909
Text of the scientific article Symbolic Representation of Sign Language at Sentence Level
Published Online August 2015 in MECS
Communication is a process of transmitting information from one person to another through a medium called language. A sign language is a form of language used by communication impaired people to exchange their thoughts and views with the society for their daily needs. It is very difficult for laymen to understand the signs performed by the communication impaired people except those who are trained and are able to communicate with such people.
Any sign language is a combination of hand movements, hand orientation and facial expression of a signer [3]. Interpretation of sign language is done through two different ways viz., device based and vision based methods [16]. In a device based method, user has to wear gloves, which are embedded with several sensors. These sensors yield time varying parameters to interpret the sign. On the other hand, in video based methods, videos are captured by cameras and video frame information is used to detect the hand and face region. Movements of the detected hand are tracked and the facial expressions are characterized for interpretation of a particular sign. Compared to device based methods, vision based methods impose minimal restriction to the signers but its success is primarily dependent on the accurate segmentation of hand and face regions followed by effective characterization of hand movements and facial expressions.
Since hand movements play a vital role in sign language interpretation, hence in this paper, we propose a novel method for tracking hand movements of a signer in a sequence of video frames and extracting relevant features for effectively characterizing and representing a sign in the knowledgebase for its interpretation.
-
II. Related Work
Several researchers have made an attempt to standardize the sign language and to propose some novel techniques to represent and interpret a sign language. Out of several such attempts, few interesting attempts are presented here.
The suitability of PCA based model for the purpose of recognizing fingerspelling alphabets is made in [14]. Its performance on a large and varied real time dataset is analyzed. In order to enhance the performance of a PCA based model, a sort of pre-processing operation both during training and recognition is incorporated. An exhaustive experiment conducted on a large number of fingerspelling alphabet images taken from 20 different individuals in real environment has revealed that the suggested pre-processing has a drastic impact in improving the performance of a PCA based model.
An appearance based model for recognizing fingerspelling alphabets for sign language interpretation is proposed in [15]. The proposed model suggests a modification to the existing diagonal FLD model at two stages, one at rearranging of images and the other at adjusting the contrast of the images by the use of histogram equalization. An extensive experimentation conducted on a large fingerspelling dataset revealed the superiority of the proposed model.
Sign language recognition in terms of Fingerspelling has limited to recognition of alphabets and numerals [14,15]. Sign language sentences are a series of signs with movement epenthesis between signs [11]. Recognition of sentences through fingerspelling is a difficult and time consuming task.
In [13], vital problems, which occur in continuous sign recognition, are addressed. Problems are identified at two levels, one at sentence level and another at feature level. Sentence level problems are called as moment epenthesis and feature level problems are termed as problem of hand segmentation and grouping. In [12], sign language recognition is carried out on a two-stage classification procedure where an initial classification stage extracts a high level description of hand shape and motion. This high level description is based on sign linguistics and describes actions at conceptual level easily understood by humans. Moreover, such a description broadly generalizes temporal activities naturally overcoming variability of people and environments. A second stage of classification is then used to model the temporal transitions of individual signs using Markov chains combined with independent component analysis.
Interpretations of manually generated signs are carried out using different features viz., hand shape, motion and place of articulation [2]. In [19], American Sign Language recognition is carried out based on two different views of the camera viz., desk based camera tracking and hat-mounted camera tracking for tracking hand signs. Confined information of hand shape, orientation and trajectory from video scenes of signed sentences are used for recognition using Hidden Markov Model.
In [18], structure of signed sentences is conveyed by grammatical markers, which are represented by facial feature movements and head motions. They used a two-layer conditional random field model for recognizing continuously signed grammatical markers in ASL. Recognition requires identifying both facial feature movements and head motions while dealing with uncertainty introduced by movement empathies and effects.
In [7], an integrative approach to extract sufficient aggregate information for robust sign language recognition in spite of unreliable individual cues is addressed. Quantification of facial expressions such as mouth, eye aperture, eyebrow raise and hand tracking using color and appearance models are used for tracking face and hand of a signer.
From the literature survey, it is clear that few researchers have addressed the problem of sign language recognition. The reported works clearly shows that the attempts have been made only at finger spelling level [6, 14, 15, 22, 23, 1]. But it is observed that the sign language used by the communication impaired people is very abstract and the finger spelling approaches to sign language recognition is not feasible. However, there are few attempts at word level [19, 21, 24] but no concrete work at sentence level is reported in literature. Though it is a very challenging task to deal with sign language recognition at sentence level without any limitations, we made an initial attempt in this direction to study the feasibility of such systems with some limitations.
In view of this, in this research work, we made an attempt to design a model to recognize signs of communication impaired people at sentence level with some constraints. We also explored the applicability of symbolic data [8] analysis for robust and effective representation of signs for their recognition and interpretation.
Rest of the paper is organized as follows: Section 3 describes a novel method of feature extraction and representation of signs. Experimental results to study the efficacy of the proposed technique are presented in Section 4, followed by conclusion and future directions in section 5.
-
III. Proposed Methodology
A complete video-based sign language recognition system involves various stages including preprocessing stage. A continuous sign made by a signer is captured through a camera and is preprocessed to remove noise if any. The video of continuous sign is composed of several signs and need to be segmented at a right point to interpret a particular sign. Thus the segmentation of continuous video of signs into shots of individual sign is an important stage. The shots of an individual sign may contain frames with redundant or less significant information. So such frames need to be eliminated from actual process of sign interpretation. Selection of most significant frames from a shot of an individual sign is referred as key frame selection and is another important stage in the sign language recognition system. Once, key frames are selected, features from each key frame are extracted and organized efficiently for effective representation of a sign in the knowledgebase, which will be used later for recognition. Once a knowledgebase of signs is created, a given test sign represented in terms of features is compared against the signs stored in the knowledgebase, and a matching score is computed for the purpose of recognition. The following subsections explain in detail the proposed method to accomplish all the stages mentioned above.
An overview of the proposed sign language recognition system can be schematically depicted as shown in Fig. 1.
-
A. Feature Extraction and Representation
This section presents the proposed method of feature extraction and representation of signs made by communication impaired people. The task further involves various subtasks such as segmentation of hands and face regions, capturing spatial relationships among hands and face regions and selection of key frames to avoid redundant or less significant frames to reduce the volume of information needed to characterize the sign. The following subsections present the detailed description about each subtask.
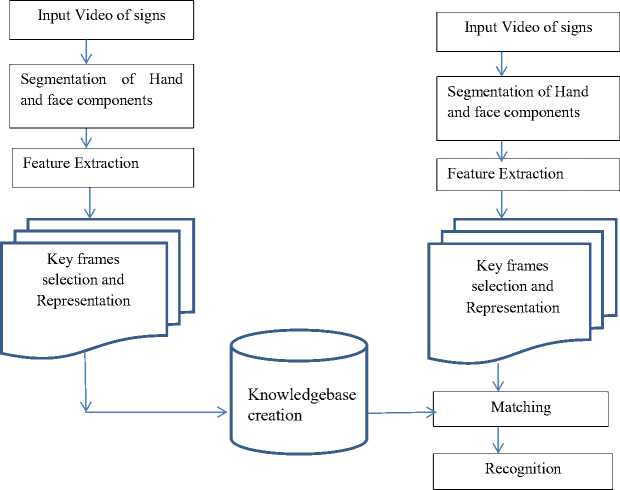
Fig.1. Schematic representation of the proposed model
-
a. Segmentation of Hand and Face Regions
In order to extract relevant features from a sign, it is necessary to process every frame of a video of the sign. A frame is segmented to isolate hand and face regions of a signer from the background. A simple skin region segmentation technique is used to accomplish this task. The frame to be processed is converted from RGB color space to HSV color space. The reason for such conversion is that the HSV color space is closely associated with human perception and provides more details for segmentation. A threshold value based on local information of the entire frame is used to separate skin and non-skin regions in the frame. A series of morphological operations such as opening and closing (masking) are applied on the frame to obtain more accurate segmented regions. Fig. 2 (a) and (b) shows the face and hand components in various frames and segmented hands and face regions for few frames as examples respectively.
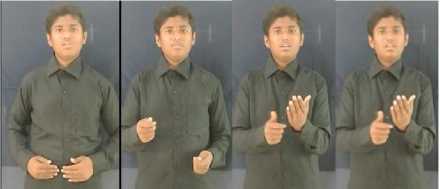
Fig.2. (a) Face and hand components in various frames of the sentence “I WANT BUS TICKET”
-
b. Tracking and Characterizing Hand Movements
Movement of hands of a signer plays an important role in making any sign [5]. Thus, it is very much essential to track the hand movements across the frames in a video of signs. A simple and a novel method of tracking hand movements by estimating spatial relationship among hands and face regions is proposed. After segmenting hand and face regions in a frame, the centroids CL , CR and CF of left hand, right hand and face region, respectively, are computed. The lines connecting these three centroid points are drawn. The slope angle ( У FL ) and the distance ( dFL ) between face centroid ( CF ) and left hand centroid ( CL ) are computed. Similarly, slope angle (У FR ) and the distance ( dFR ) between Face centroid ( CF ) and right hand centroid ( CR ) and the slope angle (У LR ) and the distance ( d LR ) between left hand centroid ( CL ) and right hand centroid ( CR ) are computed. Thus the
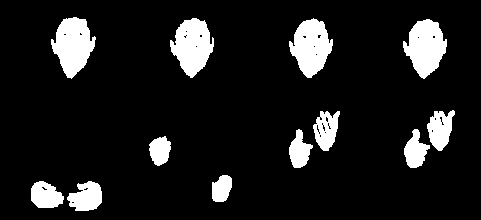
Fig.2. (b) Segmented face and hand components in various frames of the sentence “I WANT BUS TICKET”
spatial relationship among the face, left hand and right hand components has been established in terms of their slope angles and their distances. Fig. 3 shows an instance of hand movement and the corresponding spatial relationships established.
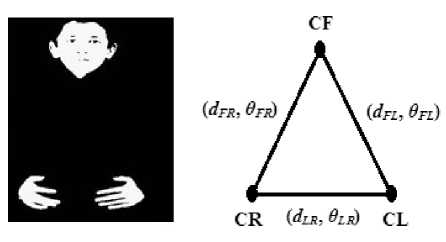
Fig.3. Instance of hand movement and the corresponding spatial relationships established
The local information such as shape of left hand and/or shape of right hand also plays an important role while making a sign and hence need to be captured. Axis of least inertia of a shape [10, 17] is exploited to capture such local information in a sign. The slope angle 9 of axis of least inertia of left hand, right hand and face region components are computed and used as features. While establishing spatial relationship among the hand and face components, we may come across the following three cases.
Case 1: All the three components are visible in isolation
In this case, the features such as {( 9 FL , d FL , 9 L ) , (У LR , d LR , 5 R ) , (9 FR , d FR , 6 F )} where
-
f 1: θ FL is the slope angle between face and left hand component of a signer.
-
f 2: d FL is the Euclidean distance between face and left hand component of a signer.
-
f 3 : θ L is the slope angle of axis of least inertia of left hand component of a signer.
-
f 4 : θ LR is the slope angle between left hand and right hand component of a signer.
-
f 5 : d LR is the Euclidean distance between left hand and right hand component of a signer.
-
f6 : θ R is the slope angle of axis of least inertia of right hand component of a signer.
-
f7 : θ FR is the slope angle between face and right hand component of a signer.
-
f8 : d FR is the Euclidean distance between face and right hand component of a signer.
-
f 9 : θ F is the slope angle of axis of least inertia of face component of a signer.
Table 1 shows an example feature vector of this case.
Table 1. Values of features representing consecutive frames when all the three components are visible in isolation
|
Frame |
f 1 |
f 2 |
f 3 |
f 4 |
f 5 |
f 6 |
f 7 |
f 8 |
f 9 |
|
1 |
-0.36026 |
236 |
-0.43227 |
0.01630 |
78 |
-0.12637 |
-0.34395 |
204 |
1.47234 |
|
2 |
-0.36748 |
235 |
-0.41900 |
0.01685 |
79 |
-0.22766 |
-0.35063 |
204 |
1.31913 |
|
3 |
-0.36915 |
236 |
-0.42443 |
0.02210 |
78 |
-0.18615 |
-0.34705 |
204 |
1.57051 |
Table 2. Values of features representing consecutive frames when the two hand components are merged together
|
Frame |
f 1 |
f 2 |
f 3 |
f 4 |
f 5 |
f 6 |
f 7 |
f 8 |
f 9 |
|
115 |
-1.31139 |
208 |
0.68634 |
0 |
0 |
0.68634 |
-1.31139 |
208 |
-0.35752 |
|
116 |
-1.30942 |
207 |
0.65375 |
0 |
0 |
0.65375 |
-1.30942 |
207 |
-1.30940 |
|
117 |
-0.26961 |
213 |
0.63817 |
0 |
0 |
0.63817 |
-0.26961 |
213 |
-1.48651 |
Case 2: Only two components are visible.
There is a possibility that either the left hand component or the right hand component is merged with the face component or both left hand and right hand components are merged together at certain points while making a sign. In these instances only two components are visible and these situations are dealt as follows:
When two hand components are merged together only the values of θFM , dFM , θM , and θF are computed, where θ FM is the slope angle between face component and the merged hand component, d FM is the distance between the face component and merged hand component, θ M is the slope angle of axis of least inertia of the merged component and θ F is the slope angle of axis of least inertia of the face component. The values of θFM , dFM , and θ M are respectively assigned to ( θ FR , θ FL ), ( d FR , d FL ) and ( θ R , θ L ). The feature values d LR and θ LR are assumed to be 0. Table 2 shows an example feature vector of this case.
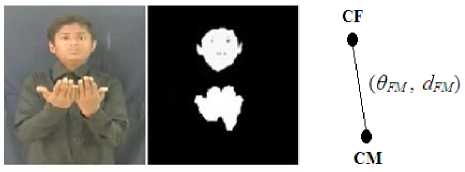
Fig.4. Instance of a sign when two hand components are merged together and the corresponding spatial relationship established.
When left hand component is merged with the face component, only the values of θRM, dRM, θM and θR are computed, where θRM is the slope angle between right hand component and the merged component, dRM is the distance between the right hand component and merged component, θM is the slope angle of axis of least inertia of the merged component and θR is the slope angle of axis of least inertia of the right hand component. The values θRM, dRM, and θM are respectively assigned to (θFR, θLR), (dFR, dLR) and (θF, θL). The feature values dFL and θFL are assumed to be 0. Table 3 shows an example feature vector of this case. Fig. 5 shows an instance of a sign when a left hand component is merged with face component and the corresponding spatial relationship established.
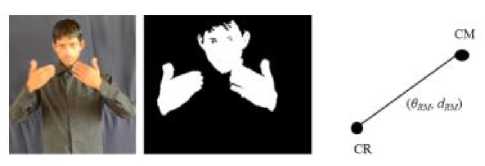
Fig.5. Instance of a sign when left hand component is merged with face component and the corresponding spatial relationship established
When right hand component is merged with the face component, only the values (θLM, dLM, θM, θL) are computed. Where θLM is the slope angle between left hand component and the merged component, dLM is the distance between the left hand component and the merged component, θM is the slope angle of axis of least inertia of the merged component and θL is the slope angle of axis of least inertia of the left hand component. The values θLM, dLM, and θM are respectively mapped to (θFL, θLR), (dFL, dLR) and (θF, θR). The feature values dFR and θFR are assumed to be 0. Table 4 shows an example feature vector of this case. Fig. 6 shows an instance of a sign when a right hand component is merged with face component and the corresponding spatial relationship established.
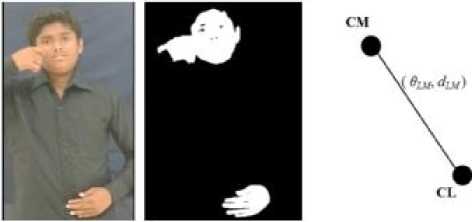
Fig.6. Instance of a sign when right hand component is merged with face component and the corresponding spatial relationship established
Table 3. Values of features representing consecutive frames when left hand component is merged with face
|
Frame |
f1 |
f2 |
f3 |
f4 |
f5 |
f6 |
f7 |
f8 |
f9 |
|
136 |
0 |
0 |
-0.58429 |
-0.62857 |
147 |
0.78539 |
-0.62857 |
147 |
-0.58429 |
|
137 |
0 |
0 |
-0.49429 |
-0.35063 |
143 |
1.10714 |
-0.35063 |
143 |
-0.49429 |
|
138 |
0 |
0 |
-0.54851 |
-0.24702 |
139 |
0.23182 |
-0.24702 |
139 |
-0.54851 |
Table 4. Values of features representing consecutive frames when the right hand component merged with face
|
Frame |
f1 |
f2 |
f3 |
f4 |
f5 |
f6 |
f7 |
f8 |
f9 |
|
102 |
-0.36670 |
126 |
0.10949 |
-0.36670 |
126 |
1.30835 |
0 |
0 |
1.30835 |
|
103 |
-0.38008 |
117 |
0.20652 |
-0.38008 |
117 |
1.13690 |
0 |
0 |
1.13690 |
|
104 |
-0.38301 |
121 |
0.29005 |
-0.38301 |
121 |
1.35194 |
0 |
0 |
1.35194 |
Case 3: All components are merged together
In this case, only one feature value i.e. the slope angle (У M ) of axis of least inertia of the merged single component is obtained and all the values mentioned in the case 1 and case 2 are assumed to be zero. Table 5 shows an example feature vector of this case. Fig. 7 shows an instance of a sign when all the three components are merged together.
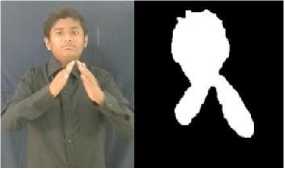
Fig.7. Instance of a sign when all the three components are merged together
-
c. Key frame Selection
A video of a sign contains several frames. Successive frames may not contain most significant information and hence only those frames, which have more discriminative information, will be considered for characterizing the sign. Selection of such discriminative frames is referred to as key frame selection, which significantly reduces the number of frames needed to characterize the sign and hence overall complexity of the task.
The proposed method of key frame selection technique uses the features extracted from each frame as described in the previous section. Suitable dissimilarity measure is used to compare the feature vector of the frames.
Table 5. Values of features representing consecutive frames when all the three components are merged together
|
Frame |
f1 |
f2 |
f3 |
f4 |
f5 |
f6 |
f7 |
f8 |
f9 |
|
157 |
0 |
0 |
0 |
0 |
0 |
0 |
0 |
0 |
1.04038 |
|
158 |
0 |
0 |
0 |
0 |
0 |
0 |
0 |
0 |
1.29039 |
|
159 |
0 |
0 |
0 |
0 |
0 |
0 |
0 |
0 |
1.48282 |
Let
F i = { f i 1 , f i 2 , f i 3 ,..., f i 9 } (1)
(for i = 1,…, n ) be the feature vectors representing the frames of the video. The key frames selection is accomplished as follows:
The first frame of the video is considered as the key frame. The feature vector representing the first frame of the video is compared with the feature vector representing the second frame of the video using a suitable dissimilarity measure and a dissimilarity value is computed. If the dissimilarity value is greater than the specified threshold then the second frame of the video is considered as the next key frame as it contains significant information which is not available in the first frame. If the dissimilarity value is less than the specified threshold then the second frame is neglected as it does not contain most significant information which is not available in the first frame. Now the first frame of the video is compared with the third frame and the dissimilarity value computed is compared with the threshold to make a decision whether this frame is to be considered as a key frame or not. Once a key frame is selected, the selected key frame is compared with the next frames of the video as described above to find the next key frame. This process is continued until all the frames of the video are processed.
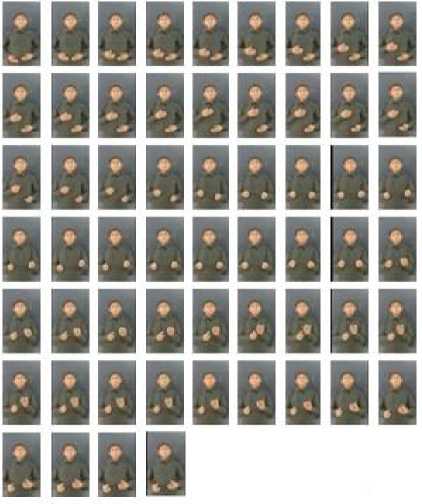
Fig.8. Selected key frames of the sentence “I WANT BUS TICKET”
Once key frames are selected, feature vectors representing key frames are organized effectively to represent the entire video of a sign and thereby characterizing the sign for recognition at the later stage. Since the same sign made by different signers or by the same signer at different instances may vary slightly due to intensity variation, capturing media, speed at which signs are made and other practical reasons, the features extracted are also varied slightly. In order to capture such variations, the concept of symbolic data (interval value type data) is explored and the signs are represented more effectively.
-
d. Sign Representation
Let s = {s1, s2,..., st } (2)
be the t number of instances of a sign S made by the users at different instances of time. In order to capture the variations of the sign as mentioned earlier, multiple representatives for the same sign are considered. Selection of multiple representatives is accomplished through the concept of clustering. If variation among the instances of sign S is less, the number of representatives will also be less; otherwise, the number of representatives will be more. Hence the number of representatives obtained for a sign S, is directly proportional to its intraclass variations [10].
Let
{ KF i 1 , KF i 2 , KF i 3 ,.., KF in } (3)
be the n number of key frames chosen for the video of sign Si , where
KF ( i ) j = { f ( i )1 j , f ( i )2 j , f ( i )3 j ,..., f ( i ) lj } (4)
be the feature vector representing jth key frame of the i th instance of a sign S, and l is the number of features.
Let C be the number of clusters obtained from t number of instances of a sign S . If a particular cluster say P among C number of clusters contain q number of instances, then the features describing the j th key frame of all the q number of instances are aggregated to form an interval type symbolic data as described below.
Let
-
(1) (1) (1) (1) (1)
KF j = { f 1 j , f 2 j , f 3 j ,..., f lj }
-
(2) (2) (2) (2) (2)
KF j {J 1 j , f 2 j , f 3 j ,...,f lj }
KF ( q ) j = { f ( q \P f ( q )2 j , f ( q \P
...
, f ( q ) lj }
be the feature vector representing the j th frame of the 1st, 2nd, 3rd,…, qth instances of a cluster P respectively.
Let f Нь- = f(Min \ = MW (1V f %, f (У)1,,.., f(q )j} f<+)ij = f(Mx)Xj = Max{f(X)xrf<2Vf<3)ij,...,f(q)y} (6)
Similarly, we compute
f ( - ) f( + ) f( - ) f( + ) f( - ) f( + )
f 2 , f 2 , f 3 , f 3 ,..., f l , f l (7)
Thus the aggregated th key frame of reference feature vector representing the pth cluster of a sign S is given by
RF pj= {[ f ( p ) -V , f ( p ) + 1 j ],[ f ( p ) - 2 j , f ( p ) + 2 j ],...,[ f ( p ) - ,p f ( p ) + j ]}
There is a possibility that the number of key frames may vary from one instance to another for the same sign. So the different instances of the same sign within the cluster will have different number of key frames. In our experiment, we have observed that there are 5 key frames difference in any cluster at the most. Since we are aggregating the features representing the key frames of a sign in cluster to form a single symbolic feature vector for the sign in that cluster, the problem of difference in key frames need to addressed.
Let u, v and w such that u < v < w be the number of key frames respectively representing the three different instances say s 1 , s 2 and s 3 of the same sign in a cluster. The first u numbers of features of all the three instances of a sign are aggregated to form an interval as discussed above. The next (v - u) numbers of features of the two instances (s2 and s3) are then aggregated in a similar way. The remaining (w – v) numbers of features of the instance s3 are made interval by considering the same value for both min and max. This technique is generalized for all the clusters while forming a single cluster representative for a sign. Table 6(a), 6(b) and 6(c) shows an example feature vector of an instance of a particular sign St and 6(d) shows the interval type representation as described earlier.
-
e. Matching and Recognition
In order to recognize a given test sign made by the signer, the video sequence of a test sign is processed to obtain key frames, and the features are extracted from each key frame as discussed in the previous section. The extracted features are organized in a sequence to represent the test sign. Since the test sign involves only one instance, the test sign is represented in the form of a crisp feature vector.
The task of recognition and interpretation is accomplished by comparing the test sign feature vector with all the reference sign feature vectors stored in the knowledgebase. A similarity value is computed through this process and the reference sign, which possess maximum similarity value with the test sign, will be considered as the sign of interest and is interpreted.
A suitable similarity measure is used for the purpose of comparing reference sign feature vector with the test sign feature vector. We describe the process of matching and recognition as follows:
Table 6. (a) Values of features representing consecutive frames belonging to an instance of a particular sign S t
|
f 1 |
f 2 |
f 3 |
f 4 |
f 5 |
f 6 |
f 7 |
f 8 |
f 9 |
|
-0.17501 |
111 |
-1.29962 |
1.12460 |
94 |
-0.53982 |
-0.01584 |
205 |
1.36837 |
|
-0.21431 |
115 |
-1.32913 |
1.11476 |
92 |
-0.52339 |
-0.18128 |
207 |
1.06570 |
|
-0.21283 |
115 |
-1.34447 |
1.13163 |
94 |
-0.50372 |
-0.16011 |
209 |
1.09469 |
Table 6. (b) Values of features representing consecutive frames belonging to an instance of a particular sign S t
|
f1 |
f2 |
f3 |
f4 |
f5 |
f6 |
f7 |
f8 |
f9 |
|
-0.20586 |
113 |
-1.38773 |
1.18187 |
108 |
-0.50181 |
-0.23043 |
221 |
1.20020 |
|
-0.18998 |
110 |
-1.36152 |
1.17153 |
107 |
-0.55188 |
-0.78539 |
217 |
1.22021 |
|
-0.19301 |
109 |
-1.37373 |
1.18071 |
110 |
-0.53049 |
-0.31715 |
219 |
1.14188 |
Table 6. (c) Values of features representing consecutive frames belonging to an instance of a particular sign S t
|
f1 |
f2 |
f3 |
f4 |
f5 |
f6 |
f7 |
f8 |
f9 |
|
-0.07950 |
110 |
-1.42325 |
1.34375 |
125 |
-1.29962 |
-0.66588 |
235 |
1.52401 |
|
-0.03036 |
105 |
-1.39615 |
1.36578 |
130 |
-1.32913 |
-0.66571 |
235 |
1.53705 |
|
-0.02969 |
104 |
-1.41125 |
1.38155 |
133 |
-1.34447 |
-0.63021 |
237 |
1.49151 |
Table 6. (d) Interval type representative for instances of a particular sign St
|
[-0.2058, -.0795] |
[110,113] |
[-1.4232, -1.299] |
[1.1246, 1.3437] |
[94,125] |
[-0.2520, -0.0158] |
[-0.6658, -0.5018] |
[205,235] |
[1.2002,1.5240] |
|
[-0.2143, -.0303] |
[105,115] |
[-1.3961, -1.329] |
[1.1147 ,1. 3657] |
[92,130] |
[-0.7853, -0.1812] |
[-0.6657, -0.5233] |
[207,235] |
[1.0657, .5370] |
|
[-0.2128, -.0296] |
[104 ,115] |
[-1.4112, -1.373] |
[1.1316, 1.3815] |
[94,133] |
[-0.3890, -0.1601] |
[-0.6302, -0.5037] |
[209,237] |
[1.0946,1.4915] |
Let
TF j = { f j , f 2 j , f 3 j -, fe } (9)
be the crisp feature vector representing the j th key frame of a test sign.
Let
TF j = {[ f “- j , f + - j ],[ f \r f + 2 j ],...,[ f j f + j ]} (10)
be the interval valued type symbolic feature vector representing the j th key frame of a reference sign.
Similarity between the test and reference sign with respect to the j th key frame is computed as
l
SIM (RF,, TF) = -£■ l d=1
-if ( f " f j^ f + dj)
Max
1 + abs ( f+ d , f jy i + abs ( f " d , f d )
otherwise
The number of frames for reference sign and the test sign may vary. Let m be the number of key frames for reference sign and n be the number of key frames for test sign. During matching, we encounter the following cases.
Case 1 : if ( m < n ) then the first m key frames of reference sign is matched with the first m key frames of the test sign as described in (11) and the total similarity between reference sign and the test sign is computed as
m
SIM ( RF , TF ) = - У SIM ( RF, , TF, ) n j = i
Case 2 : if ( m > n ) then the first m frames of test sign is matched with the first n frames of the reference sign as described in (11) and the total similarity between the reference sign and the test sign is computed as
SIM ( RF , TF ) = - УУ SIM ( RF, , TF, ) m ,= i
In all the above cases, the relative positions of the features in a feature vector representing key frames are maintained to facilitate key frame matching.
IV. Experimentation
We have conducted experiments on a considerably large dataset of sign language to validate the feasibility of the proposed methodology. The dataset contains the sentences by communication impaired people used in
their day to day life. We have considered the videos of signs which are signed by the communication impaired students of different schools of Mysore zone. Our dataset contains 600 sign videos in which there are 15 different signs expressed by four different students at 10 instances. For every key frame, we consider 9 features ( l = 9) for our experiments.
As explained in the subsection d , multiple representatives are chosen for each sign to deal with variations using the concept of clustering and symbolic data analysis. An inconsistency coefficient is used during clustering. For various values of inconsistency coefficient, different number of clusters may be obtained. For some specific values of inconsistency coefficient, we obtain a significant change in the number of clusters. So, the inconsistency coefficient is empirically chosen to obtain different number of clusters for a class of sign and it depends on the intra-class variations of a sign. In our experiments, for a total number of sign videos, we obtained the significant change in the number of clusters for different values of inconsistency coefficients.
However, the number of clusters obtained for a particular class of sign may vary and it depends on the intra-class variations of signs in that class. Once the clusters are obtained for a class, the training and testing samples for that class is randomly selected and the class representatives are computed as described earlier in subsection d .
Several experiments are conducted for different percentages of training and testing. We have also repeated the experiments for 10 trails with random sets of training and testing samples. Table 7, 8 and 9 respectively show the percentage of recognition rate for various trails and for varying number of representatives with varying percentage (50:50, 60:40, 40:60) of training and testing samples. When we clustered 600 sign video samples using inconsistency coefficient values, we observed significant changes in the number of clusters only for few inconsistency coefficient values and only such significant number of clusters are considered for our experimental analysis. Thus in our experiments, we have considered three significant number of clusters obtained for various inconsistency coefficient values.
In all the experiments, we have observed that the accuracy in terms of precision, recall and F-measure is high for more number of cluster representatives and for 60:40 training and testing samples.
The performance of any classification / recognition system is measured in terms of its accuracy, precision, recall and F -measure and are defined as follows
Accuracy
CP + CN
NS
Precision
CP
CP +FP
Recall =
CP
CP+FN
( 2* Precision* Recall )
F - measure =
( Precision+Recall )
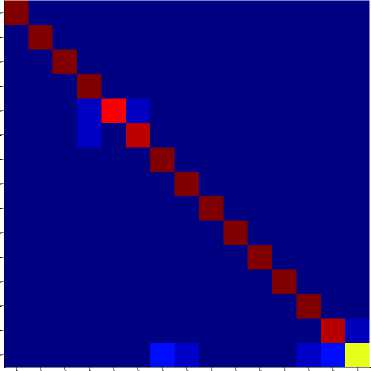
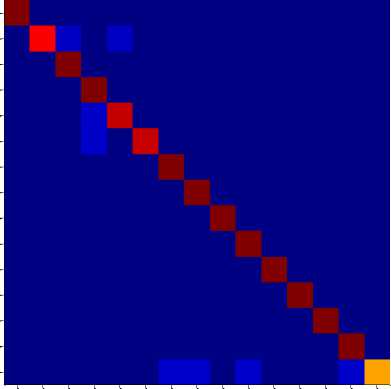
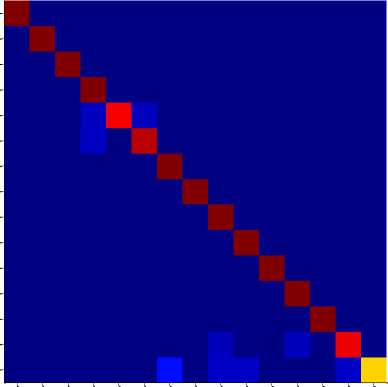
Fig. 9 to Fig. 11 shows the class-wise performance of the proposed sign recognition system interms of precision, recall and F-measure using confusion matrices. We have observed that the proposed method has shown good recognition rate for most of the signs. We have also observed from the experiment that more recognition rate has been achieved for more number of sign representatives. With this observation, we understand that more representatives are needed for a class when there are more intra-class variations in that class and hence the total sign representatives also increase for the entire sign database.
These measures are defined on the basis of correct positive (TP), correct negative (TN), false positive (FP) and false negative (FN) for the overall test samples (NS).
|
No. of Trails with random sets of training and testing |
No. of Sign Representatives |
||
|
243 |
174 |
154 |
|
|
1 |
94.83 |
92.20 |
87.87 |
|
2 |
95.94 |
89.53 |
88.88 |
|
3 |
93.90 |
89.87 |
89.22 |
|
4 |
94.46 |
89.49 |
89.89 |
|
5 |
94.83 |
90.84 |
87.87 |
|
6 |
95.93 |
89.53 |
89.22 |
|
7 |
95.20 |
89.49 |
87.87 |
|
8 |
94.46 |
89.53 |
89.89 |
|
9 |
93.90 |
89.87 |
87.87 |
|
10 |
94.83 |
92.20 |
88.88 |
|
Average Recognition Rate |
94.83 |
90.25 |
88.75 |
2 4 6 8 10 12 14
Target Class Labels
1.00
1.00
1.00
0.95
0.93
0.94
0.95
0.98
1.00
1.00
1.00
1.00
0.98
0.92
0.72
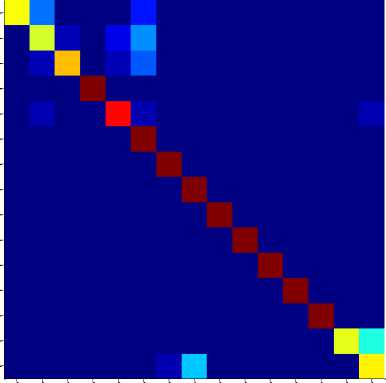
Fig.9(a). shows the confusion matrix for (50:50) training and testing samples with 243 sign representatives.
|
No. of Trails with random sets of training and testing |
No. of Sign Representatives |
||
|
243 |
174 |
154 |
|
|
1 |
96.74 |
91.95 |
89.53 |
|
2 |
95.52 |
92.33 |
91.69 |
|
3 |
96.74 |
91.18 |
88.75 |
|
4 |
95.52 |
89.65 |
87.98 |
|
5 |
95.12 |
90.80 |
88.37 |
|
6 |
95.52 |
91.95 |
89.14 |
|
7 |
96.74 |
92.33 |
89.92 |
|
8 |
95.12 |
91.18 |
87.98 |
|
9 |
95.93 |
90.80 |
89.14 |
|
10 |
96.74 |
91.95 |
88.37 |
|
Average Recognition Rate |
95.97 |
91.41 |
89.09 |
|
No. of Trails with random sets of training and testing |
No. of Sign Representatives |
||
|
243 |
174 |
154 |
|
|
1 |
90.51 |
90.50 |
87.30 |
|
2 |
93.08 |
88.60 |
88.54 |
|
3 |
91.09 |
86.77 |
89.16 |
|
4 |
93.08 |
88.29 |
88.85 |
|
5 |
93.16 |
86.77 |
88.54 |
|
6 |
93.08 |
88.60 |
87.30 |
|
7 |
93.16 |
88.29 |
89.16 |
|
8 |
94.30 |
88.92 |
88.54 |
|
9 |
94.71 |
89.87 |
88.85 |
|
10 |
91.09 |
86.77 |
87.30 |
|
Average Recognition Rate |
92.73 |
88.34 |
88.35 |
2 4 6 8 10 12 14
Target Class Labels
1.00
0.93
0.97
0.94
0.93
0.96
0.98
0.97
1.00
0.97
1.00
1.00
1.00
0.97
0.83
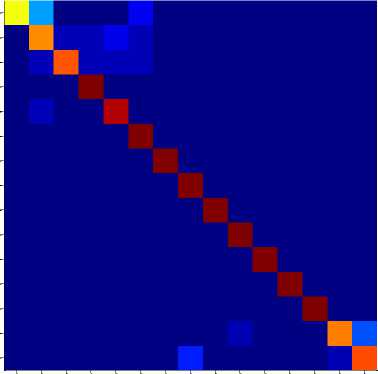
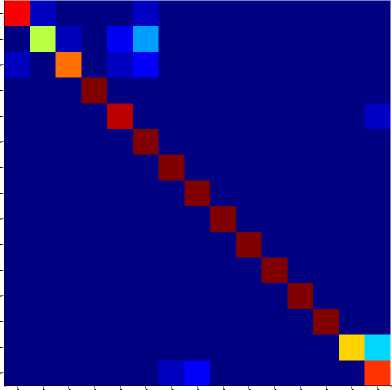
Fig.9(b). shows the confusion matrix for (60:40) training and testing samples with 243 sign representatives

2 4 6 8 10 12 14
Target Class Labels
1.00
1.00
1.00
0.95
0.94
0.94
0.95
1.00
0.95
0.98
1.00
0.98
1.00
0.91
0.80
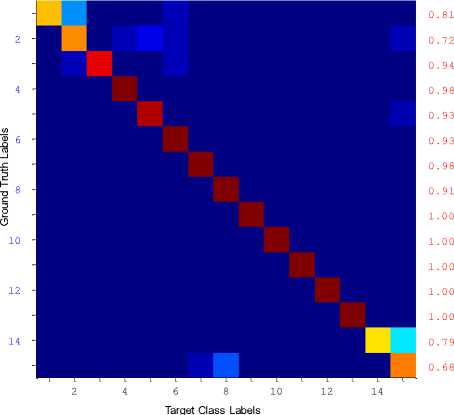
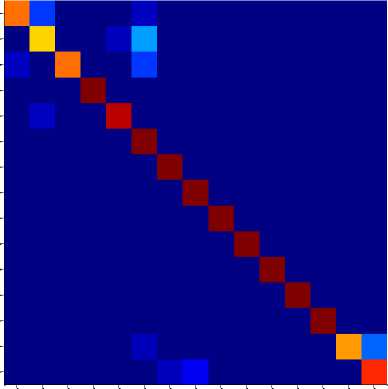
Fig.10(c). shows the confusion matrix for (40:60) training and testing samples with 174 sign representatives.
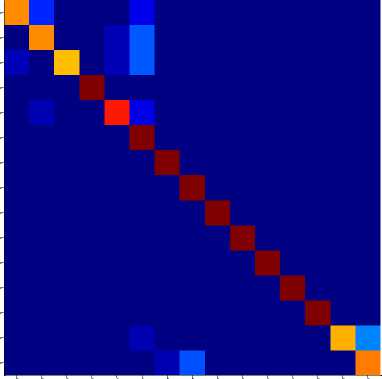
Fig.9(c). shows the confusion matrix for (40:60) training and testing samples with 243 sign representatives.
2 4 6 8 10 12 14
Target Class Labels
0.76
0.70
0.86
0.95
0.90
0.90
1.00
0.93
1.00
0.98
1.00
1.00
1.00
0.83
0.80
2 4 6 8 10 12 14
Target Class Labels
0.82
0.76
0.81
1.00
0.87
0.77
0.98
0.91
1.00
1.00
1.00
1.00
1.00
0.82
0.75
Fig.10(a). shows the confusion matrix for (50:50) training and testing samples with 174 sign Representatives.
Fig.11(a). shows the confusion matrix for (50:50) training and testing samples with 154 sign representatives.
2 4 6 8 10 12 14
Target Class Labels
0.84
0.71
0.87
1.00
0.94
0.76
0.98
0.95
1.00
1.00
1.00
1.00
1.00
0.84
0.81
2 4 6 8 10 12 14
Target Class Labels
0.76
0.59
0.79
1.00
0.87
0.77
0.98
0.86
1.00
1.00
1.00
1.00
1.00
0.75
0.62
Fig.10(b). shows the confusion matrix for (60:40) training and testing samples with 174 sign representatives.
Fig.11(b). shows the confusion matrix for (60:40) training and testing samples with 154 sign representatives. .
2 4 6 8 10 12 14
Target Class Labels
0.90
0.69
0.84
1.00
0.88
0.80
0.98
0.95
1.00
1.00
1.00
1.00
1.00
0.80
0.74
Fig.11(c). shows the confusion matrix for (40:60) training and testing samples with 154 sign representatives.
-
V. Conclusion
In this work, we have proposed a method of representing and recognizing signs used by communication impaired people at sentence level. The proposed method exploits the concept of symbolic data analysis for handling variations resulting in the same sign made by different signers or by the same signer at different instances due to many practical reasons. The proposed symbolic representation technique effectively reduces the number of reference sign samples needed to train the system when compared to conventional crisp representation techniques. Thus, the proposed method has a comparable computational and storage efficiency with respect to the state of the art systems for classification of sign language, which use conventional representation. Experiments are conducted on the database created by us with the support of communication impaired people of Mysore region. Experimental results are more encouraging for the data set considered. However, we need to evaluate the performance of the proposed method for more complicated and large database, which will be our future work. It is also observed that the sign made by the communication impaired people of different regions and even from person to person in some cases have shown large variations in terms of number of frames captured and also the hand movements. It is very challenging for machine vision applications to address all the issues when signs are captured in unconstrained environment. Hence, it is very much essential to standardize the signs for machine learning applications. In view of this, we plan to create a large database of signs, which will be standardized and made publically available for the research community.
Acknowledgement
We would like to thank the students and the teaching staff of Sai Ranga Residential Boy’s School for Hearing Impaired, Mysore, and N K Ganpaiah Rotary School for physically challenged, Sakaleshpura, Hassan, Karnataka, INDIA, their immense support in the process of UoM-ISL Sign language data set creation.
References Symbolic Representation of Sign Language at Sentence Level
- Bahare Jalilian, Abdolah Chalechale,: Persian Sign Language Recognition Using Radial Distance and Fourier Transform", IJIGSP, vol.6, no.1, pp.40-46, 2014.DOI: 10.5815/ijigsp.2014.01.06
- Ding L, Martinez AM.,: Modeling and Recognition of the Linguistic Components in American Sign Language. Image Vis Comput 27(12) : 1826-1844. Nov, 2009.
- Dorner.,: Hand shape identification and tracking for sign language interpretation. In IJCAI Workshop on Looking at People. 1993.
- Guru D. S. and Nagendraswamy H.S.,: Symbolic representation of two-dimensional shapes. Pattern Recognition Letters. Jan, 2007.
- Helen Cooper, Eng-Jon Ong, Nicolas Pugeault and Richard Bowden.,: Sign Language Recognition using Sub-Units. Journal of Machine Learning Research 13 (2012) 2205-2231.2012.
- Joyeeta Singha and Karen Das: Recognition of Indian Sign Language in Live Video. International Journal of Computer Applications (0975 – 8887) vol 70– No.19, May 2013.
- Justus Piater, Thomas Hoyoux and Wei Du.,: Video Analysis for Continuous Sign Language Recognition. 4th Workshop on the Representation and Processing of Sign Languages: Corpora and Sign Language Technologies, 2010 (Workshop at the 7th International Conference on Language Resources and Evaluation (LREC), (Malta). 2010.
- Mohan Kumar H P, Nagendraswamy H S,: Change Energy Image for Gait Recognition: An Approach Based on Symbolic Representation", IJIGSP, vol.6, no.4, pp.1-8, 2014.DOI: 10.5815/ijigsp.2014.04.01
- Nagendraswamy H. S., Guru D. S., : A New Method of Representing and Matching Two Dimensional Shapes. Int. J. Image Graphics 7(2) : 377-405. 2007.
- Naresh Y. G. and Nagendraswamy H. S.,: Representation and Classification of Medicinal Plant Leaves: A Symbolic Approach. Multimedia Processing, Communication and Computing Applications, Lecture Notes in Electrical Engineering Volume 213, 2013, pp 91-102. 2013.
- Nayak, S, Sarkar S., and Loeding B.,: Automated extraction of signs from continuous sign language sentences using Iterated Conditional Modes. Computer Vision and Pattern Recognition, 2009. pp- 2583 – 2590. 2009.
- Richard Bowden, David Windridge, Timor Kadir, Andrew Zisserman and Michael Brady.,: A Linguistic Feature Vector for the Visual Interpretation of Sign Language.
- Ruiduo Yang and Sudeep Sarkar.,: Handling Movement Epenthesis and Hand Segmentation Ambiguities in Continuous Sign Language Recognition Using Nested Dynamic Programming. IEEE transactions on pattern analysis and machine intelligence, vol. 32, no.3, pp 462-477. 2010.
- Suraj M. G. and Guru D. S.,: Appearance Based Recognition Methodology for Recognizing Fingerspelling Alphabets. IJCAI 2007: 605-610, 2007.
- Suraj M.G. and Guru D. S.,: Secondary Diagonal FLD for Fingerspelling Recognition. ICCTA 2007: 693-697, 2007.
- Sylvie C W Ong and Surendra Ranganath.,: Automatic Sign Language Analysis: A Survey and the future beyond lexical meaning. IEEE transaction on Pattern Analysis and Machine Intelligence, vol 27, no 6, 2005.
- Tsai, D.M., Chen, M.F., Object recognition by linear weight classifier. Pattern Recognition Letters. 16 : 591–600. 1995.
- Tan Dat Nguyen and Surendra Ranganath.,: Recognizing Continuous Grammatical Marker Facial Gestures in Sign Language Video. Proceeding ACCV'10 Proceedings of the 10th Asian conference on Computer vision – vol., Part IV pp 665-676 Springer-Verlag Berlin, Heidelberg , 2011.
- Thad Starner, Joshua Weaver, and Alex Pentland.,: Real-Time American Sign Language Recognition Using Desk and Wearable Computer Based Video. IEEE Transactions on Pattern Analysis and Machine Intelligence ,vol., 20, pages 1371—1375.1998
- Pingale Prerna Rambhau.,: Recognition of Two Hand Gestures of word in British Sign Language (BSL) ., IJSRP, Vol 3, Issue 10, October 2013 .
- Wu jiangqin, Gao wen, Song yibo, Liu wei and Pang bo.,: A simple sign language recognition system based on data glove , Fourth International Conference on Signal Processing Proceedings, 1998.
- Jiangqin Wu and Wen Gao.,: The Recognition of Finger-Spelling for Chinese Sign Language. International Gesture Workshop on Gesture and Sign Languages in Human-Computer Interaction (GW '01), Springer-Verlag,
- Saengsri S. Niennattrakul V. and Ratanamahatana C.A.,: TFRS: Thai finger-spelling sign language recognition system, Digital Information and Communication Technology and it's Applications (DICTAP), Second International Conference on DICTAP , pp.457,462,2012.
- Starner T.,: Visual Recognition of American Sign Language Using Hidden Markov Models, Master Thesis, MIT, Media laboratory. Feb.1995.
