Sympathetic Skin Response: A New Biological Signal that can be used in Diagnosis of Fibromyalgia Instead of Beck Depression Inventory

Автор: Muhammed Kürşad Uçar, Mehmet Recep Bozkurt, Ferda Bozkurt
Журнал: International Journal of Image, Graphics and Signal Processing(IJIGSP) @ijigsp
Статья в выпуске: 7 vol.8, 2016 года.
Бесплатный доступ
Fibromyalgia is a chronic pain syndrome that generally appears with prevalent muscular pain, sleep disorder and fatigue. Its diagnosis is very difficult. It is diagnosed in a long time after evaluating variety of psychological test scores along with physiological and laboratory tests. Psychological tests are thought not to be as reliable as laboratory test results since they depend on oral reports of the patients, and can differ from patient to patient. Beck depression inventory is one of the psychological test scores. In this study, a new biological signal that could be used instead of Beck depression inventory is introduced. For this purpose, sympathetic skin responses were used along with physiological and laboratory test results that were collected both from diagnosed fibromyalgia patients and healthy patients. A relationship based on classification was aimed to be established between the data and Beck depression inventory by using artificial neural networks. Three different artificial neural network training algorithm were used in the study. According to the results, physiological and laboratory test results and back depression inventory were estimated with the accuracy rate of 77.70\%. When all the data were used with Levenberg-Marquardt back propagation training algorithm, this rate went up to 90.91\%. According to these results, sympathetic skin responses can be safely used instead of Beck depression inventory when they were used along with other parameters that were used in fibromyalgia diagnosis.
Biomedical signal processing, Fibromyalgia syndrome, Beck depression inventory, Artificial neural networks, Sympathetic Skin Response
Короткий адрес: https://sciup.org/15013994
IDR: 15013994
Текст научной статьи Sympathetic Skin Response: A New Biological Signal that can be used in Diagnosis of Fibromyalgia Instead of Beck Depression Inventory
Published Online July 2016 in MECS DOI: 10.5815/ijigsp.2016.07.04
-
I. Introduction
According to the description that was made by International Ache Research Foundation in 1979, “Aching is an organic or non-organic, unpleasant feeling that arises from any part of the body that contains all the experiences of the person.” Aches can be sorted into two groups. The first is the acute ache that comes as the indicator of variety of illnesses and tissue injuries. The second group is the chronological ache which last at least
-
3 months and becomes an illness itself rather than being an indicator of it. According to recent studies, it is estimated that chronic ache is related to the autonomic neural system [1].
Fibromyalgia Syndrome (FMS) is a chronic ache syndrome that generally appears with wide muscle skeletal system ache, fatigue and sleep disorder [2]. It basically affects muscles and the areas where the muscles stick to the bones. Women are more likely to suffer this illness. It was in recent years concluded, not definitely, that FMS may be related with Autonomic Nervous System (ANS) [3]–[7].
FMS is diagnosed based on the criteria which were defined by the American College of Rheumatology (ACR) in 1990. According to these criteria, in order to diagnose a patient with FMS, there must be at least 3 years of aching in the left half of the body, right half of the body, below the waist and in the upper waist; and when pressed with finger [palpation], there must be a local ache in at least 11 of the 18 sensitive areas [5], [8]. Also, psychological tests that are related to FMS, the blood samples that were taken from the patient in the laboratory, and physiological test results support diagnosis of FMS [5]. However, since the psychological tests depend on the psychological states of the patients, the reliability of the tests are debated.
Biological indicators occur as a result of various functions that arise in different systems in the body. It is impossible to understand these indicators directly. They contain complicated information about the events that develop in the human body. These indicators must be examined in order to be understood. Today, one of the most important advantages of the biological indicators is that they can be interpreted by using computer programs without any mathematical models and can be used as diagnosis of the illnesses [9]–[12]. The process of interpretation of biologic indicators that are used in this study was accomplished by artificial neural network (ANN).
Sympathetic skin response (SSR) is the momentary and non-permanent electro dermal activity (EDA) in the skin, which emerges as a result of the stimulation of the skin by an inner or outer stimulator. Sympathetic skin response is a skin potency change that can vary according to situations like dysfunction of an organ or a system, deformation etc [5]. The studies showed that there is a relationship between sympathetic skin response and autonomic nerve system [5], [13], [14].
-
A. Sympathetic Skin Response, Fibromyalgia Syndrome and Autonomic Nerve System Relationship
In a study which examines SSR change in patients with FMS, it was found that the delay time parameter on the SSR stimulator that was recorded from the palms and soles of the patients was longer than healthy people [6].
In another study it was shown that there may be a connection between The Hamilton Anxiety Rating Scale [HAM-A] -one of the psychological test used in FMS-and SSR [7].
In another study, the relationship between SSR and autonomic nerve system was examined on psychosis patients and the relationship between SSR and psychosis in healthy individuals was rated 82% while this rate is 100% in patients [15].
Ahuja et. Al., in a study in 2003, thought that SSR indicators could be analyzed better using computer programs and concluded that SSR indicators could be used in diagnosis of psychological and psychiatric illnesses that affect the autonomic nerve system [1].
Çakır et. Al. performed electroneuromyographic examination of sympathetic skin response and F wave in order to specify whether there is autonomic dysfunction in fibromyalgia syndrome or not. In the study, it was detected that patients with FMS, in both sides, have higher SSR amplitude value and lower latency value when compared to the control group. This study supports the existence of a variable that shows autonomic dysfunction in the sympathetic nerve system of patients with FMS [16].
In a study that examines sensitive points and relationships with the psychological conditions of a patience with fibromyalgia, relationship between sensitive points and psychological distress, especially somatization, was detected [17].
In fibromyalgia, autonomic nerve system dysfunctions such as sympathetic hyperactivity, parasympathetic hypoacidity, and decline in the sympathetic response can be seen frequently [2]. However, these disorders are not uniquely tied to fibromyalgia and can be seen in many patients who suffer from chronic pain.
In addition to these studies, in the study of Özhan et. Al. in 2012, the relationship between FMS and SSR was examined in detail and it was stated that SSR could be used in diagnosing FMS [3], [5], [18], [19].
-
II. Material and Method
The database used in this study was created under the coverage of the research project which is supported by TÜBİTAK and titled "The evaluation of the HRV, SSR and psychological tests using wavelet transformation and artificial neural networks and determination of the relationships regarding the diagnosis of fibromyalgia."
The database used in this study was established in
Süleyman Demirel University Faculty of Medicine, Department of Physical Medicine and Rehabilitation. The database consists of SSR measurements, laboratory and physiological test results which were collected from 57 FMS patients -who were diagnosed based on ACR 1990 criteria- and 29 healthy participants.
The limit values of the some parameters that are effective on SSR (age, height, weight) needs to be determined before the SSR measurements are obtained in order to make the measurements much more meaningful [3]. In the research, great attention was paid in order to have the subjects' age, weight and height ranges in these limits. The subjects were chosen to be in the range of ages between 20-66, 149-186 cm height and 47-105 kg's of weight.
The related parameters were obtained from the subjects by using a measurement system consisting of finger electrodes and stimulants. For the stimulus, a 20 µ A of passage current was induced on the FMS patients and healthy subjects via electrodes, and the temporary potential changes in the skin originated as a result of this current value were recorded. As a result of the analysis of the recorded values done with Matlab, the SSR response delay time, maximum amplitude and the time period between the two excitations were obtained [4], [5], [20], [21].
-
A. Artificial Neural Network Analysis Parameters
In the classifying process that was substantiated in the study, SSR parameters, laboratory test results and physiological test results are used as the input data. For the SSR parameters; the response delay period (SSRLt), maximum amplitude (SSRMaxA) and the time period between the two excitations (SSRTT) were used. For the laboratory test results, C reactive protein test (CRP), rheumatoid factor (RF), white blood cell count (SEDIM), sedimentation test (WCC), hemoglobin count (HG) and hemoglobin platelet (thrombolytic) were used. For the physiological test results; skin temperature, pulse and respiratory rates were used. Back depression inventory values, which are one of the psychological test score, was used as the output data.
-
1) Sympathetic Skin Response Parameters
-
a) Sympathetic skin response response delay period (SSRLt): In the studies related to the examination of SSR parameters, the most used parameter is the response delay period. It is seen, thanks to the studies, that the most meaningful results are obtained from this parameter [5]. As shown in the Fig. 1, when determining the starting point of the SSR response delay, stimulus ending point is used as a base. The time that passes by starting from the introducing the stimulus to the skin and its spreading through the skin to obtaining the response via the electrodes is considered as the delay period.
-
b) Maximum Amplitude (SSRMaxA): In the studies where the SSR measurements are used, another parameter is amplitude values obtained from the
SSR waveforms. However, in our study, the maximum amplitude is used. The abrasion in the area as a result of the stimulations induced and the fact that body gets used to the stimulus induced, the amplitude values gets diminished. Thus, the maximum amplitude values were chosen.
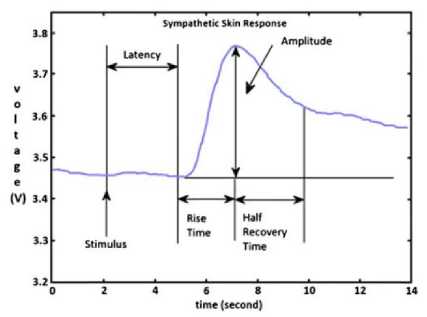
Fig.1. An Example Sympathetic Skin Response Waveform [5]
-
c) Time period between the two excitations (SSRTT): This parameter was defined as the time which passes between the time the impact is made for the SSR measurement and the second impact following the first one.
-
2) Laboratory test results (Lab)
The laboratory data parameters and the normal value ranges used in the study are shown in Table 1.
Table 1. Reference Ranges for Blood Tests in Healthy Adults
|
Test Name |
Abridgment |
Normal Ranges |
|
C reactive protein test |
CRP |
0 - 3 mg / l |
|
Rheumatoid factor |
RF |
0 - 15 IU / ml |
|
Sedimentation test |
SEDIM |
Varies according to age and sex 7 — 25 mm / s |
|
White blood cell count |
WBC |
5.2 x 10³ — 12.4 x 10³ pl |
|
The amount of Hemoglobin |
HG |
13.6 — 17.2 g / dl |
|
Hemoglobin platelet (trombosit) |
PLT |
156.10 3 — 373.10 3 pl |
0-13 : No depression
13-24 : Moderate depressive symptoms
24-63 : Intense depressive symptoms [5]
In the research, a total of 42 data between the range 013, a total of 40 data between the range of 13-24 and a total of 4 data between the ranges of 24-63 is existent. As the classifying process cannot be carried out with the low number of "4" between the ranges of 24-63, it was combined with the data from the range of 13-24 and they were used in conjunction. Carrying out operations with low data numbers reduce the accuracy rates, thus; they are not considered to be healthy procedures. In the research, BDI was defined as ANN outputs.
We can summarize the parameters used for the classifying process as shown in Table 2.
Table 2. Parameters used for the Classification
|
Neural Network Output Parameters |
Neural Network Input Parameters |
|||
|
Psychological state assessment tests |
Sympathetic Skin Response |
Physiological Test |
Laboratory Test |
|
|
s 55 P^ S 5 *« Ы |
VERBAL |
SSRLt |
Skin Temperature |
CRP |
|
0: No pain
|
SSRMaxA |
Pulse |
RF |
|
|
SSRTT |
Respiratory Rate |
SEDIM |
||
|
WBC |
||||
|
HG |
||||
|
PLT |
||||
-
III. Artificial Neural Networks
The structure made up of neurons clustered together in order to process the data moving from the point of the most basic biological neural networks is called artificial neural network. This structure is made up of one-way channels for the data to be processed and elements that are connected to each other.
There are three types of networks: Feed-forward network, cascade connection network, feedback network. The cascade connection network is the mono or multilayer network type that has at least one feedback connection with another layer that comes before it [22]. The feedback network is the network type in which at least a cell feeds off of another layer that comes after it [23], [24].
-
A. Multi-Layer Feed-Forward Neural Networks
The feed forward network that we used in our analysis procedures is the network type in which the cells in the layers only feed off of the cells that comes one layer before it. In this structure that is created to carry out a specific duty, there are three basic layers. These layers are: input layer, intermediary layer and output layer. The data comes in through the input layer and goes through the intermediary and output layers in one-way step by step [25]. It has a very complicated internal structure. As shown in the Fig.2., it is a structure made of up several layers [10], [11], [14], [26].
The working principles of the network are as follows:
The information given from the outside is first entered into the input layer. There is a neuron for every single input. Generally, data processing does not take place in this layer. The information received is transmitted to the intermediary layer. The data processing takes place in the intermediary layer.
Input Layer Hidden Layer Output Layer
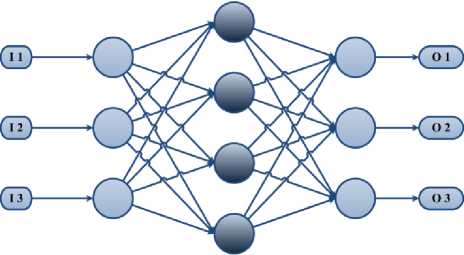
Fig.2. Structure of Artificial Neural Network
The intermediary layer is a layer that is made up of one or more layers and where the information is essentially processed [11]. It can be referred as the hidden layer most of the time. This layer has a single neuron for every situation in the training set. These neurons contain the predictor variable's values in the process of meeting the desired value. The values obtained as a result of the mathematical calculations are transmitted to the neurons in the output layer. In the output layer, the weighted values are compared that are collected in the intermediary layer. The most weighted predictor value is produced as the output for the relevant category.
These types of ANN's work according to the teacher based learning strategy and the back-propagation learning algorithm is widely used in its training [19], [27]. In our research, the most widely used Levenberg-Marquardt backpropagation (LM), Resilient backpropagation (RP) and Scaled conjugate gradient backpropagation (SCG) were used. These types of ANN's work according to the teacher based learning strategy and the back-propagation learning algorithm is widely used in its training.
The artificial neural network used in the simulation is shown in Fig. 3. Input data count was used as 3-6-9-12 according to the count of the data. The hidden layer count was tuned to maximum of 3 according to performance.
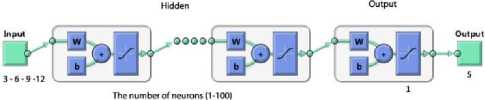
Fig.3. Structure of the Artificial Neural Network \label{ysa}
-
B. Training function
-
1) Levenberg-Marquardt backpropagation
It is a structure that is most used in ANN and it is based on Newton and back propagation algorithm. The input data are transmitted to output layer by going through the hidden layer and it comes out as output after that. The error rate is determined by comparing the output and the real values. The derivative of the error rate is transmitted to the hidden layer again, and it tries to decrease the error rate by altering the weight values of the neurons [26]. The error rate is calculated with the least squares method. Thus, it is ensured that the weight values are altered in a way that can increase the performance rates. However, when examined regarding its speed, this advantage slows ANN down.
The purpose of the algorithm is to obtain the Hessian matrix that is obtained with the second degree derivative according to the weight values of the performance function.
In this expression, H symbolizes the Hessian matrix, ц symbolizes the Marquardt parameter and I symbolizes the unit matrix. J symbolizes the first order derivative according to the weights of the network errors of Jocobian matrix.
H ( n ) = J T ( n ) J ( n ) + Ц т1 (1)
J ( n ) =
d e ( n ) d w ( n - 1)
In this expression, e symbolizes the network errors vector. The gradient of the network is calculated in this way, g ( n) = JT ( n) e ( n)
And the equation is obtained according to (4) [19].
w ( n + 1) = w ( n ) - [ H ( n )] 1 g ( n )
In the each step of the process of determining the error value, the value of ц is decreased. The purpose of this is to calculate the weight value which will render the performance function as the smallest [19].
-
2) Resilient backpropagation
It has a multi-layer network structure. It is used more together with the sigmoid and hyperbolic threshold functions. As these functions limit the infinite input range to a finite output range, they are also known as limiting functions. As the neuron count of the structure increases, the gradient of the function also approaches zero.
The purpose of the algorithm is to reduce the negative effects of the partial derivative [28]. The signal of the partial derivative is used in order to determine the direction of updating the weights. The numerical value found has no effect. The alteration is determined with a different updating. If the derivate of the error functions according to weights are marked the same in both steps, the updating process is enhanced with the help of a factor. If the marks are different, it is decreased with the help of a factor. If the value of the derivative is 0, the updating value will stay the same [28]. The weight change directions are symbolized with A^ in the Equation (5), and the amount of the change is shown in the Equation (6) [22]. The most important advantage of this algorithm is its quick adaptability.
-A
d E
В w
A w y = ‘
. 5 E
+A,,----< 0
* d w ,
-
3) Scaled conjugate gradient backpropagation
Most of the frequently used feed forwarding training algorithms are based on the gradient decreasing algorithms. As the parameters are often determined by the user specifically in these algorithms, they have a poor convergence rate. The detailed calculation methods of the values and the parameters used for this method are explained in Møller (1993) [29] and Williams (1991) [30].
Most of the frequently used feed forwarding training algorithms are based on the gradient decreasing algorithms.
-
IV. Results
In the research, in order to evaluate the psychological test scores by using the parameters that are related to fibromyalgia syndrome, they are examined by analyzing them electronically with ANN in MATLAB; and the accuracy rates were calculated and examined.
The neuron counts of 1-100 in certain gaps for different algorithms were used during the analysis with ANN, and when the appropriate outcomes are obtained, it was cut and recorded. Furthermore, the efficiency of the hidden layer count in the multi-layer network was received as one, two or three according to the situation regarding its efficiency.
The database consisting of 86 patients of whom 29 are healthy and 57 are ill, were separated into two parts as approximate 75% training set and 25% test set. The training set consisted of 64 patients of whom 21 are healthy and 43 are ill. The test set consisted of 22 individuals of whom 14 are ill and 8 are healthy.
The accuracy rates of the simulations were calculated using the formula stated below. After all the accuracy rates in all the simulations are received as 100%, the test data were processed.
The number of subjects found
% Accuracy =-----------------------x100
Total number of subject
The parameters and training algorithms that were used in the simulations and test data are shown in the Table 3. According to this, 3 different simulations in 3 different training algorithms carried out as Levenberg-Marquardt backpropagation, resilient backpropagation and scaled conjugate gradient backpropagation. Every parameter that are used for each training algorithm were taken into the simulation one by one. For instance, in the simulation done with Levenberg-Marquardt backpropagation in the second column, the physiological test data was used first. After that, the classification process was carried out by adding the SSR parameters on top and the effect of SSR was observed. In the third step, the laboratory test results were used alone. As done in the second step, the classification process was carried out by adding the SSR parameters on top the laboratory test data, and the effect of the SSR was observed. In the fifth step of the procedure, the physiological test data and the laboratory test data was used together. After that, the SSR parameters were added on top of this data and the effect of the SSR was examined.
Table 3. Classification Process Steps
|
Class |
VERBAL (five class) |
||
|
Classification Algorithm |
MLFFNN |
PNN |
RBFNN |
|
Parameters, datas |
SSR |
SSR |
SSR |
|
Phys |
Phys |
Phys |
|
|
Phys + SSR |
Phys + SSR |
Phys + SSR |
|
|
Lab |
Lab |
Lab |
|
|
Lab + SSR |
Lab + SSR |
Lab + SSR |
|
|
Phys + Lab |
Phys + Lab |
Phys + Lab |
|
|
Phys + Lab + SSR |
Phys + Lab + SSR |
Phys + Lab + SSR |
|
In the Table 4, the simulation results that are obtained according to the LM training algorithm are shown. According to this, the training set was trained with 43 ill and 21 healthy individuals. After the training is complete, the analysis of the physiological test data was carried out with ANN. The accuracy rate in this simulation was 77.27%. Of the 14 ill individuals that are used in the test, 10 were categorized correctly and 4 were incorrectly categorized and the accuracy rate was 71.43%. Of the 14 healthy individuals, 7 of them were categorized correctly and 1 of them were categorized incorrectly and the accuracy rate was 87.50%. When the SSR parameters were added on top of the physiological test results, the accuracy rate increased. While the accuracy rate obtained with the laboratory test results was 72.73%, the accuracy rate increased to 77.27% when the SSR parameters were added. The accuracy rate obtained in the simulation where the physiological and the laboratory test results are used together is 77.27%. This rate increased to 90.91% when the SSR parameters were added.
In the Table 5, the results obtained according to the RP training algorithm; and in the Table 6, the results obtained according to the SCG training algorithm are shown.
Table 4. Classification Results of BDI According to LM Training Algorithm
|
Training |
P |
H |
A |
||||
|
P |
43 |
0 |
100 |
||||
|
H |
0 |
21 |
100 |
||||
|
M |
100 |
||||||
|
Test |
Phys |
Phys + SSR |
|||||
|
P |
H |
A |
P |
H |
A |
||
|
P |
10 |
4 |
71.43 |
12 |
2 |
85.71 |
|
|
H |
1 |
7 |
87.50 |
2 |
6 |
75.00 |
|
|
M |
77.27 |
81.82 |
|||||
|
Lab |
Lab + SSR |
||||||
|
P |
H |
A |
P |
H |
A |
||
|
P |
10 |
4 |
71.43 |
10 |
4 |
71.43 |
|
|
H |
2 |
6 |
75.00 |
1 |
7 |
87.50 |
|
|
M |
72.73 |
77.27 |
|||||
|
Phys + Lab |
Phys + Lab + SSR |
||||||
|
P |
H |
A |
P |
H |
A |
||
|
P |
11 |
3 |
78.57 |
14 |
0 |
100.00 |
|
|
H |
1 |
7 |
87.50 |
2 |
6 |
75.00 |
|
|
M |
77.27 |
90.91 |
|||||
P Patient, H Healty, A Accuracy (%), M Mean
Table 5. Classification Results of BDI According to RP training Algorithm
|
Training |
P |
H |
A |
||||
|
P |
43 |
0 |
100 |
||||
|
H |
0 |
21 |
100 |
||||
|
M |
100 |
||||||
|
Test |
Phys |
Phys + SSR |
|||||
|
P |
H |
A |
P |
H |
A |
||
|
P |
10 |
4 |
71.43 |
12 |
2 |
85.71 |
|
|
H |
1 |
7 |
87.50 |
3 |
5 |
62.50 |
|
|
M |
77.27 |
77.27 |
|||||
|
Lab |
Lab + SSR |
||||||
|
P |
H |
A |
P |
H |
A |
||
|
P |
10 |
4 |
71.43 |
10 |
4 |
71.43 |
|
|
H |
1 |
7 |
87.50 |
1 |
7 |
87.50 |
|
|
M |
77.27 |
77.27 |
|||||
|
Phys + Lab |
Phys + Lab + SSR |
||||||
|
P |
H |
A |
P |
H |
A |
||
|
P |
12 |
2 |
85.71 |
13 |
1 |
92.86 |
|
|
H |
2 |
6 |
75.00 |
2 |
6 |
75.00 |
|
|
M |
86.36 |
86.36 |
|||||
P Patient, H Healty, A Accuracy (%), M Mean
In the Table 7, the summary of the results obtained with the LM, RP and SCG training algorithms is shown.
In the Table 8 and 9, the comparison of the outputs of the simulations are shown. In the Table 8, the physiological test data and simulation output values that are carried out with SSR parameters, in Table 9, the laboratory test results and the simulation output values that are carried out with SSR parameters, and in Table 8 and Table 9, the physiological test results, laboratory results and the simulation output values that are carried out with the SSR parameters are shown. The groups represent the fact of whether or not the individual is healthy or sick, and the arrays show the numbers that are designated to individuals. The BDI columns is the reference output values for our training set. The output values for the simulations that are carried out with the LM, RP and SCG training algorithms are shown in the columns. The values that are invalid for the reference output are marked with gray color.
Table 6. Classification Results of BDI According to SCG Training Algorithm
|
Training |
P |
H |
A |
||||
|
P |
43 |
0 |
100 |
||||
|
H |
0 |
21 |
100 |
||||
|
M |
100 |
||||||
|
Test |
Phys |
Phys + SSR |
|||||
|
P |
H |
A |
P |
H |
A |
||
|
P |
8 |
6 |
57.14 |
11 |
3 |
78.57 |
|
|
H |
0 |
8 |
100.00 |
2 |
6 |
75.00 |
|
|
M |
72.73 |
77.27 |
|||||
|
Lab |
Lab + SSR |
||||||
|
P |
H |
A |
P |
H |
A |
||
|
P |
8 |
6 |
57.14 |
10 |
4 |
71.43 |
|
|
H |
2 |
6 |
75.00 |
2 |
6 |
75.00 |
|
|
M |
63.64 |
72.73 |
|||||
|
Phys + Lab |
Phys + Lab + SSR |
||||||
|
P |
H |
A |
P |
H |
A |
||
|
P |
9 |
5 |
64.29 |
14 |
0 |
100.00 |
|
|
H |
1 |
7 |
87.50 |
3 |
5 |
62.50 |
|
|
M |
72.73 |
86.36 |
|||||
P Patient, H Healty, A Accuracy (%), M Mean
Table 7. Comparison of the Training Algorithm Outputs \label{ozet}
|
LM |
RP |
SCG |
|
|
Accuracy |
Accuracy |
Accuracy |
|
|
(%) |
(%) |
(%) |
|
|
Phys |
77.27 |
77.27 |
72.73 |
|
Phys+SSR |
81.81 |
77.27 |
77.27 |
|
Lab |
72.72 |
77.27 |
63.64 |
|
Lab+SSR |
77.27 |
77.27 |
72.73 |
|
Phys+Lab |
81.81 |
86.36 |
72.73 |
|
Phys+Lab+SSR |
90.9 |
86.36 |
86.36 |
-
V. Discussion and Conclusion
In this research the determination of parameters that can be alternatives for the psychological test scores that are taken into consideration in the diagnostics of fibromyalgia syndrome and the increase in the accuracy of the parameters were aimed. The parameters that are analyzed in ANN were processed with different combinations and different training algorithms in the researches done with this aim. With the usage of different training algorithms, the increase in the accuracy rates was ensured. The best training algorithms were determined as LM and SCG.
In diagnosing the illnesses, as only one test data is not used generally, the simulations that are substantiated by using all the test data. As it is summarized in Table 7, the SSR parameters created a positive response in the physiological test results for the LM and SCG training algorithms and the test results obtained in the laboratory, and increased their accuracy. When all the data was used together, it was calculated as 90.90% for LM, 86.36% for RP and 86.36% for SCG. It was found out that when SSR and other test data were used together and analyzed using computer software, they are much more meaningful and interpretable. This result also fits with the previous research results [1], [12].
The success rates obtained for LM, RP, SCG shows that there is a relationship between BDI and SSR and other test results. In the research conducted by Özgöçmen and his colleagues, it was stated that there may be a relationship between SSR and Hamilton Anxiety Rating Scale (HAM-A) which is a psychological test score used in FMS [7]. The result of our research supports this finding. Our research can be considered as an intermediary study to find out the relationships between other psychological test scores and biological indicators. It sheds light on the previous studies and paves the way for the future ones.
The accuracy rates can be increased by adding the new parameters of SSR to simulations by extracting them and using different analysis methods. The biggest disadvantage of the researches was the combination of the two distinct groups at the exit as a result of the data count. In order to compensate for this, the count of the training and the test data can be increased and better results can be obtained.
Table 8. Comparison of the Input and Output Values of Physiological Test, Lab Test Results and SSR Data Based on Algorithms
|
Group |
No |
BDI |
Phys |
Phys +SSR |
Lab |
Lab+SSR |
|||||||||||
|
LM |
RP |
SCG |
LM |
RP |
SCG |
LM |
RP |
SCG |
LM |
RP |
SCG |
||||||
|
Healty |
26 |
1 |
1 |
1 |
1 |
1 |
1 |
1 |
2 |
1 |
2 |
1 |
1 |
1 |
|||
|
Healty |
27 |
1 |
1 |
1 |
1 |
2 |
2 |
1 |
1 |
1 |
1 |
1 |
1 |
2 |
|||
|
Healty |
28 |
1 |
1 |
1 |
1 |
1 |
1 |
1 |
2 |
1 |
2 |
1 |
2 |
1 |
|||
|
Healty |
19 |
1 |
1 |
1 |
1 |
2 |
2 |
2 |
1 |
1 |
1 |
1 |
1 |
2 |
|||
|
Healty |
23 |
1 |
1 |
1 |
1 |
1 |
1 |
1 |
1 |
1 |
1 |
1 |
1 |
1 |
|||
|
Healty |
25 |
1 |
1 |
1 |
1 |
1 |
1 |
1 |
1 |
1 |
1 |
1 |
1 |
1 |
|||
|
Healty |
29 |
1 |
1 |
1 |
1 |
1 |
2 |
1 |
1 |
2 |
1 |
2 |
1 |
1 |
|||
|
Patient |
46 |
1 |
2 |
1 |
2 |
1 |
1 |
1 |
1 |
1 |
1 |
1 |
1 |
1 |
|||
|
Healty |
53 |
1 |
2 |
2 |
1 |
1 |
1 |
2 |
1 |
1 |
1 |
1 |
1 |
1 |
|||
|
Patient |
54 |
2 |
2 |
2 |
2 |
2 |
2 |
2 |
1 |
1 |
1 |
1 |
1 |
1 |
|||
|
Patient |
9 |
2 |
2 |
2 |
2 |
2 |
2 |
2 |
2 |
1 |
1 |
2 |
2 |
2 |
|||
|
Patient |
47 |
2 |
2 |
1 |
1 |
2 |
2 |
2 |
2 |
2 |
2 |
2 |
2 |
2 |
|||
|
Patient |
48 |
2 |
2 |
2 |
2 |
2 |
2 |
2 |
2 |
2 |
2 |
1 |
2 |
2 |
|||
|
Patient |
49 |
2 |
2 |
2 |
2 |
2 |
2 |
2 |
2 |
2 |
1 |
2 |
2 |
1 |
|||
|
Patient |
50 |
2 |
1 |
1 |
1 |
2 |
2 |
2 |
1 |
1 |
1 |
1 |
1 |
1 |
|||
|
Patient |
51 |
2 |
1 |
1 |
1 |
2 |
1 |
1 |
1 |
2 |
2 |
2 |
2 |
2 |
|||
|
Patient |
52 |
2 |
2 |
2 |
2 |
2 |
2 |
2 |
2 |
2 |
2 |
2 |
2 |
2 |
|||
|
Patient |
55 |
2 |
2 |
2 |
1 |
1 |
2 |
1 |
1 |
2 |
1 |
1 |
2 |
2 |
|||
|
Patient |
56 |
2 |
2 |
2 |
2 |
2 |
2 |
2 |
2 |
2 |
1 |
2 |
1 |
2 |
|||
|
Patient |
57 |
2 |
1 |
1 |
1 |
1 |
1 |
1 |
2 |
2 |
2 |
2 |
2 |
2 |
|||
|
Patient |
31 |
2 |
2 |
2 |
2 |
2 |
2 |
2 |
2 |
1 |
2 |
2 |
1 |
2 |
|||
|
Patient |
40 |
2 |
2 |
2 |
2 |
2 |
2 |
2 |
2 |
2 |
2 |
2 |
2 |
1 |
|||
|
Test Accuracy Percentage |
77.27 |
77.27 |
72.73 |
81.82 |
77.27 |
77.27 |
72.73 |
77.27 |
63.64 |
77.27 |
77.27 |
72.73 |
|||||
Table 9. Comparison of the Input and Output Values of Physiological test, Lab test Results and SSR Data Based on Algorithms
|
Group |
No |
BDI |
Phys +Lab |
Phys +Lab+SSR |
|||||
|
LM |
RP |
SCG |
LM |
RP |
SCG |
||||
|
Healty |
26 |
1 |
1 |
1 |
1 |
1 |
1 |
1 |
|
|
Healty |
27 |
1 |
1 |
1 |
1 |
1 |
2 |
2 |
|
|
Healty |
28 |
1 |
1 |
1 |
1 |
1 |
1 |
1 |
|
|
Healty |
19 |
1 |
1 |
1 |
2 |
2 |
1 |
1 |
|
|
Healty |
23 |
1 |
2 |
1 |
1 |
1 |
1 |
1 |
|
|
Healty |
25 |
1 |
1 |
1 |
1 |
1 |
1 |
1 |
|
|
Healty |
29 |
1 |
1 |
2 |
1 |
1 |
2 |
2 |
|
|
Patient |
46 |
1 |
1 |
1 |
1 |
1 |
1 |
1 |
|
|
Healty |
53 |
1 |
1 |
1 |
1 |
2 |
1 |
2 |
|
|
Patient |
54 |
2 |
2 |
2 |
2 |
2 |
2 |
2 |
|
|
Patient |
9 |
2 |
1 |
1 |
1 |
2 |
2 |
2 |
|
|
Patient |
47 |
2 |
2 |
2 |
2 |
2 |
2 |
2 |
|
|
Patient |
48 |
2 |
2 |
2 |
2 |
2 |
2 |
2 |
|
|
Patient |
49 |
2 |
2 |
2 |
2 |
2 |
2 |
2 |
|
|
Patient |
50 |
2 |
1 |
1 |
1 |
2 |
2 |
2 |
|
|
Patient |
51 |
2 |
2 |
2 |
1 |
2 |
2 |
2 |
|
|
Patient |
52 |
2 |
2 |
2 |
2 |
2 |
2 |
2 |
|
|
Patient |
55 |
2 |
2 |
2 |
1 |
2 |
2 |
2 |
|
|
Patient |
56 |
2 |
2 |
2 |
2 |
2 |
1 |
2 |
|
|
Patient |
57 |
2 |
2 |
2 |
2 |
2 |
2 |
2 |
|
|
Patient |
31 |
2 |
1 |
2 |
1 |
2 |
2 |
2 |
|
|
Patient |
40 |
2 |
2 |
2 |
2 |
2 |
2 |
2 |
|
|
Test Accuracy Percentage |
77.27 |
86.36 |
72.73 |
90.91 |
86.36 |
86.36 |
|||
Список литературы Sympathetic Skin Response: A New Biological Signal that can be used in Diagnosis of Fibromyalgia Instead of Beck Depression Inventory
- N. D. Ahuja, A. K. Agarwal, N. M. Mahajan, N. H. Mehta, and H. N. Kapadia, "GSR and HRV: its application in clinical diagnosis," in 16th IEEE Symposium Computer-Based Medical Systems, 2003. Proceedings., 2003, pp. 279–283.
- A. Dönmez and N. Erdoğan, "Fibromyalgia Syndrome," Clin. Dev., pp. 60–64, 1990.
- O. Ozkan, M. Yildiz, S. Bilgin, and E. Köklükaya, "Measuring the sympathetic skin response on body and using as diagnosis-purposed for lung cancer patients by artificial neural networks.," J. Med. Syst., vol. 34, no. 3, pp. 407–12, Jun. 2010.
- Ö. Özkan, M. Yıldız, and E. Köklükaya, "Improving diagnostic accuracy by supporting the laboratory tests which used for diagnosis of fibromyalgia syndrome with the sympathetic skin response parameters," SAU J. Sci., vol. 15, no. 1, pp. 1–7, 2011.
- Ö. Özkan, "Use of sympathetic skin response along with artificial neural networks in diagnosing of fibromyalgia syndrome," Sakarya University, 2012.
- U. H. Ulas, E. Unlu, K. Hamamcioglu, Z. Odabasi, A. Cakci, and O. Vural, "Dysautonomia in fibromyalgia syndrome: sympathetic skin responses and RR interval analysis.," Rheumatol. Int., vol. 26, no. 5, pp. 383–7, Mar. 2006.
- S. Ozgocmen, T. Yoldas, R. Yigiter, A. Kaya, and O. Ardicoglu, "R-R interval variation and sympathetic skin response in fibromyalgia.," Arch. Med. Res., vol. 37, no. 5, pp. 630–4, Jul. 2006.
- F. Wolfe, H. A. Smythe, M. B. Yunus, R. M. Bennett, C. Bombardier, D. L. Goldenberg, P. Tugwell, S. M. Campbell, M. Abeles, and P. Clark, "The American College of Rheumatology 1990 Criteria for the Classification of Fibromyalgia. Report of the Multicenter Criteria Committee.," Arthritis Rheum., vol. 33, no. 2, pp. 160–72, Feb. 1990.
- E. Yazgan and M. Korürek, Medical Electronics, 1st ed. İstanbul: Istanbul Technical University, 1996.
- D. L. Hudson and M. E. Cohen, Neural Networks and Artificial Intelligence for Biomedical Engineering. Wiley-IEEE Press, 2000.
- M. R. Bozkurt, "Preprocessing and Classification of EMG Signals by Using Modern Methods," Sakarya University, 2007.
- M. K. Uçar, M. R. Bozkurt, and F. Bozkurt, "Determination of New Bio Signal and Tests Alternative to Verbal Pain Scale for Diagnosing Fibromyalgia Syndrome," Int. J. Image, Graph. Signal Process., vol. 8, no. 3, p. 1, Mar. 2016.
- M. Toyokura and H. Takeda, "Waveform of sympathetic skin response in diabetic patients," Clin. Neurophysiol., vol. 112, no. 7, pp. 1229–1236, Jul. 2001.
- H. T. Atasoy, N. Atasoy, A. E. Unal, and M. Sumer, "Sympathetic skin response in migraineurs and patients with medication overuse headache.," Headache, vol. 44, no. 4, pp. 305–10, Apr. 2004.
- M. P. Tarvainen, A. S. Koistinen, M. Valkonen-Korhonen, J. Partanen, and P. A. Karjalainen, "Analysis of galvanic skin responses with principal components and clustering techniques.," IEEE Trans. Biomed. Eng., vol. 48, no. 10, pp. 1071–9, Oct. 2001.
- T. Çakir, D. Evcik, Ü. Dündar, İ. Yiğit, and V. Kavuncu, "Evaluation of Sympathetic Skin Response and F Wave in Fibromyalgia Syndrome Patients," vol. 26, no. 1, pp. 38–43, 2011.
- J. McBeth, G. J. Macfarlane, S. Benjamin, S. Morris, and A. J. Silman, "The association between tender points, psychological distress, and adverse childhood experiences: a community-based study.," Arthritis Rheum., vol. 42, no. 7, pp. 1397–404, Jul. 1999.
- O. Ozkan, M. Yildiz, and E. Köklükaya, "The correlation of laboratory tests and Sympathetic Skin Response parameters by using artificial neural networks in fibromyalgia patients.," J. Med. Syst., vol. 36, no. 3, pp. 1841–8, Jun. 2012.
- S. Bilgin, "The analysis of heart rate variability using wavelet transform and artificial neural networks," Sakarya University, 2008.
- S. Bilgin, O. H. Colak, G. Bilgin, O. Ozkan, S. Yildiz, and E. Koklukaya, "Correlation of BAI psychological test scores with heart rate variability using wavelet packet transform and artificial neural networks in fibromyalgia syndrome," in 2010 15th National Biomedical Engineering Meeting, 2010, pp. 1–4.
- L. Ozdemir, E. Pιnarcι, B. N. Akay, and A. Akyol, "Effect of methylprednisolone injection speed on the perception of intramuscular injection pain.," Pain Manag. Nurs., vol. 14, no. 1, pp. 3–10, Mar. 2013.
- M. Doğan, "Neurological diagnosis system based on neural networks," 2003.
- M. Bodén and M. Boden, "A guide to recurrent neural networks and backpropagation," Electr. Eng., no. 2, pp. 1–10, 2001.
- P. Wallisch, M. E. Lusignan, M. D. Benayoun, T. I. Baker, A. S. Dickey, and N. G. Hatsopoulos, MATLAB for Neuroscientists. Elsevier, 2014.
- D. E. Rumelhart and J. L. Mcclelland, Parallel Distributed Cognition: Explorations in the Microstructure of Cognition, vol. 1. MIT Press, 1986.
- Ç. Elmas, Artificial Intelligence Applications (Artificial Neural Network - Fuzzy - Genetic Algorithm), 2nd ed. Ankara: Seckin publishing, 2011.
- C. Mathworks, "Simscape TM User ' s Guide R 2015 b," 2015.
- M. Riedmiller, "Rprop-description and implementation details," 1994.
- M. F. Moller, "A scaled conjugate gradient algorithm for fast supervised learning," Neural Networks, vol. 6, no. 4, pp. 525–533, Jan. 1993.
- P. M. Williams, "A Marquardt algorithm for choosing the step-size in backpropagation learning with conjugate gradients," 1991.
