Techniques of Glaucoma Detection From Color Fundus Images: A Review

Автор: Malaya Kumar Nath, Samarendra Dandapat
Журнал: International Journal of Image, Graphics and Signal Processing(IJIGSP) @ijigsp
Статья в выпуске: 9 vol.4, 2012 года.
Бесплатный доступ
Glaucoma is a generic name for a group of diseases which causes progressive optic neuropathy and vision loss due to degeneration of the optic nerves. Optic nerve cells act as transducer and convert light signal entered into the eye to electrical signal for visual processing in the brain. The main risk factors of glaucoma are elevated intraocular pressure exerted by aqueous humour, family history of glaucoma (hereditary) and diabetes. It causes damages to the eye, whether intraocular pressure is high, normal or below normal. It causes the peripheral vision loss. There are different types of glaucoma. Some glaucoma occurs suddenly. So, detection of glaucoma is essential for minimizing the vision loss. Increased cup area to disc area ratio is the significant change during glaucoma. Diagnosis of glaucoma is based on measurement of intraocular pressure by tonometry, visual field examination by perimetry and measurement of cup area to disc area ratio from the color fundus images. In this paper the different signal processing techniques are discussed for detection and classification of glaucoma.
Glaucoma, Optic neuropathy, Intraocular pressure, Cup area to Disc area ratio
Короткий адрес: https://sciup.org/15012383
IDR: 15012383
Текст научной статьи Techniques of Glaucoma Detection From Color Fundus Images: A Review
Published Online September 2012 in MECS
Optic disc (OD) is the visible portion of the optic nerve, from which the nerve fibres exit the eye [1]. Disc is an inaccurate term to explain OD though optic nerve head (ONH) as it is a 3-dimensional structure. Optic nerve lies between retina and chiasm, which has four parts, such as: intraocular (the optic nerve head), intra-orbital (between globe and optic canal), intracanalicular (within the optic canal), and intracranial (between optic canal and chiasm). The OD is characterized by color, contour, and cup. The typical color of OD is orange-pink with a pale centre. Due to optic atrophy (such as: glaucoma, optic neuritis, arteritic or non-arteritic ischemic optic neuropathy or a compressive lesion) the orange pink color gradually disappears and appears pale. The healthy OD border is clear and well defined. It swells in case of papilloedema and becomes blurred in the presence of optic disc drusen. The central depression of the OD is known as the cup. It lacks of neuroretinal nerve fibres. It looks pale in color.
The cup height is one third of the height of the entire disc for normal disc and gradually increases during optic atrophy. The optic nerve head is that area of the retina where nerve fibres and blood vessels exit the eye. It carries the electrical impulses to the brain for visual processing and is sensitive to the changes in intraocular pressure (IOP) and associated with glaucoma. It is the second leading cause of vision loss worldwide after diabetic retinopathy (DR) [2], [3]. Nearly half of world’s population with glaucoma lives in Asia [4]. About 10 million people in China are suffering in glaucoma.
Glaucoma is a group of conditions which damages the optic nerve on back side of the eye [3]. Optic nerve cells act as transducer and convert light signal entered into the eye to electrical signal for visual processing in the brain. The main risk factors of glaucoma are elevated IOP exerted by aqueous humor, family history of glaucoma (hereditary), myopia or nearsightedness, glaucoma in the other eye, retinal detachment, trauma to the eye, diabetes, pigmentary dispersion syndrome, narrow angles, low systemic blood pressure, migraine headaches or ocular migraines, raynaud’s syndrome, blood thickening, abnormal visual field tests, unhealthy optic nerve, corneal endothelial dystrophy and pseudo exfoliation. The amount of vision loss varies in different cases. Family history increases risk of glaucoma four to nine times, where as diabetes increases risk two times. People over the age sixty are six times more prone to glaucoma than under the age sixty. It is race dependant. African race is more likely to have glaucoma than American race [5]. The different types of glaucoma are close angle glaucoma and open angle glaucoma. Open angle glaucoma occurs when the eye fluid passes slowly by the spongy meshwork connecting the cornea and iris [6], [7]. This builds the IOP and damages the optic nerves. Close angle glaucoma occurs while the cornea and iris closes completely. Both types of glaucoma begin without any symptoms and pain. Vision loss cannot be noticeable at first. It affects the peripheral vision if left untreated. Over time it leads to tunnel vision or complete vision loss. The damage is irreversible and treatment can only reduce or prevent further damage.
The diagnosis of glaucoma is done on the basis of measurement of increased IOP, visual field test, condition of the optic nerve, and observation of variety of possible symptoms. These symptoms are decreased ability to see objects that are not straight ahead, decreased ability to perceive motion and to recognize color, etc., [1]. Increased IOP damages the cells, which causes vision loss. IOP [8] lies between 17 mm Hg (millimetre of mercury) to 21 mm Hg for normal eye. IOP greater than 21 mm Hg is too high for the optic nerve cells to tolerate, which exit the eye through the OD. But for the entire human, IOP greater than 21 mm Hg does not make damage to the vision. IOP can be measured by the Tonometry (Goldman Applanation Tonometry and Tonopen or non contact Tonometry). These methods of defining glaucoma do not provide accurate measurement always as tissue damage does not have a direct relation with IOP. So, IOP cannot be used as a standard measure for glaucoma. It is a critical job for the doctors to detect the vision loss or glaucoma related to IOP.
Visual field is more specific indicator than IOP. Visual field test is done by perimetry, which document the level of peripheral vision. In this case the patient responds to a perceived flash of light by looking ahead every time. The accuracy of the testing depends on patient’s patience, attention and retinal sensitivity. Measurement of IOP and peripheral vision test requires patient’s attention and assessment of glaucoma cannot be guaranteed. Examination of ocular appearance is essential for accurate assessment of glaucoma as appearance of OD is independent on the whims of the patient but it depends on the whims of the clinician [9], [10]. Appearance of OD does not fluctuate from day to day. Due to these reasons it is treated as the most useful indicator of glaucoma and its progression. Stereoscopic disc photographs are found to be good and have the advantage of permanent record of the disc. Disc evaluation requires a lot of clinical experience for evaluation of glaucoma. Disc analysis helps in post diagnosis.
Optic nerve damage can be seen in the form of cupping of the OD. Size of the cup is related to the presence or absence of glaucoma. Larger the cup of the optic nerve, the greater is the likelihood that the person has glaucoma. By looking into the cup-shaped optic nerve doctors cannot necessarily mean that he has glaucoma. Damages of nerve fibre occur over a longer period (10 - 30 years). So, decrease in vision loss cannot be noticed over half of the nerve fibres are died. The nasal side vision is lost first and peripheral vision loss occurs in the last part. A thorough examination of the patient’s IOP, visual field, family background and condition of the optic nerve will help the doctors to advise appropriate treatment plan for reducing further damage of the nerve fibres. Symptoms are more important than signs. Headache during reading, blurred vision, eye aches after strong exercise, poor color perception and trouble in seeing night are some important symptoms to be looked during the study of glaucoma. Analysis of OD is possible from the color fundus images which are taken by Heidelberg Retina Tomography (HRT) and Optical Coherence Tomography (OCT).
Appearance of OD changes during glaucoma. In the early stage of glaucoma the changes are subtle and may appear similar to that of normal OD. Gradually the cup size increases with the progression of diseases. In early 70’s Armaly introduced the idea of cup-area-to-disc-area-ratio (CDR) i.e., proportion of the disc occupied by the cup for assessment of glaucoma [6]. It is commonly used in clinics to classify glaucoma. For normal discs it falls in the range of 0.3 to 0.5 and for glaucoma it is greater than 0.5. The sight of vision is lost completely at the CDR value 0.8. For some normal human beings CDR value lies in 0.4 to 0.6. The variation in the OD size occurs due to myopic disc and hypermetropic disc. For myopic the disc is normal, where as hypermetropic disc there is an extensive damage of nerve-fibres. In some situation one disc is normal and other disc is grossly diseased but both having same CDR. So, specific pattern of changes in the OD is used for evidence of glaucoma or progression of glaucoma with CDR. Features like focal glaucomatous optic discs, migraine, vasospasm, myopic glaucomatous discs, senile sclerotic and generalized cup enlargement are considered during assessment of glaucoma. The neuroretinal rim pattern of thickness (normal disc: inferior is thicker to superior) and areas of focal thinning (normal disc: nasal is thinner to temporal) are used for detecting glaucoma. Another characteristic of glaucoma is focal notching and during which the neuroretinal rim is absent. It is associated with peripapillary atrophy (PPA). PPA is a feature which causes rim loss in case of glaucoma during normal ageing process and high myopia. It is present with full 360 degree. Senile sclerotic discs have a shallow saucerised cup with gently sloping sides and PPA. The disc also has a moth eaten neuroretinal rim. Loss of retinal nerve fibre layer (RNFL) makes the cup to expand. The different features of the OD are shown in Figure 1.
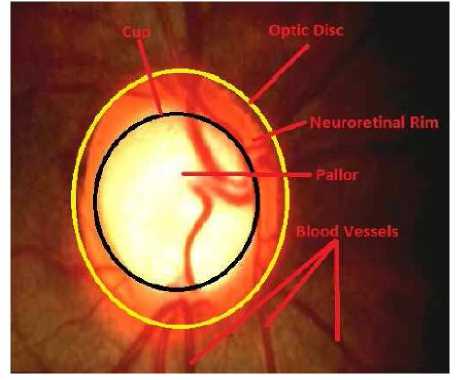
Figure 1. Different Parts of OD
Glaucoma affects the appearance of the OD [1]. Regular analysis of OD will minimize the progression of the disease. A number of techniques have been discussed in the literature for detection of the OD and few of them mentioned about glaucoma. In this paper the different techniques for glaucoma detection and classification are discussed. Section 2 explains the different techniques for glaucoma classification. Description of the freely available data and conclusions are discussed in Section 3 and Section 4 respectively.
-
II. TECHNIQUES FOR GLAUCOMA ASSESSMENT
The most reliable way of glaucoma diagnosis follows the investigation of the retina from the fundus image, which is taken by a special camera called fundus camera. Glaucoma damages the neuroretinal nerve fibres in the OD region. The progression of the disease can be obtained by analyzing the OD region. The different techniques of glaucoma classification and detection are discussed below.
Gloster and Parry (1974) use the fundus image photographs for measuring the cupping in the optic disc for evaluation of glaucoma [11]. Degree of visual damage can be known from the appearance of OD. The normal eye has pale color OD. The color changes during disease condition. It appears pink during nuclear sclerosis. Three types of photographs were taken for the study, such as: ordinary photograph taken in usual manner, 80B photograph illuminated by Kodak Wartten 80-B filter and cyan ring photograph. Different parameters (such as: CDR, cup horizontal diameter to disc horizontal diameter, cup diameter to disc diameter and cup vertical diameter to disc vertical diameter etc.,) were used to find the cupping and accessing glaucoma.
Funk et al., (1989) finds the correlation between neuroretinal rim area and age in normal subjects by using Rodenstock Optic Nerve Head Analyzer (RONHA) on 194 eyes of 122 normal subjects between the age group 7 to 84 [12]. RONHA provides three-dimensional topography of OD. The total subjects were divided into eight groups. For each eye, different OD parameters such as cup-disc-ratio, disc area, cup volume, elevation and disc parameter were found out. Linear regression analysis is used to find the correlation between the neuroretinal rim areas as a function of age. But no significant linear correlation is obtained between them. There is no change in neuroretinal rim area w.r.t age. Authors found a decrease in neuroretinal rim area (less than 0.2 mm2) in case of glaucomatous damage.
Neuroretinal rim area (NRA) is used for detection of glaucoma [13]. According to the literature, NRA increases with age and DR. It decreases with increase in IOP, as IOP increases the nerve swelling. NRA is calculated by taking the difference between the disc area and the cup area. Authors have used 2990 diabetic patients from 11 countries in the south central Wisconsin. They have divided the total subjects into two groups younger onset (people having diabetics before the age 30 and they are taking insulin) and older onset (people having diabetics after the age 30 and diabetics was conformed from the serum glucose level). The younger onset consists of 1210 subjects and older onset consists of 1780 subjects. From the NRA study the authors have concluded that younger onset has smaller NRA as compared to older onset. The NRA increases with age.
Corona et al., (2002) overcomes the limitations for evaluation of glaucoma (such as: difficulty in interpretation of retinal images, intra and inter-observer variability, lack of proper standardization for evaluation of OD size and shape) by generating precise metrics from the stereo OD image pairs by using digital stereovision system for visualization of the structure of ONH [14]. Here authors have found the 3-D surface from 2-D stereo using different steps such as pre-processing, initial registration of stereo pair. The depth information is found out by finding area and features. The depth information of the OD is found out by power spectrum and zero mean normalized cross correlation. The correlation coefficient between manually automatic segmented cup/disc is found to be 95.7%, which implies strong overlapping.
McIntyre et al., (2004) finds the Zernike moments from the color fundus images, which are taken by confocal scanning laser tomography (CSLT) for classifying the condition of the OD by using linear discriminant function derived from linear perceptron (supervised learning) [15]. Low order Zernike moments captures the gross features information from an image where as high order Zernike moments resolves the high frequency information. These features are used for classifying the glaucoma images from the normal images. Authors have used 111 healthy OD and 115 glaucoma disc for the study. Meng et al., (2005) uses the baseline matching from a query sequence for classifying visual field loss in glaucoma [16].
Pueyo et al., (2006) uses neuroretinal ring and the OD area as a function of age along the different sector of the OD for detection of glaucoma [17]. The method is tested on 200 eyes obtained from Ophthalmology Hospital. The data is divided into two sets depending on IOP (normal: below 21 mm Hg, glaucoma: above 21 mm Hg). In the data set 101 images are normal and 99 images are glaucoma. According to the authors analysis temporal, superior and inferior sectors of the neuroretinal rim provide the information about glaucoma.
Damages occur in the retinal nerve fibre layer (RNFL) during glaucoma is detected from the color fundus images by using computer aided detection (CAD) and Gabor filtering [18]. The diagnosis is improved due to CAD by guarding against the retinal changes. Here the authors have applied the Gabor filtering to the grey scale image of the detected OD from the color fundus image after removing the blood vessels by morphological closing. In morphological closing a circular structuring element is used whose radius is considered according to the diameter of the blood vessels. The blood vessels erased image is transformed into a rectangular array, whose x-axis represents the angle and y-axis represents the distance. Then Gabor filter is performed with a Gaussian filter to enhance the RNFL. Then the candidates are detected, whose parameters (mean angle and width of the candidates) are used as features for classifier. This method was tested on 52 fundus images (26 images had nerve fibre layer defect) with 768 × 576 pixels. The accuracy of the method is found to be 71%.
Disc morphology, such as size and shape of the neuroretinal rim and cup are varying with race, demographic characteristics, structure of optic nerve head, RNFL and glaucoma [5]. The authors have measured the disc size by histomorphometry, slit-lamp biomicroscopy, planimetry and imaging. Confocal scanning laser ophthalmoscopy (CSLO) provides the accurate measurement of OD size. For normal eye OD area ranges from 1.74 mm2 - 2.74 mm2. Larger size of the disc implies larger neuroretinal rim and larger CDR. Disk size is used by Hoffmann et al., (2007) for assessment to diagnose and manage glaucoma.
Fink et al., (2008) uses independent component analysis (ICA) for feature extraction from color fundus images and k-nearest neighbour classifier (KNN) for glaucoma classification [19]. ICA finds the basis images which represent the independent feature characteristic of the observed retina images of the papilla. The corresponding coefficients of basis images have been learned from a training data set. Then classification is done by KNN classifier. Here, L 2 norm is used for deciding the corresponding class. The technique was applied on 250 images of size 256 × 256 pixels. By this technique 90.8% images are correctly classified.
Wong et al., (2009) developed an automatic cup to disc ratio measurement system ARGALI for glaucoma detection and analysis. This ARGALI technique used different segmentation method (color histogram analysis, level set method etc.,) for detection of cup and disc from the color fundus images. CDR was calculated by different methods. CDR varied for different images due to their variability. The obtained CDR by different methods is merged by adaptive neural network. This method was tested on the color fundus images (size: 3072 × 2048) taken from Singapore Eye Research Institute.
Nayak et al., (2009) uses the features, such as: cup-to-disc-ratio (CDR), ratio of the distance between OD center and optic nerve head to the diameter of OD, and blood vessels area in the inferior-superior side to the nasaltemporal side (ISTN) for classifying the normal and glaucoma images by using neural network classifier [20]. These three features change due to the progression of glaucoma. The first feature CDR increases with the glaucoma due to the shifting of the ONH towards nasal side. Shifting of the ONH w.r.t to the OD center was named as distance. The ratio of the distance to the OD diameter is the second feature. Figure 2 shows the different regions (different quadrants) of the OD. Authors have used red and green channel for detection of glaucoma. At first the blood vessels are removed by morphological operation (close and open operation) as the blood vessels minimally affected by glaucoma. The OD is clearly visible in the red channel. The demarcation line between the cup and disc is not clear in red channel. So the green channel of the color fundus image is used to separate the cup from the OD. This provides the first feature. For the second feature the cropped green channel is considered. The pixel having highest intensity in the cropped green channel image is the OD centre. Bottom hat transformation is applied to the cropped green channel image. The brightest pixel in the output of the bottom hat transformation is centre of ONH. The distance between the two points is the distance defined in the paper. The ratio of the distance to the diameter of the OD is the second feature. Major parts of the blood vessels are present in the superior and inferior part of the OD. Due to shifting of ONH in glaucoma blood vessels covered by the nasal region increases and inferior-superior region decreases. So the ratio of the area of sum of blood vessels in the inferior superior region to the sum of blood vessels in the nasal temporal region decreases. The amounts of blood vessels in different quadrants of the OD are found out by applying a 300 × 300 mask on the segmented blood vessels with a rotation of 90o each time. Then third feature, ISTN is calculated. The three features are used by artificial neural network (ANN) for classification of glaucoma. The method was tested on 61 (24 normal and 37 glaucoma) fundus images from the subjects in the age of 20 to 70 obtained from Kasturba Medical College Manipal, India. The fundus images are in JPEG format with a resolution of 560 × 720. This method provides a classification rate of 90%, sensitivity 100%, specificity 80% and positive predictive value of 90.9%.
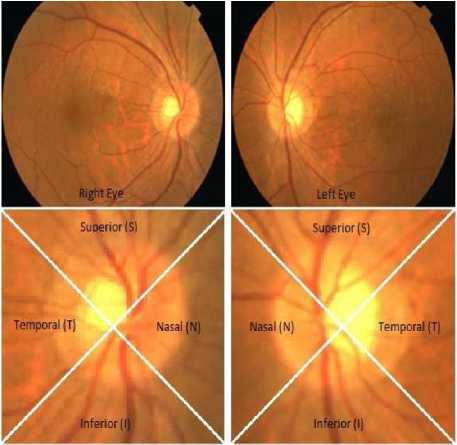
Figure 2. Different regions of OD
Jimenez et al., (2009) uses multifocal electroretinography (ERG) for studying the structural pattern of the retina for early diagnosis of glaucoma [21]. ERG is a recording of the bioelectric signals obtained due to summed activity of the retina cells. The authors have studied the peak amplitude and maximum latencies in wavelet domain for finding the diagnostic information. The ERG signal has duration of 190ms, which can be decomposed into two sections (direct component and induce component). Early changes in glaucoma can be detected from the induced component (60-90 ms interval), which has three sub-components first positive wave, second negative wave and ending positive wave. The structural patterns (position of peaks, height of peaks, linear slopes, distance between the peaks and zero crossing) of the ERG data were extracted and given to the radial basis neural network (RBN) for classification. From the study authors have concluded that global analysis of morphological patterns of ERG data has provided good glaucoma discrimination. The method was tested on 50 eyes (normal: 20, glaucoma affected: 30) taken from Electro-Diagnostic Imaging San Mateo, USA. Sensitivity and specificity of this method are found to be 92% and 83% respectively.
Hatanaka et al., (2011) measures the cup to disc ratio based on line profile analysis in retinal images for early detection of glaucoma [22]. Here blue channel of the color fundus image is used as it has higher contrast between the cup and rim regions. Zero crossing method is used to find the cup edge. Authors found CDR by measuring the ratio of cup diameter to disc diameter after segmenting the blood vessels erased OD from the color fundus images. This method was tested on 45 retinal images (33 glaucoma images) taken by retinal fundus camera (Kowa VX-10i) with the photographic angle of 27o. They have noted an average CDR of 0.74 and 0.59 for abnormal and normal cases respectively. In this method concordance and accuracy were found to be 85% and 94.7% respectively.
Xu et al., (2011) uses a number of sliding window (ellipse) of various sizes to obtain the cup features in the OD [23]. These features are ranked by support vector machine (SVM) using radial basis function (RBF). This method attains the accuracy of 73.2%.
Information theory based method, minimumredundancy maximum-relevance (MRMR) is used by Zhang et al., (2011) for automatic diagnosis of glaucoma from color fundus images [24]. This method has used one fourth of the features for classification. MRMR provides the maximum relevant and minimum redundant features based on mutual information quotient. The classification is performed by adaptive boosting, support vector machine (SVM), linear discriminant analysis (LDA) and MRMR optimized classifiers. Here 23 features (such as: vertical cup-disc ratio, ocular hypertension, alpha PPA at optic nerve, area of optic cup, rim inferior width, medical history of glaucoma, rim temporal width, ISNT rule compliance, optic cup height, rim superior width, retinal nerve fibre layer defect, age of screening, right eye ocular hypertension, job category, anisometropia indication, diabetic retinopathy level, rim nasal width, eye history of retinopathy, PPA info, overall ocular hypertension, optic disc area, self reported heart attack and race category) are used for classification. The method was tested on the data taken from ORIGA database and Singapore Malaya eye study (SiMES). SiMES data has variation in age, gender, height, medical history, IOP, and cornea thickness. ORIGA data contains 650 retinal images. Accuracy for both SVM and LDA classifiers was found to be 92%.
Nath et al., (2011) calculates CDR for detection of glaucoma [25]. In this case the green channel of the color fundus image is used for pre-processing as green channel has relative saturation at the OD region. The other regions are minimally affected. So, blood vessels are removed by the inpainting process. Then boundary of the cup and disc are determined. CDR was calculated to detect the glaucoma. The experiment was performed on 25 numbers of images consisting of 7 normal and 18 glaucoma images taken from the optic-disc-organization with 144 × 144 pixels [6]. By this method all the glaucoma images are correctly detected. This method fails while the fundus image has other pathologies.
Nath et al., (2011) uses principal component analysis (PCA) and LDA for glaucoma detection and classification [26]. PCA changes the shape and location of the data. LDA provides class separability and finds decision regions among the classes. PCA finds the direction along which maximum variation of data occurs, whereas LDA finds the class scatter matrix for glaucoma classification. This method is applied to 26 images having both normal and glaucoma with 144 × 144 pixels in bit map format. Sensitivity and specificity for this method were found to be 76.92% and 66.66% respectively. The method fails in some glaucoma with inflamed disc.
Bock et al., (2010) uses PCA and SVM for glaucoma classification [27]. The images are pre-processed to have the details of the OD. The pre-processing step consists of removal of blood vessels, illumination correction and optic head normalization. Then features of pre-processed images are obtained by PCA. Classification is done by SVM classifier. The images are classified to either glaucoma or non-glaucoma images. Bock et al., has found the glaucoma risk index (GRI) by combining the different feature types such as FFT, B-spline and PCA. The analysis was performed on 95 images linked to 32 eyes. The performance is calculated by accuracy, sensitivity and specificity. Accuracy, sensitivity and specificity are found to be 88%, 73% and 85% respectively.
Blood vessel occlusions, ill-defined boundaries, variation in image due to pathological changes and imaging conditions are the limitations of OD segmentation. Accurate segmentation of OD and cup is essential for evaluation of glaucoma progression. Joshi et al., (2011) have proposed a novel method for cup and OD segmentation method based on vessel bends at the cup boundary from the monocular color retinal images, which gives a 2-D projection of retinal structures [28]. Vessel bends are detected by using region support concept. Here authors segment the OD based on region based active contour model. Vessel bends and pallor information is used for segmentation of cup. The method was tested on 138 fundus images (33 normal images and 105 glaucoma images) with dimension 2896×1944. The CDR and cup to disc vertical height ratio is calculated and accessed against the ground truth of three experts. The segmentation results matches to the ground truth.
Dua et al., (2012) uses the energy distribution over the wavelet subbands to find important texture features from the color fundus images for classification of glaucoma [29]. Wavelet transform represents the features in an image in terms of their frequency content and helps in analysis. Daubechies (db3), symlets (sym3) and biorthogonal (bio3.3, bio3.5, and bio3.7) wavelets are used by authors for finding the features. These features are used by SVM, sequential minimal optimization, random forest and naive Bayes classifier for classification. Average texture features in different wavelet families are used for classifying the images to normal and glaucoma images. Authors ranked the different features such as Chi-Squared, gain ratio, information gain, based on the discriminatory potentials. The authors applied the method on the data obtained from Kasturba Medical College Manipal, India . The dataset consist of 60 images (normal: 30, and glaucoma: 30) with 560 × 720 pixels in JPEG format. The accuracy of this method was found to be 93.33%.
The different techniques discussed in the literature can be implemented in conventional instrument modality for several eye-care applications, such as diagnosis, screening, and monitoring purpose. This will help the clinicians for diagnosis.
-
III. Glaucoma Data
Here information is given about the online available retinal fundus image database for glaucoma evaluation. Optic-disc organization ( consists of 8 normal images and 37 glaucoma images of dimension of 144 × 144 pixels in bit-map format. ORIGAlight is freely available retinal images with ground truths [30]. ORIGAlight consists of 650 retinal images (168 glaucomatous images and 482 non glaucoma images). RIM-ONE is freely available retinal image database for glaucoma diagnosis [31]. It consists of 169 images out of which 118 normal eyes, 12 early glaucoma eyes, 14 moderate glaucoma eyes, 14 deep glaucoma eyes, and 11 ocular hypertension eyes.
-
IV. CONCLUSION
In this paper the different techniques are discussed for glaucoma detection and classification. These methods can be used in different instruments for easy diagnosis of glaucoma from the color fundus images. The methods can also be combined for obtaining better accuracy. Blood vessels in the color fundus images are the limitation to segment the OD reliably and accurately for finding CDR. This problem is similar to other boundary detection and image segmentation problems in medical imaging area, which requires robust solution. These methods can be improved to obtain higher sensitivity and specificity.
Acknowledgment
We thank anonymous referees for their constructive comments.
Список литературы Techniques of Glaucoma Detection From Color Fundus Images: A Review
- P. N. Schacknow, J. R. Samples. The Glaucoma Book (First Edition). Portland, USA:Springer Publication, 2010.
- M. T. Leite, L. M. Sakata, F. A. Medeiros. Managing Glaucoma in Developing Countries. Arq Bras Oftalmol., 2011(74):83-84.
- B. Thylefors, A. D. Negrel. The Global Impact of Glaucoma. Bulletin of the World Health Organization, 1994(72):323-326.
- T. Y. Wong, S. C. Loon, S. M. Saw. The Epidemiology of Age Related Eye Diseases in Asia. British Journal of Ophthalmology, 2006(90):506-511.
- E. M. Hoffmann, L. M. Zangwill, J. G. Crowston, R. N. Weinreb. Optic Disk Size and Glaucoma. NIH Public Access, 2007(52):32-49.
- http://www.optic-disc.org
- http://www.willsglaucoma.org
- L. Xu, Y. Wang, J. Li. Single Intraocular Pressure Measurement for Glaucoma Detection. Beijing eye study, Acta Ophthalmologica, 2008(86).
- R. A. Abdel. Ghafar, T. Morris, T. Ritchings, I. Wood. Detection and Characterisation of the Optic Disc in Glaucoma and Diabetic Retinopathy. Annual Conference in Medical Image Understand (London, UK), 2004:23-24.
- http://www.moorfields.nhs.uk/
- J. Gloster, D. G. Parry. Use of Photographs for Measuring Cupping in the Optic Disc. British Journal of Ophthalmology, 1974(58):850-862.
- J. Funk, T. Dieringer, F. Grehn. Correlation Between Neuroretinal Rim Area and Age in Normal Subjects. Graefe’s Archive for Clinical and Experimental Ophthalmology, Springer Verlag, 1989(227):544-548.
- Barbara E. K. Klein, S. E. Moss, R. Klein, Y. L. Magli, C. H. Hoyer. Neuroretinal Rim Area in Diabetes Mellitus. Investigative Ophthalmology and Visual Science, 1990(31):805-809.
- E. Corona, S. Mitra, M. Wilson, T. Krile, Y. H. Kwon, P. Soliz. Digital Stereo Image Analyzer for Generating Automated 3-D Measures of optic Disc Deformation in Glaucoma. IEEE Transactions on Medical Imaging, 2002(21):1244-1253.
- A. R. McIntyre, M. I. Heywood, P. H. Artes, S. S. R. Abidi. Toward Glaucoma Classification With Moment Methods. Proceedings of the First Canadian (IEEE) Conference on Computer and Robot Vision (CRV04), 2004:265-272.
- S.-H. Meng, A. Turpin, M. Lazarescu, J. Ivins. Classifying Visual Field Loss in Glaucoma Through Baseline Matching of Stable Reference Sequences. IEEE International Conference on Machine Learning and Cybernetics, 2005:3686-3691.
- V. Pueyo, J. M. Larrosa, V. Polo, A. Perez-Inigo, A. Ferreras, F. M. Honrubia. Sector-Based Analysis of the Distribution of The Neuroretinal Rim by Confocal Scanning Laser in the Diagnosis of Glucoma. Arch Soc Esp Oftalmol, 2006(81):135-140.
- Y. Hayashi, T. Nakagawaa, Y. Hatanakac, A. Aoyamaa, M. Kakogawab, T. Haraa, H. Fujitaa, T. Yamamotoa. Detection of Retinal Nerve Fiber Layer Defects in Retinal Fundus Images Using Gabor Filtering. Medical Imaging:SPIE, 2007(6514):65142Z1-65142Z8.
- F. Fink, K. Wrle, P. Gruber, A. M. Tom, J. M. G. Sez, C. G. Puntonet, E. W. Lang. ICA Analysis of Retinal Images for Glaucoma Classification. IEEE Conference, Vancouver, British Columbia, Canada, 2008:4664-4667.
- J. Nayak, Rajendra Acharya U., P. S. Bhat, N. Shetty, T.-C. Lim. Automated Diagnosis of Glaucoma Using Digital Fundus Images. Journal of Medical Systems, Springer, 2009(33):337-346.
- J. Miguel-Jimenez, S. Ortega, L. Boquete, J. M. Rodriguez-Ascariz, R. Blanco. Multifocal Electroretinography: Structural Pattern Analysis and Early Glaucoma Detection. Electronics Letters, 2009(45):1113-1115.
- Y. Hatanaka, A. Noudo, C. Muramatsu, A. Sawada, T. Hara, T. Yamamoto, H. Fujita. Automatic Measurement of Cup to Disc Ratio Based on Line Profile Analysis in Retinal Images. 33RD Annual International Conference of the IEEE EMBS (IEEE, ed.), (Boston, Massachusetts USA), 2011:3387-3390.
- Y. Xu, D. Xu, S. Lin, J. Liu, J. Cheng, C. Y. Cheung, T. Aung, T. Y. Wong. Sliding Window and Regression Based Cup Detection in Digital Fundus Images for Glaucoma Diagnosis. Springer-Verlag, 2011:1-8.
- Z. Zhang, C. K. Kwoh, J. Liu, F. Yin, A. Wirawan, C. Cheung, M. Baskaran, T. Aung, T. Y. Wong. MRMR Optimized Classification for Automatic Glaucoma Diagnosis. 33RD Annual International Conference of the IEEE EMBS, (Boston, Massachusetts USA), 2011:6228-6231.
- M. Mishra, M. K. Nath, S. R. Nirmala, S. Dandapat. Image Processing Techniques for Glaucoma Detection. Communications in Computer and Information Science: Advances in Computing and Communications: Springer, 2011(192):365-373.
- Malaya Kumar Nath, M. Mishra, and S. Dandapat. PCA and LDA Based Approach to Glaucoma Classification from Color Fundus Images. 35TH National Systems Conference, (IIT Bhubaneswar, India), 2011:186-191.
- R. Bock, J. Meier, L. G. Nyul, J. Hornegger, G. Michelson. Glaucoma Risk Index: Automated Glaucoma Detection from Color Fundus Images. Elsevier: Medical Image Analysis, 2010(14):471-481.
- G. D. Joshi, J. Sivaswamy, S. R. Krishnadas. Optic Disk and Cup Segmentation from Monocular Colour Retinal Images for Glaucoma Assessment. IEEE Transactions on Medical Imaging, 2011(30):1192-1205.
- S. Dua, U. R. Acharya, P. Chowriappa, S. V. Sree. Wavelet-Based Energy Features for Glaucomatous Image Classification. IEEE Transactions on Information Technology in Biomedicine, 2012(16):80-87.
- Z. Zhang, F. S. Yin, J. Liu, W. K. Wong, N. M. Tan, B. H. Lee, J. Cheng, T. Y. Wong. ORIGAlight: An Online Retinal Fundus Image Database for Glaucoma Analysis and Research. 32ND Annual IEEE International Conference of the EMBS, Buenos Aires, Argentina, 2010:3065-3068.
- F. Fumero, S. Alayon, J. Sanchez, J. Sigut, M. Gonzalez-Hernandez. RIM-ONE: An Open Retinal Image Database for Optic Nerve Evaluation. 24TH IEEE International Symposium on Computer-Based Medical Systems (CBMS), Bristol, 2011:1–6.
