Technology Forecasting: A Case Study of Software Technology Product Families

Автор: Amol C. Adamuthe, Abhaysinh V. Surve, Gopakumaran T. Thampi
Журнал: International Journal of Information Engineering and Electronic Business(IJIEEB) @ijieeb
Статья в выпуске: 1 vol.8, 2016 года.
Бесплатный доступ
With increasing use of computers, information and communication technologies, some software technologies products become part of everyday life. Many reports shows that use of desktop and mobile operating systems, search engines, web browsers, web servers and programming languages are increasing rapidly. This paper focuses on forecasting growth pattern of selected software technology product families using market share as indicator. Results of four growth curve methods namely Logistic, Gompertz, Log Logistic and Mono-Molecular are compared using MAD and RMSE error measures. For the period under consideration, majority software product families follow increasing / decreasing growth pattern. Results indicate that industry of respective technology product remain dominated by few providers for year 2025. Monopoly or oligopoly market structure will lead to long increasing period for the top providers.
Software technology products, Product life cycle, Growth curves, Market structure
Короткий адрес: https://sciup.org/15013388
IDR: 15013388
Текст научной статьи Technology Forecasting: A Case Study of Software Technology Product Families
Published Online January 2016 in MECS
Technologies have a significant impact on all aspects of life. The global society and economy is undergoing a fundamental transformation because of advances in technologies. Today’s marketplace is highly influenced by transformational technological advances, globalization and increased use of software technologies. Today’s organizations are facing their toughest competition ever and organizations should strive to retain customers by outperforming their competitors. Software technology product companies are also facing this problem. Companies continuously need to improve their software products in order to cope with changing technology need by market pull and stay competitive with adapting change in technologies.
Products and technologies undergo constant change and improvement. Technological change is both a threat and an opportunity to enterprise and country. Every product / technology is subjected to life cycle staring from introduction to decline. Investigation of life cycle will help enterprises, customers and country for taking decision about research policies, operational activities, investment plans etc. Product life cycle is a tool to help organization to outperform the competition. In literature the PLC concept investigated to different application areas such as consumer deliverables, pharmaceutical products, technology products, industrial products etc. The most common product life cycle pattern is the classical, bell-shaped curve, but it is not the sole shape.
Technology forecasting (TF) predicts technological trends such as the direction and the rate of technological development. The primary function of forecasting is to predict the future using data we have in hand. More than 100 methods of technology forecasting are developed and applied by researchers. Growth analysis is highly quantitative and requires numerical data and uses S-shaped curves. In literature, growth curves are often used for modeling product lifecycle. Growth curves (the first derivative of the product lifecycle curve) are widely used in technology forecasting [1].
This paper focuses on forecasting life cycle of selected software technology product families using growth curve methods. In this paper, we have focused on different software technology families viz., desktop and mobile operating systems, search engines, web browsers, web servers and programming languages. The software products families shows continuous release of incremental products. The indicator used for forecasting is the market share, expressed in percentage. Four methods of growth curves are experimented namely Logistic (Pearl Reed), Gompertz, Log logistic and Mono-Molecular. The secondary objective is to identify the market structure of the selected software technology product families.
The rest of the paper is organized as follows: Section 2 is about methodology which discusses product life cycle, growth curve methods and market structures. In Section 3, related work of software technology forecasting is described. Section 4 is about results and discussion. Finally, the conclusions of our study are outlined in Section 5.
-
II. Methodology
This section introduces the methodology used for forecasting software technology products.
-
a) Estimate the parameters of growth curve. The equation of the growth curve is transformed into a linear function using natural logarithms. The parameters of linear model are then estimated using simple linear regression.
-
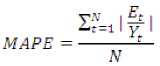
b) Find best fit growth model. Mean absolute deviation (MAD) and root mean square error (RMSE) are used to calculate the fitting of methods.
МАЕ =
&^l
N
-
c) Project the historical data using best fitted growth curve method.
-
d) Identify the market structure of the industry based on the concepts of market structure.
Limitations of methodology:
Unpredictable events such as release of incremental version of technology product, new alternative for the product etc are beyond the scope of this study.
-
A. Product Life Cycle
The Product life-cycle (PLC) concept was first introduced by Joel Dean in 1950. It is product’s sales or profits over its lifetime. Majority of the authors stated that product life cycle can be divided into four stages namely introduction, growth, maturity and decline. According to Kotler, it involves five distinct stages namely product development, introduction, growth, maturity and decline [2].
-
• Introduction: In this stage product gets launched into the market. Sales are slow as the product is not yet known. Emphasis is on advertising and distribution.
-
• Growth: This stage shows growing market
acceptance and increasing profits. Competitors begin to enter the marketplace. The business concentrates on optimizing product availability.
-
• Maturity: The rate of sales growth slows down as the product has been widely distributed and sold. The company now focuses on creating brand extensions and promotion offers to boost sales. New product research is critical to ensure future sales.
-
• Decline: Sales slow down dramatically and profits fall off. The product may be dropped to make way for new products and the cycle recommences.
The theoretical rationale behind the PLC concept emanates from the theory of diffusion and adoption of innovations [3]. Different 12 types of PLC patterns are discovered by investigators [3].
-
B. Growth Curves
Growth curves are used to forecast how and when a technology will reach its upper limit. Growth pattern of various technologies in a particular industry help to understand the industry characteristics and analyze the technology innovation process. It is applied to a variety of fields including technology, physics, biology, social science and economics. Growth curves are used for forecasting the mobile user growth [4], diffusion of Mobile Telephony [5, 6], wireless phone diffusion [7], trend in DRAM industry [8] etc.
Growth analysis is highly quantitative and requires numerical data and uses S-shaped curves. The S-curve is emerged as a mathematical model. There is very rapid growth in the number of growth curve methods for examining the development and substitution of technologies. Four growth curve models from literature are described below.
-
• Logistic (Pearl curve) - In this model, growth is slow in the early stage of adoption and becomes faster as product demand approaches the saturation level. It is therefore appropriate to use the logistic model to predict process of technology diffusion.
L yt = 1+ae —bt
-
• Gompertz - The Gompertz curve is similar to the logistic curve, but its point of inflection is not symmetrical and also it does not plot a straight line on a semi log graph. These curves are used to represent technologies where the growth in the initial stage is faster than in the logistic curve.
yt = Le
—
- ae -
,-bt
-
• Mono-Molecular- This model describes the progress of a growth situation in which it is believed that the rate of growth at any time is proportional to the resources yet to be achieved. The Mono-Molecular model has no inflection point. Mono-Molecular model is also called as Brody equation or Mitscherlich model.
y (t ) = L (1 — a exp ( — bt ))
-
• Log-logistic- The log-logistic equation was originally proposed by Cole and his colleagues in 1993 to describe the nonlinear thermal inactivation of micro-organisms and later was modified by Chen and Hoover in 2003 to avoid the direct use of different initial numbers and to reduce the number of parameters in the equation from four to three.
У ( t ) =
L
1 + a exp( — b *log( t ))
-
C. Market Structure
Market structure refers to the nature and degree of competition in the market for goods and services. There are 4 basic market structures: pure competition, monopolistic competition, oligopoly, and pure monopoly [9, 10, 11]. Last three structures are often referred to as imperfect competition structure. This section discuss general concept of market structure from literature.
-
• Pure competition: As there are large numbers of firms producing product, one supplier cannot change the market price. Market prices are determined by consumer demand. The number of buyers and sellers are independent and large in number. The products are homogeneous. The best examples of a purely competitive market are agricultural products.
-
• Monopolistic competition: Suppliers try to achieve some price advantages by differentiating their products from other similar products. Most consumer goods, such as health and beauty aids, fall into this category.
-
• Oligopoly: Market is dominated by a few suppliers. Limits the number of firms that can enter into the market. An industry that has a relatively small number of firms that dominate the market is called a concentrated industry. Oligopolies are concentrated industries. Duopoly is a special case of an oligopoly with two firms. Oligopolies exist in many forms.
-
• Monopoly / Pure monopoly: There is only one supplier who has significant market power and determines the price of its product. A pure monopoly faces little competition because of high barriers to entry, such as high initial costs, or because the company has acquired significant market influence through network effects, for instance.
Table 1. Characteristics of Market Structure.
|
Charac teristic |
Perfect compet ition |
Monopolisti c competition |
Oligopoly |
Monopoly |
|
Number of firms |
Many |
Many |
Few dominant firms. |
One with pure monopol. |
|
Type of product |
Homog eneous |
Differentiate d |
Differenti ated |
Unique / Limited. No close substitute. |
|
Size of firm |
Relative ly small |
Relatively small |
Average / Large |
Large |
|
Market share |
Small |
Small |
Average / High |
Highest |
|
Barriers to entry |
None |
Low |
High |
High |
|
Price setting power |
Nil |
Low |
High |
High |
Concentration ratios provide estimates of the extent to which the largest firms contribute to activity in an industry. They can be derived using variables such as sales (turnover), employment and profits, market shares. The concentration ratio is the percentage of market share held by the largest firms (m) in an industry.
-
III. Related Work
This section describes the related work in software technology forecasting using trend projection methods and causal models.
Paper [12] derived statistical models to analyze the trend and the relationships between different factors that characterize an operating system. According to the study, it is possible to predict if an operating system will succeed or fail. Multivariate multiple regression method is used for modeling the evolution of operating Systems such as Unix, Solaris/ Sun OS, BSD, Windows, MS-DOS, MAC OS, Linux, Net Ware, HP UX, GNU Hurd, IBM Aix, Compaq/ DEC VMS, OS/2. In [13], evolution of different operating systems is evaluated. The trends of 15 different operating systems have been investigated. The multivariate regression model is built as per the problem to investigate the operating system popularity. Their results show that Windows, MAC and Linux operating systems will survive the market. Windows will lead the market followed by MAC. Linux will grow steadily. Spyridoula Lakka et al. [14] presented the results of desktop/laptop operating systems market evolution using the concepts of population dynamics and organizational ecology. Estimation and forecasting is done by Lotka– Volterra model whose parameters are estimated by using genetic algorithms. This paper analyzes the evolutionary and competitive dynamics of the three leading players of the market, namely the OSS Linux, the partly-OSS MAC OSX and the proprietary Windows operating systems. Market share of operating systems expressed in percentages is used as indicator for evaluation. Data is extracted from W3Schools' log-files, during the period from 2003 to the second quarter of 2010.
In [15], the evolution of different Software products such as Programming languages, operating systems, web browsers and web servers is evaluated using concept of entropy. The entropy function which is widely used in thermodynamics and information theory is used and applied in software market share analysis. The results states that entropy in market share analysis can be used to represent the market diversity. The case studies on the market share of programming languages, operating systems, web browsers, and web servers showed that in general, these software markets are becoming more and more diverse.
Paper [16] presented quantitative model of the evolution of software technology trends for different families of software products such as programming languages, operating systems, middleware systems and database management systems. Authors proposed regression model for predicting trend. The data is collected from the web based survey, books, technical papers, journals, and other documents.
Yaofei Chen et al. [17] presented results of multivariate regression model for predicting programming language trends. As a case study authors considered 17 high level programming languages such as Ada, Algol, APL, Basic, C, C++, Cobol, Eiffel, Fortran, Java, Lisp, ML, Modula, Pascal, Prolog, Scheme and Smalltalk. Their result shows that, Java will be the only language that’s still increasing in popularity. C# is new in market and will affect the Java’s future popularity.
-
IV. Results amd Disucussion
This section presents results of forecasting of different software technology product families viz., desktop and mobile operating systems, search engines, web browsers, web servers and programming languages.
Four growth curve methods namely Logistic, Gompertz, Log Logistic and Mono-Molecular growth curve methods are used for forecasting. First assumption behind growth curves is that the upper limit of the technology is known. The choice of upper limit is independent of the choice of growth curve. It is difficult to find the upper limit for any technology product. Upper limits taken in this paper are sufficiently higher values than the values reported in historical data.
-
A. Desktop Operating Systems
Out of hundreds of operating systems developed, only few are very successful. Two operating systems initially dominated the personal computer and workstation: Microsoft's MS-DOS and UNIX. Later on there is a series of Windows based and UNIX based operating systems [13].
For Desktop Operating Systems, the data is extracted from W3Schools' log-files, over an eleven year period and on a yearly basis, spanning from 2003 to 2013 [18]. Figure 1 shows the forecasted results for operating systems technologies.
Windows Actual
Windows Forecasted
LINUX actual
LINUX Forecasted
^* < ^* MAC actual
MAC forecasted
2008 2010 2012 2014 2016 2018 2020 2022 2024 2026
Year
Fig.1. Forecasted Results for Operating Systems Technologies.
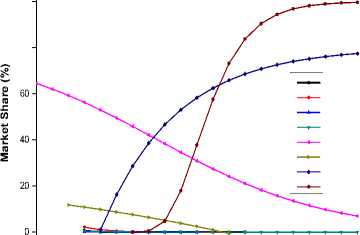
Microsoft Windows Operating System has captured more than 90% of the market share but it seems to be slightly declining in coming future. MAC Operating Systems are growing rapidly in market being second in usage market share. The Linux Operating system is growing slowly than MAC OS in market even it came before MAC OS.
The results obtained are similar to [12] [14]. In [14], authors forecasted market evolution of operating systems by applying the Lotka–Volterra model. The conclusions are as follows,
-
• Windows will remain the leader in the market with an 81% market share. But its shares are reduced.
-
• Mac OSX is expected to reach a 12% market share.
-
• Linux has a low growth rate, yet it is not pushed out of the market. Despite the fact that competition is hard for Linux, its market share increases reaching a 7% and co-exists with the two other systems.
All of the three data sources agree that Microsoft Windows family is the dominant operating system with a market share of about 90%. According market models, operating systems market follows pure monopoly in market structure.
Microsoft has adopted incremental product development model. Table 2 shows error measures of Windows operating systems products.
Figure 2 shows the forecasted results on market share for Windows operating systems products using best fitted growth curve method.
Microsoft ended support for Windows 98 and Windows ME from July 11, 2006. Windows 2000 is unsupported from July 13, 2010. Windows NT is a family of operating systems produced by Microsoft, the first version of which was released in July 1993. Figure 2 shows that these Windows operating systems product will be completely out of market in next three years. The quantitative forecasting with growth curve shows that Windows XP will remain in the market till 2026. But as Microsoft declared of end of support for Windows XP by April 8, 2014 [19]. Probably it will vanish earlier than 2026. Windows Vista shows very short product life cycle. Windows 7 and Windows 8 is gaining popularity in the global market. All the Windows operating systems products are not very successful. Windows 98 and Windows XP are comparatively has long life cycle than Windows 2000, Windows ME and Windows Vista.
Windows 98
Windows 2000 Windows ME Windows NT Windows XP
Windows Vista
Windows 7 Windows 8
2006 2008 2010 2012 2014 2016 2018 2020 2022 2024 2026
Year
Fig.2. Forecasted Results for Windows Operating Systems Products Using Best Fitted Growth Curve Method.
For all the operating systems products, dataset from the introduction of the operating systems is not available. So it is difficult to see the life cycle of all the operating systems. Figure 2 shows that Windows 7 and Windows 8 are following technology life cycle S curve. Best fitted growth curve methods to Windows 7 and Windows 8 are Mono molecular and Gompertz respectively.
MAC OS X 10.4, MAC OS X 10.5, MAC OS X 10.6 released on April 2005, October 2007 and August 2009 respectively. MAC OS X 10.4 and MAC OS X 10.5 are currently unsupported. MAC OS X 10.8 Mountain Lion is the ninth major release of MAC OS X released on July 25, 2012.
Table 2. Performance measure for growth curves for Windows Operating Systems.
|
Windows OS Versions |
Upper limit (L) in % |
Gompertz |
Logistic |
Log logistic |
Mono-Molecular |
||||
|
MAE |
RMSE |
MAE |
RMSE |
MAE |
RMSE |
MAE |
RMSE |
||
|
Windows XP |
80 |
13.82 |
17.14 |
13.91 |
16.73 |
16.45 |
19.75 |
14.45 |
18.01 |
|
90 |
14.18 |
16.95 |
14.45 |
17.05 |
16.91 |
19.46 |
14.27 |
17.38 |
|
|
100 |
14.55 |
17.04 |
14.73 |
17.38 |
17.27 |
19.50 |
14.45 |
17.23 |
|
|
Windows Vista |
20 |
3.14 |
4.83 |
3.29 |
4.96 |
3.86 |
5.27 |
3.29 |
4.92 |
|
30 |
3.29 |
4.92 |
3.29 |
5.12 |
4.00 |
5.40 |
3.14 |
4.81 |
|
|
Windows 7 |
80 |
3.40 |
3.87 |
5.80 |
7.27 |
2.40 |
3.61 |
0.80 |
1.43 |
|
90 |
3.40 |
4.37 |
6.40 |
8.06 |
2.80 |
4.23 |
0.80 |
1.50 |
|
|
100 |
3.80 |
4.77 |
7.00 |
8.72 |
3.20 |
4.74 |
0.80 |
1.59 |
|
|
Windows 8 |
80 |
0.00 |
0.26 |
0.00 |
0.40 |
0.00 |
0.46 |
0.33 |
1.09 |
|
90 |
0.00 |
0.25 |
0.00 |
0.41 |
0.00 |
0.46 |
0.33 |
1.08 |
|
|
100 |
0.00 |
0.24 |
0.00 |
0.41 |
0.00 |
0.46 |
0.33 |
1.08 |
|
Bold indicates best fitted values.
Table 3. Performance measure for growth curves for Mobile and Laptop Operating Systems.
|
Mobile & Tablet OS |
Upper limit (L) in % |
Gompertz |
Logistic |
Log logistic |
Mono-Molecular |
||||
|
MAE |
RMSE |
MAE |
RMSE |
MAE |
RMSE |
MAE |
RMSE |
||
|
Android |
50 |
0.20 |
0.75 |
1.00 |
1.90 |
0.20 |
0.65 |
0.60 |
1.51 |
|
60 |
0.40 |
1.00 |
1.20 |
2.27 |
0.20 |
0.57 |
0.40 |
1.27 |
|
|
70 |
0.60 |
1.18 |
1.60 |
2.54 |
0.00 |
0.57 |
0.40 |
1.14 |
|
|
Blackberry |
10 |
0.33 |
0.89 |
0.50 |
1.00 |
0.33 |
0.89 |
0.33 |
0.83 |
|
20 |
0.33 |
0.93 |
0.50 |
1.03 |
0.33 |
0.93 |
0.50 |
0.84 |
|
|
30 |
0.33 |
0.94 |
0.50 |
1.04 |
0.33 |
0.95 |
0.50 |
0.84 |
|
|
iOS |
80 |
8.67 |
10.74 |
8.67 |
10.62 |
8.83 |
10.66 |
8.67 |
10.92 |
|
90 |
8.50 |
10.58 |
8.50 |
10.52 |
8.83 |
10.52 |
8.67 |
10.69 |
|
|
100 |
8.50 |
10.53 |
8.33 |
10.50 |
8.83 |
10.49 |
8.83 |
10.61 |
|
|
Java ME |
40 |
2.60 |
3.03 |
1.60 |
2.53 |
2.40 |
3.63 |
3.60 |
4.59 |
|
50 |
2.20 |
2.84 |
2.00 |
2.93 |
3.40 |
4.70 |
2.80 |
3.54 |
|
|
Symbian |
20 |
2.50 |
3.95 |
2.83 |
4.11 |
3.33 |
4.71 |
2.50 |
3.97 |
|
30 |
2.67 |
4.08 |
3.00 |
4.32 |
3.67 |
4.93 |
2.50 |
3.93 |
|
|
Other |
30 |
3.50 |
4.89 |
2.67 |
4.44 |
1.50 |
2.12 |
6.83 |
8.02 |
|
40 |
3.17 |
4.77 |
2.83 |
4.90 |
1.17 |
2.17 |
5.83 |
6.61 |
|
Bold indicates best fitted values.
Figure 3 shows the forecasted results on market share for MAC operating systems products. It shows that MAC OSX 10.4 and 10.5 will be completely out of market up till 2017. MAC OSX 10.6 and 10.7 shows linear upward trend. MAC OSX 10.8 follows technology life cycle S curve.
-
B. Mobile and Laptop Operating Systems
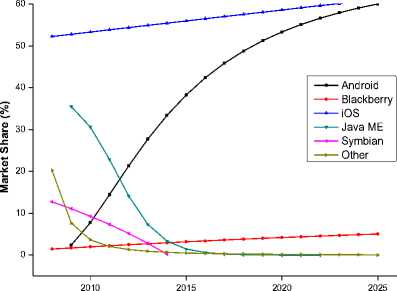
For Mobile and Laptop Operating Systems, the data were extracted from NetMarketShares log-files, over a six year period and on a yearly basis, spanning from 2008 to 2013 [20].
Figure 4 shows the forecasted results on market share for mobile and laptop operating systems using best fitted growth curve method.
Except iOS and Android remaining products are in decline phase. Market share of iOS is more than 50% and shows very slow linear growth. Android is following technology life cycle S curve with best flitted model Log Logistic. Near to 2025, Android will capture more market share than it’s competitors.
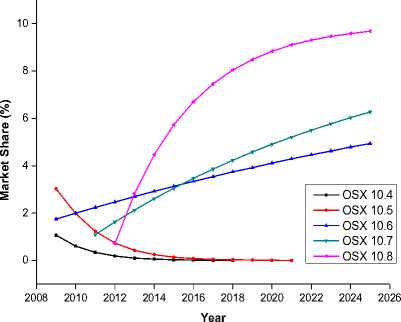
Fig.3. Forecasted Results on Market Share for MAC Operating Systems Products.
Year
Fig.4. Forecasted Results for Mobile and Laptop Operating Systems using Best Fitted Growth Curve Method.
In the year 2009, iOS and android covered major share of mobile and laptop operating systems market. In the year 2013, concentration ratio of iOS and android is 84.78%. But it is not in duopoly market structure. A duopoly is defined as a market in which the greatest part of the market share is held by two companies. But in this case there are two companies with uneven market shares. The market structure can be defined as oligopoly. The forecasted results shows that after year 2020, the market share of iOS and Android will be very close and concentration ratio will be more than 85%. It indicates that after year 2020 market structure will shift form oligopoly to duopoly.
-
C. Search Engines
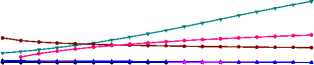
Tom Seymour et al. [21] reported history of search engines. WebCrawler and Lycos launched in 1994. Soon after, many search engines appeared namely Magellan, Excite, Infoseek, Inktomi, Northern Light, and AltaVista and Yahoo! Ask was a search engine founded in 1996 by Garrett Gruener and David Warthen in Berkeley, California. Around 2000, Google's search engine rose to prominence. Microsoft first launched MSN Search in the fall of 1998. In 2004, Microsoft started its own web crawler. Microsoft's rebranded search engine, Bing, was launched on June 1, 2009. In the People's Republic of China, Baidu held a 61.6% market share for web search in July 2009.
For Search Engines, the data were extracted from MarketShares log-files, over a six year period and on a yearly basis, spanning from 2008 to 2013 [20].

• AltaVista
•- AOL
^^*,— Ask
V Baidu
—•— Excite
• Lycos
—•— Yahoo
• Bing

2015 2020 2025
Year
Fig.5. Forecasted Results on Market Share for Search Engines using Best Fitted Growth Curve Method.
The results states that the market share of Google will be declined slowly. AOL, AltaVista, Lycos and Ask web browsers will be out of market in coming years. The market share of Baidu and Bing web browsers will be increased in coming years.
Many search engine companies were caught up in the dot-com bubble, a speculation-driven market boom that peaked in 1999 and ended in 2001. Yahoo! acquired Inktomi in 2002 and Overture (which owned AlltheWeb and AltaVista) in 2003. In a market dominated by Google, in 2009 Yahoo! and Microsoft announced the intention to forge an alliance [21].
Even after big merge and acquisitions, in year 2013 search engine market structure follows monopoly because Google contains 77.46% of market shares which is maximum in total market. According to forecasted results, in the year 2025 market shares of Google and Baidu will be 71.72% and 21.22% respectively. Which indicates that the search engine market shift from monopoly to oligopoly.
-
D. Web Browsers
For Web Browsers, the data were extracted from W3Schools' log-files, over a twelve year period and on a yearly basis, spanning from 2002 to 2013 [18].
Figure 6 shows the forecasted results on market share for web browser using best fitted growth curve method. Mozilla and Netscape navigator will be out of market in coming years. The results show that the market share of Internet Explorer will be declined very rapidly. The market share of Safari and Opera will be very slowly increased in coming years. Firefox and Chrome shows upward trend. Chrome follows technology life cycle S curve with best fitted growth curve method, Gompertz.
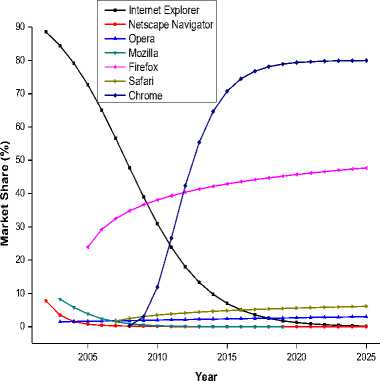
Fig.6. Forecasted Results on Market Share for Web Browsers using Best Fitted Growth Curve Method.
In the year 2002, Internet Explorer was most popular web browsers with more than 88% market share. The market structure was pure monopoly.
In the year 2013, Chrome has 52.32% of market shares which is not enough for monopoly. Concentration ratio of Chrome, Internet Explorer and Firefox is maximum i.e. 92.92%. It indicates that web browser market structure follows oligopoly. Forecasted result shows that in coming year’s market share of Chrome and Firefox will dominate the global market. But the search engine market structure will remain in oligopoly as the market share Chrome and Firefox will be uneven.
-
E. Web Servers
For Web Server vendors, the data were extracted from Netcrafts' log-files, over a nineteen year period and on a yearly basis, spanning from 1995 to 2013[22].
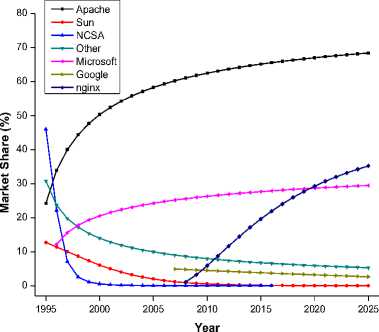
Fig.7. Forecasted Results on Market Share for Web Servers using Best Fitted Growth Curve Method.
Figure 7 shows the forecasted results on market share for web servers using best fitted growth curve method. The results states that the market share of Sun, Google and NCSA web server vendors’ will be declined slowly. The market share of Apache, Microsoft and nginx web server vendors’ will be increased in coming years.
In the year 1995, NCSA was major player in the market with 46% market share. The market share is reduced to 22% and 7% in next two years. In 1996 onwards there is oligopoly in web server market. In 1996 and 1998 apache, sun and NCSA acquired 69% of market shares. Since 1999to 2012 apache and Microsoft contains oligopoly.
In the year 2013, Apache, Microsoft and nginx contains 86.00% of market shares and their concentration ratio is also high so web server follows oligopoly market model.
-
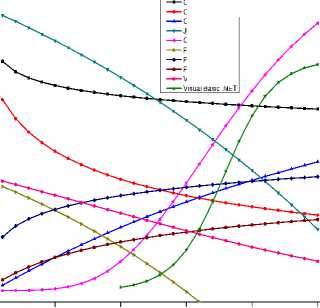
F. Programming Languages
For Programming Languages, the data were extracted from TIOBEs' log-files, over a thirteen year period and on a yearly basis, spanning from year 2001 to year 2013 [23]. The TIOBE Programming Community index is an indicator of the popularity of programming languages.
C
C++
C#
Java
Objective C
Perl
PHP
Python
Visual Basic
Visual Basic NET
2005 2010 2015 2020 2025
Year
Fig.8. Forecasted Results on Market Share for Top 10 Programming Languages using Best Fitted Growth Curve Method.
Figure 8 shows the forecasted results on market share for top 10 programming languages using best fitted growth curve method. The results states that C, C++, Java, Visual Basic, Java languages will decline their market share slowly. The market share of Objective C, VB.NET, C#, Python, PHP languages will be increased in coming years. Objective C and Visual Basic .NET shows technology S curve with Gompertz curve and Logistic curve respectively. Programming languages namely D, Delphi Object Pascal, F#, JavaScript, Lisp, MATLAB, Pascal, PL SQL, Ruby, Transact SQL are in use but there market share is very small.
The results obtained are different from reported in [17]. The time frame of investigation, indicator and methodology used in this paper is different from [17]. According to actual values of programming language in year 2001 C, C++, Java, Perl, Visual basic had 76.07% of market shares which shows that there was oligopolistic competition in market. In actual market shares in year indicates that programming language market follows pure 2013 and forecasted market shares upto year 2025 competition.
Table 4. Performance Measure for Growth Curves for Web Browsers
|
Web Browsers |
Upper limit (L) in % |
Gompertz |
Logistic |
Log logistic |
Mono-Molecular |
||||
|
MAE |
RMSE |
MAE |
RMSE |
MAE |
RMSE |
MAE |
RMSE |
||
|
Chrome |
80 |
1.67 |
2.57 |
7.17 |
9.02 |
4 |
5.44 |
3.62 |
5.12 |
|
90 |
2.17 |
3.18 |
8 |
10.68 |
5 |
6.74 |
3.33 |
4.47 |
|
|
100 |
2.67 |
3.73 |
9.17 |
12.25 |
5.5 |
7.93 |
2.83 |
4.04 |
|
|
Firefox |
70 |
6.56 |
8.04 |
6.89 |
8.09 |
5.56 |
7.03 |
6.56 |
8.06 |
|
80 |
6.78 |
8.06 |
6.89 |
8.13 |
5.56 |
7.1 |
6.67 |
8.05 |
|
|
90 |
6.89 |
8.08 |
6.89 |
8.17 |
5.56 |
7.15 |
6.67 |
8.05 |
|
|
Internet Explorer |
90 |
3.42 |
4.51 |
1.25 |
2.36 |
4.67 |
5.53 |
9.08 |
14.6 |
|
100 |
1.42 |
2.16 |
1.08 |
1.95 |
7 |
8.12 |
5 |
7.48 |
|
|
Mozilla |
20 |
1.4 |
2.56 |
1.4 |
1.68 |
1.8 |
3.07 |
1.6 |
2.5 |
|
30 |
1.6 |
2.6 |
1.4 |
2.74 |
1.8 |
3.14 |
1.4 |
2.5 |
|
|
40 |
1.6 |
2.63 |
1.4 |
2.76 |
1.8 |
3.17 |
1.4 |
2.5 |
|
|
Netscape Navigator |
10 |
0.4 |
0.92 |
0.2 |
0.66 |
0 |
0.37 |
1.2 |
1.69 |
|
20 |
0.4 |
0.69 |
0 |
0.44 |
0 |
0.56 |
0.6 |
1.21 |
|
|
30 |
0.2 |
0.63 |
0 |
0.39 |
0.2 |
0.69 |
0.6 |
1.15 |
|
|
Opera |
5 |
0 |
0.23 |
0 |
0.23 |
0 |
0.24 |
0 |
0.23 |
|
10 |
0 |
0.23 |
0 |
0.23 |
0 |
0.24 |
0 |
0.23 |
|
|
20 |
0 |
0.23 |
0 |
0.23 |
0 |
0.24 |
0 |
0.23 |
|
|
Safari |
10 |
0 |
0.38 |
0 |
0.43 |
0 |
0.23 |
0 |
0.34 |
|
20 |
0 |
0.42 |
0 |
0.47 |
0 |
0.26 |
0 |
0.36 |
|
|
30 |
0 |
0.43 |
0 |
0.48 |
0 |
0.27 |
0 |
0.36 |
|
Bold indicates best fitted values.
Table 5. Performance Measure for Growth Curves for Web Servers.
|
Web Server Vendors |
Upper limit (L) in % |
Gompertz |
Logistic |
Log logistic |
Mono-Molecular |
||||
|
MAE |
RMSE |
MAE |
RMSE |
MAE |
RMSE |
MAE |
RMSE |
||
|
Apache |
80 |
8.37 |
11.58 |
8.74 |
11.50 |
7.00 |
8.61 |
8.32 |
11.90 |
|
90 |
8.63 |
11.58 |
9.16 |
11.67 |
7.58 |
9.09 |
8.37 |
11.77 |
|
|
100 |
8.84 |
11.62 |
9.37 |
11.84 |
8.00 |
9.44 |
8.42 |
11.73 |
|
|
|
10 |
0.86 |
1.37 |
0.71 |
1.37 |
0.71 |
1.40 |
0.71 |
1.38 |
|
20 |
0.71 |
1.37 |
0.71 |
1.38 |
0.71 |
1.41 |
0.86 |
1.37 |
|
|
30 |
0.71 |
1.38 |
0.71 |
1.38 |
0.71 |
1.41 |
0.86 |
1.37 |
|
|
Microsoft |
40 |
4.56 |
6.46 |
4.50 |
6.46 |
4.22 |
5.83 |
4.44 |
6.54 |
|
50 |
4.39 |
6.45 |
4.67 |
6.52 |
4.50 |
5.96 |
4.39 |
6.47 |
|
|
60 |
4.5 |
6.46 |
4.78 |
6.56 |
4.44 |
6.05 |
4.33 |
6.46 |
|
|
NCSA |
50 |
4.6 |
6.64 |
2.6 |
3.66 |
0 |
0.21 |
12.8 |
16.21 |
|
60 |
3.2 |
4.75 |
1.4 |
2.08 |
1 |
1.98 |
9.2 |
11.06 |
|
|
nginx |
30 |
0 |
0.57 |
0.5 |
0.92 |
0.17 |
0.69 |
0.33 |
0.92 |
|
40 |
0 |
0.58 |
0.5 |
1.1 |
0 |
0.59 |
0.33 |
0.79 |
|
|
50 |
0 |
0.62 |
0.67 |
1.23 |
0 |
0.56 |
0.33 |
0.73 |
|
|
Sun |
20 |
0.92 |
1.78 |
0.77 |
1.74 |
1.54 |
2.5 |
1.31 |
2.28 |
|
30 |
0.85 |
1.78 |
0.92 |
1.83 |
1.69 |
2.93 |
1.31 |
2.08 |
|
|
40 |
0.85 |
1.79 |
0.91 |
1.88 |
1.77 |
3.16 |
1.31 |
2.02 |
|
|
Other |
40 |
4.21 |
5.5 |
3.68 |
5.15 |
2.11 |
3.39 |
5.32 |
6.56 |
|
50 |
3.84 |
5.31 |
3.53 |
5.16 |
1.95 |
3.21 |
4.79 |
5.97 |
|
|
60 |
3.74 |
5.27 |
3.47 |
5.18 |
1.84 |
3.16 |
4.37 |
5.8 |
|
Bold indicates best fitted values.
-
V. Conclusions and Future Work
This paper forecasted the growth pattern of software technology products using growth curve methods. Different products follow different growth curve pattern. The limitation is with products with less dataset. It causes similar performances of all the growth curve methods and inability of identification of upper limit for the products.
Table 6 shows the little change in market structure for selected technologies in next 10 years. The market structure of software technologies indicates that one or two providers have major market share except programming languages. The forecasted market structure shows that the market of respective technology remains dominated by one or two technology providers. A reason behind the monopoly or oligopoly market structure is high technological superiority of one provider with consistent technological improvement over potential competitors. The results show that major software technology providers in their market space such as Java ME (Mobile and Tablet Operating System), Internet Explorer (web browser), NCSA (web server) are will be out of the market due to high competition and lag behind the technological advances.
Table 6. Results of Market Structure.
|
Software Product Technologies |
(Year) |
Year 2013 |
Year 2025 |
|
Desktop operating System |
Monopoly (2008) |
Monopoly |
Monopoly |
|
Mobile & Laptop operating System |
Oligopoly (2009) |
Oligopoly |
Oligopoly |
|
Search Engine |
Monopoly (2008) |
Monopoly |
Oligopoly |
|
Web Browser |
Monopoly (2002) |
Oligopoly |
Duopoly |
|
Web Server |
Oligopoly (1995) |
Oligopoly |
Oligopoly |
|
Programming Language |
Oligopoly (2001) |
Pure competition |
Pure competition |
Growth pattern of high technology software product is influenced by the market structure. The technology product family in the monopoly or oligopoly does not guarantee the presence of “S” shaped life cycle pattern. Majority product families follow increasing / decreasing life cycle pattern. All the technology product providers follow incremental product development. The product families show increasing life cycle pattern probability follows scalloped pattern or innovative maturity for individual incremental products. Few products such as Windows 7, Windows 8, MAC OS X 10.8 and Chrome web browser shows growth pattern similar to “S” shaped curve.
Future work: Investigation of life cycle of software technologies with complete data of all incremental products. Also there is scope to investigate the influence of economical, social, government factors on market growth and structure of software technology products.
Список литературы Technology Forecasting: A Case Study of Software Technology Product Families
- C. V. Trappey, H. Y. Wu, An evaluation of the time-varying extended logistic, simple logistic, and Gompertz models for forecasting short product lifecycles. Advanced Engineering Informatics, 22 (4) (2008), 421−430.
- P. Kotler, G. Armstrong, Principles of Marketing. Pearson Education, 2010.
- D. R. Rink, J. E. Swan, Product life cycle research: A literature review. Journal of business Research, 7 (3) (1979), 219−242.
- Jin Tao, Research on gompertz curve model used for mobile user growth. Presented at the Proceedings of the ICENT'10, pp. 557−560, 2010.
- X. Liu, F. S. Wu, W. L. Chu, Diffusion of mobile telephony in China: drivers and forecasts. IEEE Transactions on Engineering Management, 59 (2) (2012), 299 −309.
- W. L. Chu, F. S. Wu, K. S. Kao, D. C. Yen, Diffusion of mobile telephony: An empirical study in Taiwan. Telecommunications Policy, 33 (9) (2009), 506−520.
- R. J. Kauffman, A. A. Techatassanasoontorn, The global diffusion patterns of successive technology generations: modeling analog and digital wireless phone growth. Presented at the Proceedings of the ICTD'06, pp. 266−276, 2006.
- J. R. Yu, Y. W. Dong, Y. H. Chang, F. M. Tseng, Comparison of innovation diffusion models: A case study on the DRAM industry. Presented at the Proceedings of the FUZZ-IEEE'12, pp.1−7, 2012.
- D. D. Nguyen, D. S. Kira, Market structure, competition and equilibrium in electronic commerce setting.
- A. L. Silva, Chamberlain on product differentiation, market structure and Competition: An essay. Porto: Faculdade de Economia do Porto, Universidade do Porto, 2001.
- E. Musonera, International trade: An explanation of today's foreign direct investment into emerging economies. Journal of Global Business Management, 4 (2) (2008), 214−220.
- Y. Peng, F. Li, A. Mili, Modeling the evolution of operating systems: An empirical study. Journal of Systems and Software, 80 (1) (2007), 1−15.
- Y. Peng, Characterizing the evolution of operating systems. Ph.D. dissertation, New Jersey Institute of Technology, 2005.
- S. Lakka, C. Michalakelis, D. Varoutas, D. Martakos, Competitive dynamics in the operating systems market: Modeling and policy implications. Technological Forecasting and Social Change, 80 (1) (2013), 88−105.
- L. Yu, S. Ramaswamy, R. B. Lenin, Entropy studies of software market evolution. Presented at the Proceedings of the Eighth Annual Conference on Applied Research in Information Technology, pp.87−91, 2009.
- L. B. A. Rabai, Y. Z. Bai, A. Mili, A quantitative model for software engineering trends. Information Sciences, 181 (22) (2011), 4993−5009.
- Y. Chen, R. Dios, A. Mili, L. Wu, K. Wang, An empirical study of programming language trends. Software, 22 (3) (2005), 72−79.
- http://www.w3schools.com, Accessed Nov 2014.
- http://windows.microsoft.com/en-in/windows/lifecycle, Accessed 10 March 2015.
- www.netmarketshare.com, Accessed Nov 2014.
- T. Seymour, D. Frantsvog, S. Kumar, History of search engines. Presented at the Proceedings of the IJMIS'11, Vol. 15, No. 4, pp.47−58, 2011.
- http://news.netcraft.com, Accessed.
- http://www.tiobe.com, Accessed Nov 2014.
