Temporal and spatial variation of gross primary productivity and its response to extreme climate in Mongolia

Author: Ai L., Bayarsaikhan S., Otgonbayar M., Gantumur B., Davaadorj B., Bayarsaikhan B., Bao Yu., Dashlegtseg G.
Journal: Природа Внутренней Азии @nature-inner-asia
Section: Биология
Article in issue: 2 (31), 2025.
Free access
Mongolia has extremely fragile ecosystems and rich vegetation resources in arid and semi-arid zones. It is highly affected by extreme climatic events and is important in the global carbon cycle. In global warming, it is important to study its vegetation changes for ecological security. In this paper, based on the gross primary productivity (GPP) data with daily maximum temperature, daily minimum temperature and daily precipitation data of Mongolia from 2000 to 2023, the characteristics of spatial and temporal changes in GPP and its response to climate extremes were analyzed by using Sen Slope + Mann-Kendall trend analysis, MK mutation test, Pearson’s correlation analysis method, and structural equation modeling (SEM). The main findings of the studyare as follows: (1) The overall trend of GPP in Mongolia from 2000 to 2023 is upward. Most areas with high GPP values are located in the northern Sayanleng and Khangai Mountains, and the areas with significant increases account for 61 % of the total area of the study area; (2) Extreme temperature indices (SU, TNx, TNn) and extreme precipitation index R20 show an increasing trend at most weather stations in Mongolia, while other extreme precipitation indices (R95P, SDII) show a decreasing trend;(3) Extreme precipitation indices contributed to the effect of GPP in the study area, but they all inhibited GPP in Zabkhan province. R20 is the main factor influencing vegetation growth. Extreme temperature indices TNx and SU inhibited GPP and promoted GPP excepting the cold all year round Khuvsgul province, where GPP was promoted due to summers became warmer; (4) R20 and R95P significantly affect GPP positively and negatively, respectively. This opposed relationship reflects the dual role of precipitation pattern and intensity in regulating vegetation productivity. Other indices may influence ecosystem dynamics through indirect pathways under extreme climate change scenarios. The study’s results can provide scientific references for Mongolia’s ecological environment protection and green sustainable development.
Gpp, extreme climate events, extreme climate indices, mongolia
Short address: https://sciup.org/148332244
IDR: 148332244 | DOI: 10.18101/2542-0623-2025-2-30-49
Временная и пространственная изменчивость валовой первичной продуктивности и её реакция на экстремальный климат в Монголии
В засушливых и полузасушливых зонах Монголии формируются неустойчивые экосистемы с богатыми растительными ресурсами, подверженные сильному влиянию экстремальных климатических явлений и имеющие важное значение в глобальном углеродном цикле. В условиях глобального потепления возрастает роль изучения изменения растительности для обеспечения экологической безопасности. В этой статье проанализированы характеристики пространственных и временных изменений валовой первичной продуктивности (GPP) и ее реакция на экстремальные климатические явления на основе сведений GPP с данными о суточной максимальной температуре, суточной минимальной температуре и суточных осадках Монголии с 2000 по 2023 г. с использованием анализа тренда Sen Slope + Mann-Kendall, теста мутации MK, метода корреляционного анализа Пирсона и моделирования структурных уравнений (SEM). В результате исследования получены следующие выводы: (1) В период с 2000 по 2023 гг. в Монголии отмечена тенденция увеличения валовой первичной продуктивности GPP. Большинство районов с высокими значениями GPP расположено в северных горах Саянленг и Хангай, а районы со значительным ростом составляют 61 % общей площади исследуемой области; (2) Индексы экстремальных температур (SU, TNx, TNn) и индекс экстремальных осадков R20 демонстрируют тенденцию к росту на большинстве метеостанций Монголии, в то время как другие индексы экстремальных осадков (R95P, SDII) демонстрируют тенденцию к снижению; (3) Индексы экстремальных осадков способствовали увеличению GPP в исследуемой области, кроме провинции Завхан. R20 является основным фактором, влияющим на рост растительности. Индексы экстремальных температур TNx и SU на территории Монголии влияли на уменьшение GPP за исключением аймака Хубсугул, в котором GPP увеличилась за счет более теплого лета;(4) R20 и R95P значительно влияют на регулирование продуктивности растительности. Другие индексы могут влиять на динамику экосистемы косвенными путями при сценариях экстремальных изменений климата. Результаты исследования могут представлять научную основу для защиты окружающей среды Монголии и зеленого устойчивого развития.
Text of the scientific article Temporal and spatial variation of gross primary productivity and its response to extreme climate in Mongolia
Gross Primary Productivity (GPP) is a key metric that quantifies the total organic matter produced by green plants in terrestrial vegetation ecosystems through the fixation of CO2 by photosynthesis. It serves as the initial energy input into the terrestrial ecosystem cycle, reflecting the productivity of terrestrial ecosystem vegetation under natural conditions [Chen et al., 2019; Wang et al., 2020; Tang et al., 2022]. More than just a number, GPP is a significant negative feedback mechanism in the carbon sink system and a key indicator of the interaction between the Earth’s atmosphere and biosphere [Beer et al., 2010; Wang et al., 2016]. It is a powerful tool that can reflect the growth of vegetation to varying degrees and the response of vegetation to climate change [Ge et al., 2021; Wu et al., 2022]. With the increasing impacts of global climate change and anthropogenic activities, future changes in ecosystem structure and its GPP are inevitable. Therefore, quantifying the spatial and temporal dynamics of GPP is not just of great significance for carbon cycle estimation. Still, it also provides a significant reference value for regulating terrestrial ecological processes and sustainable development [Yan et al., 2016; Zelalem et al., 2016; Yao et al., 2018]. This research on GPP is crucial for understanding and managing ecosystem productivity in the face of climate change.
Global warming has become a profound challenge humanity faces nowadays [Qin, 2014]. According to the Intergovernmental Panel on Climate Change (IPCC) report in 2023 [Asadnabizadeh, 2023], global warming has caused the temperature to rise to 2.5– 2.9 °C, much higher than the expected temperature level in the early part of this century. Extreme weather events have become the most significant source of disasters [Zhou and Qian, 2021]. Extreme climate events occur when the local weather differs significantly from its average conditions, and they pose a more substantial threat to human societies and natural ecology than average changes in climate due to their unpredictable, destructive, and sudden nature [Guobin et al., 2013; Aghakouchak et al., 2014; Wu et al., 2014]. Climate extremes affect photosynthesis, respiration, plant growth, and ecosystem carbon balance [Reichstein et al., 2013]. Extreme climate events such as high temperatures and floods can severely impact vegetation transpiration, leading to mortality1 [IPCC, 2012; Zhang et al., 2014; Yu et al., 2014]. Global warming will increase the frequency and intensity of extreme climate events [Lloret et al., 2012; Horton et al., 2015]. In the future, extreme climate events will occur more frequently, causing irreversible phenomena like perennial permafrost melting, since the photosynthesis process is susceptible to extreme climate events [Ciais et al., 2005; Ahlström et al., 2015; Zhang et al., 2016]. Therefore, exploring the spatial and temporal distribution of GPP and extreme climate events and the relationship between the two is of great significance for disclosing changes in gl obal terrestrial ecosystems. Temperature affects vegetation changes mainly at large regional scales. In contrast, precipitation plays a more critical role at small regional scales, with a particularly significant effect in arid and semi-arid zones [Yu et al., 2004].
Mongolia is located in arid and semi-arid regions. It is affected by summer, winter, and westerly winds, making the climate system highly complex and one of the most sensitive regions regarding global climate change response. It is also a critical livestock base in East Asia and is highly dependent on the growth conditions of terrestrial vegetation [Zhang et al., 2016; Siqin et al., 2018]. Mongolia’s ecosystems are considered as fragile, and the vegetation is sensitive to climate change [Chen et al., 2022]. Extreme climatic events can seriously impact vegetation growth status, even disrupting the energy cycle of ecosystems [Gajewski, 2015]. Therefore, it is essential to consider the impacts of local extreme climate events when exploring the vegetation GPP changes in the study area. Accurate estimation of GPP provides timely information on ecosystems’response to extreme events and is valuable for understanding ecosystem functioning, carbon cycling, and feedback to climate.
Therefore, studying spatial and temporal variations of GPP in Mongolia in response to climateextremes is essential for ecological conservation and disaster prevention in Mongolia.
Materials and Methods
Study Area
The study has focused on Mongolia, a unique country in Central Asia. It has a total area of 1565 million km2, and its border extends between the latitudes of 41°35′ N to 52°09′ N and the longitudes of 87°44′ E to 119°56’ E. This area also represents arid and semi-arid regions between the Great Siberian boreal forest and the Central Asian deserts. Mongolia consists of 21 administrative units (provinces).
Data Collection
The Moderate Resolution Imaging Spectroradiometer (MODIS) GPP data, with a spatial resolution of 500 m, was collected from 2000 to 2023 from NASA’s MOD17A2H data product . It was processed and downloaded by Google Earth Engine and then pre-processed by resampling, reprojection, etc., to obtain the multi-year annual average GPP and seasonal GPP time series covering Mongolia.
Meteorological data from 2000 to 2023 from the National Oceanic and Atmospheric Administration (NOAA) consists of the National Center for Environmental Information (NCEI) released by the NCEI Site’s daily meteorological data set gov/). The precipitation, daily maximum temperature, and daily minimum temperature of each meteorological station in the data set were selected for analysis and research. The RClim Dex model, a widely used tool for climate data analysis, was used to check and control the quality of daily value meteorological data of selected meteorological stations. Then, the RClim Dex model was used to calculate the extreme climate index of each selected meteorological station in Mongolia from 2000 to 2023. The Inverse Distance Weighted (IDW) method, a spatial interpolation technique commonly used in environmental studies, was used to interpolate the extreme climate index into raster data with a spatial resolution of 500 m using R language.
Data Analysis
Sen’s Slope and Mann-Kendall trend test
Sen’s Slope and Mann-Kendall trend test, two reliable and widely accepted methods, are employed to analyze the temporal and spatial evolution characteristics of vegetation GPP and extreme climate in Mongolia during 2000–2023. This rigorous analysis examines the significance of changes in the time series, with Sen’s Slope effectively eliminating the influence of abnormal and discrete data on the overall trend results, ensuring the credibility of our research.
Table 1
|
ID |
Indicator name |
Definitions |
UNITS |
|
SU25 |
Summer days |
Annual count when TX (daily maximum) > 25ºC |
Days |
|
TNx |
Max T min |
The monthly maximum value of the daily minimum temp |
º C |
|
TNn |
Min T min |
The monthly minimum value of the daily minimum temp |
º C |
|
R20 |
Number of hefty precipitation days |
Annual count of days when PRCP > = 20 mm |
Days |
|
SDII |
Simple daily intensity index |
Annual precipitation is divided by the year’s wet days (PRCP > = 1.0 mm) |
Mm/day |
|
R95p |
Very wet days |
Annual total PRCP when RR > 95th percentile |
Mm |
Selection of extreme climate indices
The Mann-Kendall trend test is utilized to reveal the significance of the changing trends of vegetation GPP and climate extremes in Mongolia from 2000 to 2023. The test statistic Z value of the Mann-Kendall significance test classifies the changing trends of vegetation GPP into six change grades, underscoring the importance of our findings: significant decrease, insignificant decrease, insignificant increase, significant increase, and stable.
Mann-Kendall mutation test
The Mann-Kendall mutation test, a non-parametric statistical method, is simple and remains unaffected by a few outliers. It applies to categorical and ordinal variables, and its calculations are straightforward [Karpouzos et al., 2010]. In this study, we first employed the Mann-Kendall mutation test to investigate whether there are mutations in extreme climate events across different time scales. A mutation refers to the phenomenon where a long-term series transitions from one relatively stable state to another. The Mann-Kendall mutation test, one of the most used methods for identifying mutations and analyzing change points, is simple. The specific calculation steps are as follows:
First, the time series is x1, x2... xn, Sk represents the cumulative variable of the I th sample xi > xj (1 ≤ i ≤ j), defining Sk:
Sk^.r, (k=l,2...n)(1)г* = {о.х^х^ = 1-2,... i;i = 1,2... n) (2)
Assuming that the time series is randomly independent, E(Sk) and Var(Sk) are the mean and variance of the cumulative variables. The calculation formula is as follows:
Var[Sk] = k(k - l)(2k + 5)/72 a < к < n
E[Sk] = k(k-l)/4
Standardize Sk:
UFk = Sk - E [sk/;Var[Sk]| (4)
Among these parameters, we define UF1 as equal to zero (UF1 = 0). For any specified significance level α, should |UFk| exceed Ua (i. e., |UFk| > Ua)? This indicates that a notable trend change exists within the time series data. By aggregating all values of UFk into a singular curve and applying this methodology to its inverse sequence yields what is referred to as the UBk curve. Assuming our chosen significance level is set at a = 0.05 results in U 0.05 being ±1,96 respectively. The value of UFk or UBk exceeding zero denotes an ascending trend within the time series; conversely, if either value falls below zero, it signifies a descending trend. When these values surpass their respective critical thresholds, indicating statistical significance, it reveals substantial evidence for either an upward or downward trajectory in trends observed over periods defined by such thresholds, marking potential instances of abrupt shifts. Furthermore, if intersections arise between curves representing UFk and UBk within bounds established by these critical lines, the corresponding timestamps at which such intersections occur signify initiation points for identified abrupt changes.
Pearson correlation analysis
To study the response of GPP to extreme climate events in Mongolia, the Pearson correlation coefficient method was used to analyze the correlation between GPP and extreme climate index. Its calculation formula is as follows:
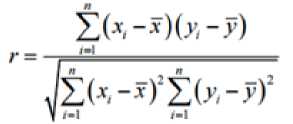
Where is the correlation coefficient, n is the logarithm of two sets of variables; x and y represent the values of GPP and each extreme climate index, respectively. x and y represent the meaning of the GPP and the extreme climate index, respectively. When r > 0, the extreme climate index positively correlates with GPP. When r < 0, the extreme climate index negatively correlates with GPP. When the absolute value of r is more significant, the correlation between the extreme climate index and GPP is stronger. The significance of r was tested at a = 0.05 and a = 0.01 levels.
Structural Equation Model
Structural Equation Modeling (SEM) was employed to examine the relationships between the variables in the study. SEM is a comprehensive statistical technique that analyzes complex relationships between observed and latent variables. It was used to model the direct and indirect effects of extreme climate indices (such as R95P, R20, SDII, SU, TNn, and TNx) on GPP. The model was constructed using the data from the study and was fit using the lavaan package in R.
SEM was chosen for its ability to evaluate both the measurement and structural relationships between variables simultaneously, providing a detailed understanding of the causal effects among the variables.
Results
Temporal Variation of Vegetation GPP
As shown in Fig. 1, Mongolia’s GPP exhibited an overall increasing trend from 2000 to 2023, with a growth rate of 1.40 g/(m²·a). The maximum value of vegetation GPP during the study period occurred in 2018, with a value of [insert value] g/(m²·a), while the minimum value was observed in 2007, with a value of [insert value] g/(m²·a).
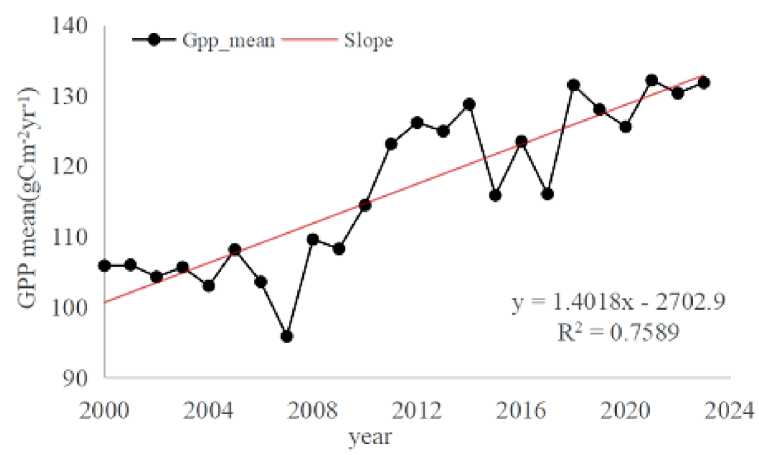
Fig. 1 . Interannual variation of GPP
Spatial Variation of Vegetation GPP
The spatial distribution of the mean annual GPP for Mongolia from 2000 to 2023 is shown in Fig. 2. The GPP is higher in the northern Sayhan Mountains and Khangai Mountains, and overall, there is an increasing trend from the southwest to the northeast.
The spatial distribution pattern of the GPP changes in Mongolia from 2000 to 2023, shown in Fig. 3, reveals significant variation. Most of the study areas exhibit an increasing trend in GPP. At the same time, some local regions show a decreasing trend, primarily in central Uvs Province, northern Khuvsgul Province, and northern Gobi-Altai Province. Areas with an increasing GPP trend account for 96.2 % of the total study area. Mongolia’s central and northeastern regions show significant GPP increases, covering 61 % of the study area. In contrast, regions with a decreasing trend account for 3.8 % of the total area. In proportion, the areas with a significant increase in GPP are the most prominent.
Time Variation Characteristics of Extreme Temperature Indices
The time variation trend of extreme temperature indices in Mongolia from 2000 to 2023, analyzed by year, and the MK test of the time trend (Fig. 4), with UF representing the trend statistic for the extreme temperature index time series and UB representing the reverse sequence statistic of the extreme temperature index, are shown in the figure.
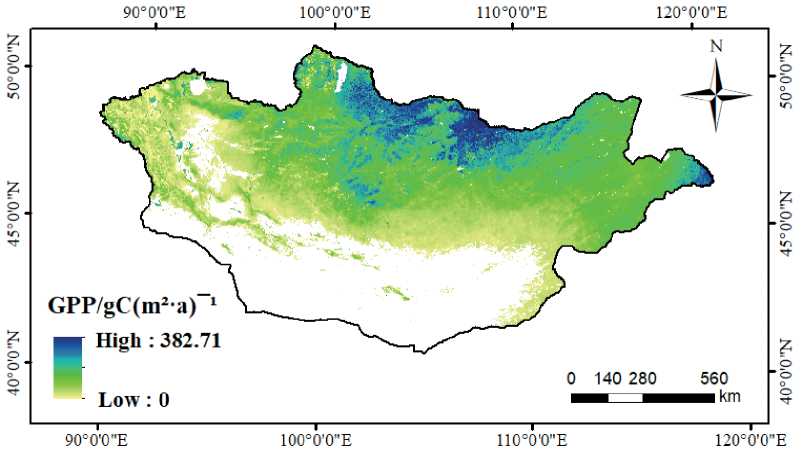
Fig. 2 . Spatial distribution of annual GPP in Mongolia (average from 2000 to 2023)
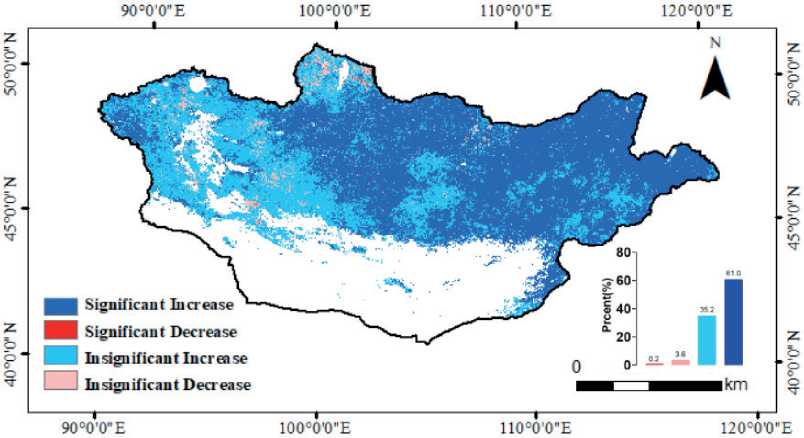
Fig. 3 . The significance of annual average GPP in Mongolia from 2000 to 2023
The figure shows that the frequency index representing temperature warming, SU25 (Fig. 4–a), exhibits a decreasing trend with a rate of 2.4 days/decade. The MK test shows that values before 2003 are more significant than 0, indicating an increasing trend for SU25. After 2003, values are all less than 0, indicating a decreasing trend. Additionally, SU25 shows several intersection points within the critical value range between 2003 and 2022. However, due to multiple extremely high-frequency intersections between 2007
and 2017, these cannot be considered abrupt change points. A more notable change is observed in 2003, indicating a significant shift in the SU25 trend, with a change in the trend before and after 2003.
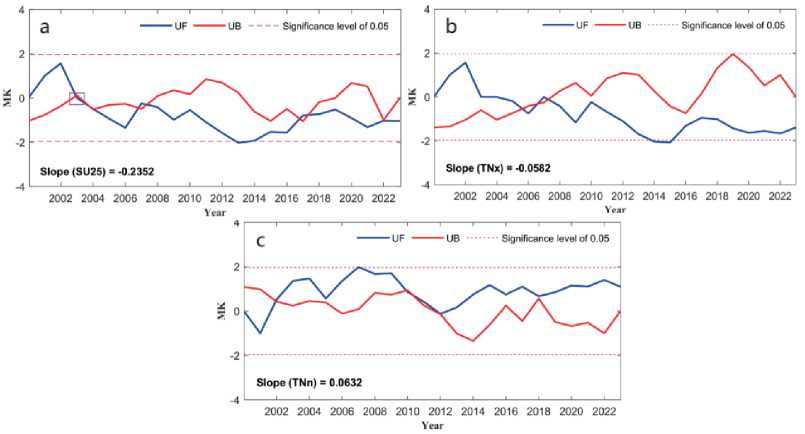
Fig. 4 . Interannual variation trend of extreme temperature index
The extreme temperature intensity index, TNx (Fig. 4–b), shows a decreasing trend, while TNn (Fig. 4–c) shows an increasing trend at a rate of 0.6 °C/decade. The MK test reveals that TNx values before 2003 are more significant than 0, indicating a growing trend, while values after 2003 are less than 0, indicating a decreasing trend. TNn values in 2000–2001 are less than 0, showing a decreasing trend, but after 2001, TNn values are more significant than 0, primarily exhibiting an increasing trend. Moreover, TNx has three intersection points between 2005 and 2007, within the critical value range, but there is no change in the trend before and after the abrupt change. TNn has several extremely high-frequency intersection points between 2010 and 2012, which are not considered change points. However, a more prominent change point is observed in 2002, indicating that TNn experienced a significant shift in 2002, with a change in the trend before and after 2002.
Spatial variation characteristics of extreme temperature index
The spatial distribution of the interannual variation trends of summer days (SU) in Mongolia (Figure 5-a) shows an increasing trend at 6.2% of the study stations and a decreasing trend at 36.8%. Among these, 7.9% and 5.3% of the stations passed the significance test. Overall, SU exhibits an increasing spatial trend.
From the spatial distribution of the interannual variation trends of the annual maximum of daily minimum temperature (TNx) over the past 24 years (Figure 5–b), TNx shows an increasing trend at 63.2 % of the study stations and a decreasing trend at 36.8 %. Of these, 10.5 % and 5.3 % of the stations passed the significance test. For the spatial distribution of the interannual variation trends of the annual minimum of daily minimum temperature (TNn) (Figure 5-c), TNn shows an increasing trend at 73.7% of the study stations and a decreasing trend at 26.3 %. Among these, 13.2% of the stations with an expanding trend passed the significance test, while none of the stations with a decreasing trend did. Overall, both TNn and TNx exhibit increasing trends spatially.
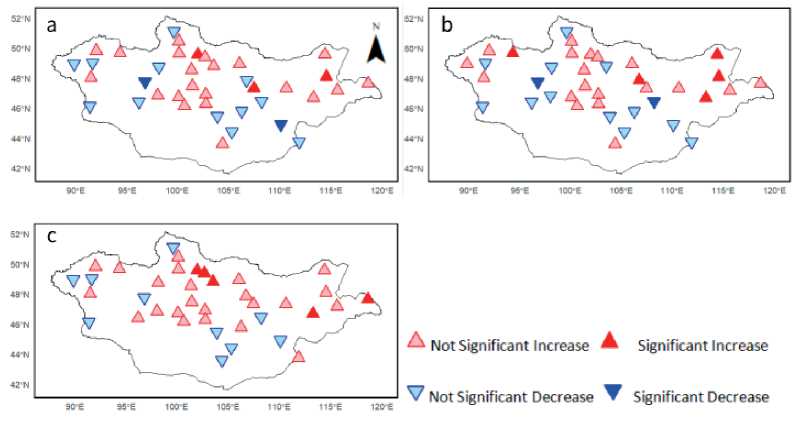
Fig. 5 . Spatial distribution of annual variations of extreme temperature index over Mongolia: a. SU25; b. TNx; c. TNn
Time Variation Characteristics of Extreme Precipitation Indices
Extreme precipitation indices are divided into frequency indices and intensity indices. R95P and SDII are intensity indices, while R20 is a frequency index. The variation in the extreme precipitation intensity indices R95P (Figure 6–a) and SDII (Figure 6–b) shows an increasing trend, with rates of 4,2 mm/decade and 0,04 mm/day/decade, respectively. From the MK test, it can be observed that R95P values before 2001 and between 2003 and 2023 are more significant than 0, indicating an increasing trend during these periods. However, between 2001 and 2003, the values are less than 0, showing a decreasing trend. R95P exceeds the significance level in 2013 and 2020, indicating a significant upward trend in 2013 and between 2020 and 2022. Additionally, R95P has three intersection points between 2002 and 2007 that lie within the critical value range, suggesting a change point, but the trend remains unchanged before and after this point. The variation trend of SDII is divided into five periods: the values from 2000 to 2001, 2003 to 2015, and after 2018 are all greater than 0, showing an increasing trend. However, from 2001 to 2003 and 2016 to 2018, SDII values are less than 0, indicating a decreasing trend. Furthermore, SDII shows two intersection points in 2002 and 2022, lying within the critical value range, indicating that SDII experienced a change point in these two years, with no change in trend before and after the change.
The extreme precipitation frequency index R20 (Figure 6–c) shows an increasing trend, with a 0.4 day/decade rate. The MK test reveals that values before 2005 are less than 0, indicating a decreasing trend, while values after 2005 are more significant than
0, indicating an increasing trend. R20 exceeded the significance level in 2010, showing a significant upward trend. Additionally, R20 has an intersection point in 2007 that lies within the critical value range, indicating a change point in 2007, with no change in trend before and after this point.
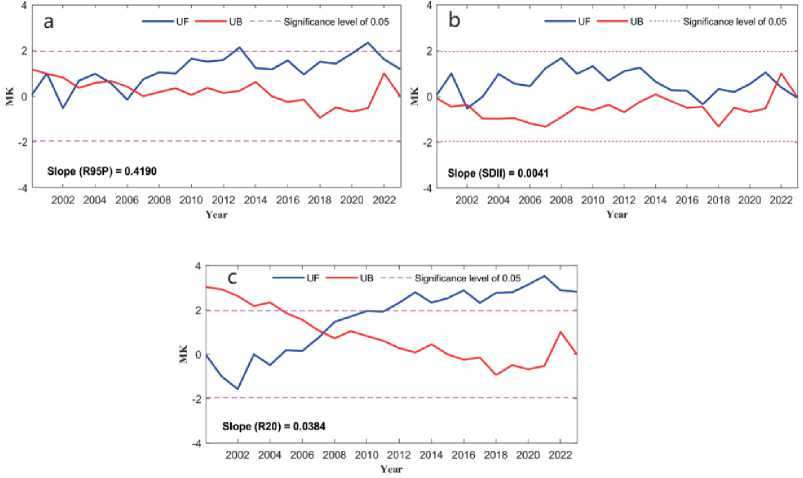
Fig. 6. Interannual variation trend of extreme precipitation index: a. R95P; b. SDII; c. R20
Spatial Variation Characteristics of Extreme Precipitation Index
Over the past 24 years, the spatial distribution of interannual variability in heavy precipitation (R95p) across Mongolia shows that 26.3 % of the stations exhibit an increasing trend, while 73.7 % show a decreasing trend (Figure 7–a). Among these, none of the stations with a growing trend passed the significance test, while 13.2 % of the stations with a decreasing trend did. The spatial distribution of interannual variability in the mean precipitation intensity (SDII) reveals that most stations (94.7 %) exhibit a decreasing trend, with 7.9 % of these stations passing the significance test (Figure 7–b). Overall, R95P and SDII show a decreasing trend spatially.
The number of heavy precipitation days (R20) exhibits an increasing trend at 78.9 % of the stations and a decreasing trend at 21.1 %, with 15.8 % and 0.0 % passing the significance test, respectively (Figure 7–c). Overall, R20 shows an increasing spatial trend.
Correlation Analysis Between GPP and Extreme Climate Indices
Using correlation analysis to study the impact of extreme climate on GPP, as shown in Figure 8, it can be observed that the index most strongly positively correlated with GPP is R20, with a correlation coefficient of 0.60. R95P and SDII show weaker positive correlations with GPP, with correlation coefficients of 0,21 and 0,07, respectively. SU, TNx, and TNn show negative correlations with GPP. Among them, the correlation coefficients of TNx and SU with GPP are –0.46 and –0.43, respectively, indicating moderate correlation. The correlation coefficient of TNn with GPP is – 0.10, indicating a weak correlation. Therefore, extreme precipitation indices positively correlate with GPP, which promotes GPP. In contrast, the extreme temperature index, precisely the extremely low value of the daily minimum temperature, shows no significant effect on GPP, while other indices have a suppressive effect.
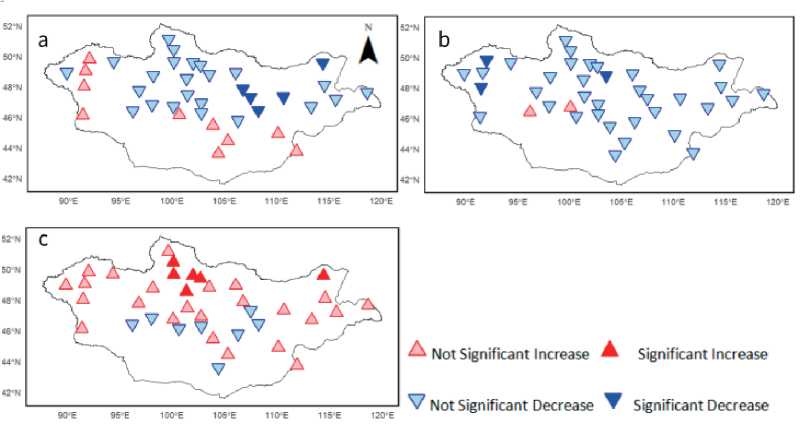
Fig. 7 . Spatial distribution of annual variations of extreme precipitation index over Mongolia: a. R95P; b. SDII; c. R20
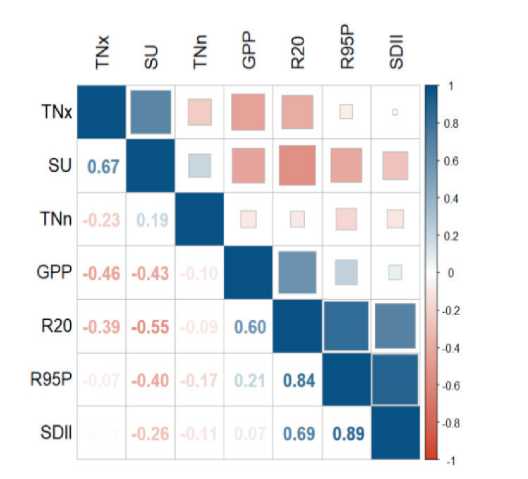
Fig. 8 . The interannual correlation coefficient between extreme climate indices and GPP
The spatial distribution of the correlation between GPP and extreme climate indices The figure shows the spatial distribution of the correlation coefficients between growing season GPP and extreme climate indices at the pixel scale in Mongolia.
For the extreme temperature index, the regions with a positive correlation between GPP and SU account for 5.1 %, with 3 % showing a highly significant positive correlation (p < 0.01), primarily located in the Khuvsgul Province, the Khangai Mountains, and the Altai Mountains. Conversely, regions with a negative correlation account for 49.7 %, with 32 % exhibiting a highly significant negative correlation (p < 0.01), mainly distributed in central and eastern Mongolia (Fig. 9–a). This correlation pattern suggests high-temperature events may suppress vegetation growth by increasing water evaporation or reducing photosynthetic efficiency. The negative impact is particularly evident in arid and semi-arid regions with scarce precipitation.
The spatial distribution of the correlation between TNx and GPP shows that positively correlated areas account for only 1.10 %, with highly significant positive correlations (p < 0.01) occupying just 0.02 %. Areas with negative correlations are more widespread, covering 28.40 %, with highly significant negative correlations (p < 0.01) accounting for 10.80 %, mainly concentrated in the Eastern, Sukhbaatar, and southern Khentii provinces (Fig. 9–b). The correlation between TNn and GPP indicates that positively correlated areas account for only 0.80 %, with significant positive correlations (p < 0.01) occupying 0.02 %. Negatively correlated areas cover 2.20 %, with highly significant negative correlations (p < 0.01) accounting for 0.04 %, primarily located in Zavkhan Province (Fig. 9–c). The remaining areas show no significant correlation, suggesting that extreme temperature indices, particularly TNx and TNn, have a limited impact on vegetation productivity in most parts of Mongolia. These patterns likely reflect the localized influence of temperature extremes, where high temperatures may suppress growth in arid regions, and moderate increases in low temperatures may reduce cold stress but only in specific areas.
For extreme precipitation indices, the spatial distribution of the significance of the correlation coefficients between R95P, SDII, and GPP shows similar patterns. The areas where R95P is positively correlated with GPP account for 24.70 %, with 9.70 % of these areas showing highly significant positive correlations (p < 0.01), primarily distributed in the Eastern Province, Sukhbaatar Province, Uvs Province, and central regions. Similarly, 19.80 % of the areas where SDII positively correlates with GPP, with 9.00 % showing highly significant positive correlations (p < 0.01), have distribution patterns like R95P.
The areas where R95P and SDII are negatively correlated with GPP account for 1.30 % and 1.00 %, respectively, with 0.60 % and 0.30 % of these areas showing highly significant negative correlations (p < 0.01), primarily concentrated in the Zavkhan Province (Fig. 9–d, e). Overall, both R95P and SDII show a high proportion of areas with significant positive correlations, indicating that increased precipitation intensity promotes vegetation growth to some extent. This is because moderate rainfall provides the necessary water for plant growth, especially in the relatively arid regions of central and eastern Mongolia, where additional precipitation contributes significantly to GPP growth. In these positively correlated areas, the proportion of highly significant positive correlations is high (9.70 % and 9.00 %), reflecting the significance of changes in precipitation intensity on vegetation growth.
In contrast, the proportion of negatively correlated areas is smaller (1.30 % and 1.00 %), but these areas with highly significant negative correlations are concentrated in Zavkhan Province. This may be due to the poor soil permeability in this area, where excessive precipitation leads to reduced soil oxygen or waterlogging, inhibiting root growth. Additionally, the increased precipitation intensity in this region may have harmed certain vegetation types, thereby reducing GPP.
The area where R20 positively correlates with GPP accounts for 43.40 %, with 24.4 % showing highly significant positive correlations (p < 0.01), primarily distributed in the eastern and central regions and around lakes. The area where R20 is negatively correlated with GPP accounts for 0.6 %, with less than 0.20 % of these areas showing highly significant negative correlations (p < 0.01). Although the areas around lakes already have abundant water sources, the increase in precipitation frequency may further enhance the local hydrological environment’s moisture level, providing additional water sources that support plant growth and photosynthesis, thereby promoting an increase in GPP. Precipitation events encourage vegetation growth and GPP.
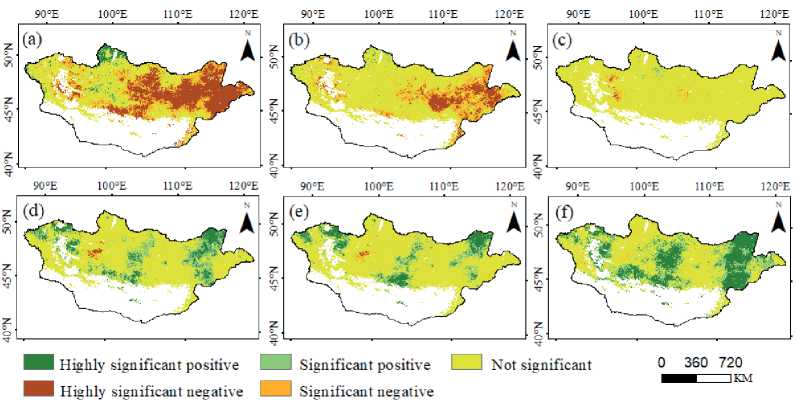
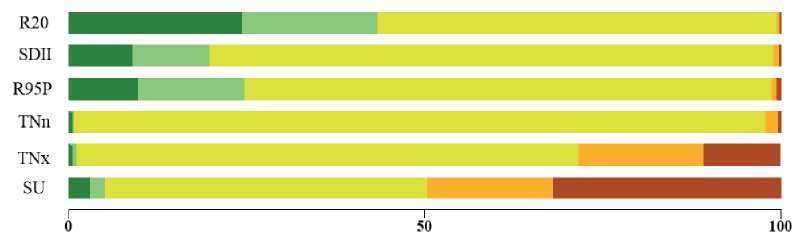
Fig. 9 . Spatial distribution of correlation between extreme climate indices and GPP: a. SU, b. TNx, c. TNn, d. R95P, e. SDII, f. R20
Structural Equation Modeling (SEM) Analysis of GPP and Extreme Climate Indices
Structural equation modeling (SEM) was used to quantitatively evaluate the driving mechanisms of extreme climatic events on vegetation productivity (GPP). The model fit analysis had strong explanatory power (χ² = 5.343, degrees of freedom = 2, P = 0.069) and effectively captured the key interactions between variables. The results showed that heavy precipitation (R95P) significantly and negatively affected GPP (throughput coefficient = –0.916, P = 0.021), suggesting that extremely heavy precipitation may inhibit vegetation productivity through soil saturation or oxygen limitation. The effect of the number of heavy rainy days (R20) on GPP was significantly positively correlated (throughput coefficient = 1.455, P < 0.001), suggesting that stable precipitation patterns have an essential role in promoting vegetation growth. The direct effects of mean annual rainy day precipitation intensity (SDII) and temperature-related indices (SU, TNn, TNx) on GPP were not statistically significant (P > 0.05), suggesting that these factors may influence vegetation productivity through indirect pathways.
Our comprehensive analysis has uncovered the intricate interaction mechanism between extreme climatic events. The significant increase in r95P has a profound impact on the number of heavy rainfall days (R20) (throughput coefficient = 0.997, P < 0.001), indicating that the frequency of extreme precipitation directly influences the number of precipitation days. However, the potential negative effect of a very high low temperature (TNx) on R20 is a factor that cannot be overlooked. This negative effect could accelerate evaporation or increase drought stress (path coefficient = –0.356, P = 0.003). Furthermore, TNx plays a significant role in the increase of summer days (SU) (pathway coefficient = 0.634, P < 0.001), underscoring the profound impact of high temperatures on seasonal climate patterns. Conversely, R95P negatively impacts SU (throughput coefficient = –0.623, P = 0.026), possibly due to the destabilization of the climate system by heavy precipitation events (Fig. 10).
Extreme climatic events regulate vegetation productivity dynamics through complex multidimensional mechanisms. R95P and R20 showed inhibitory and facilitatory effects on GPP, suggesting that total precipitation and distribution patterns are key drivers of vegetation productivity. TNx significantly affects heavy precipitation and summer days and may regulate GPP through indirect pathways. This study provides important theoretical insights into the complex impacts of extreme climate events on ecosystem functioning and provides essential guidance for predicting and mitigating ecosystem responses under climate change.
Conclusion
This study reveals the characteristics of spatiotemporal changes in GPP and its response to climate extremes in Mongolia through Sen Slope + Mann-Kendall trend analysis, MK mutation test, Pearson correlation analysis method, and structural equation modeling. The main conclusions are as follows:
Vegetation in Mongolia was in a good condition from 2000 to 2023, and the average annual GPP showed an increasing trend at a rate of 1.40 g C-m-2-a-1, with a significant increasing trend in GPP in 61 % of the area.
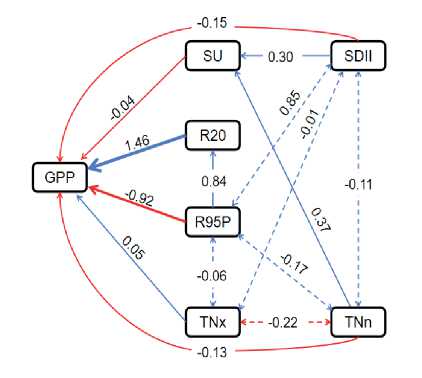
Fig. 10 . SEM fit of GPP to extreme climate indices
The extreme temperature indices (SU, TNx, TNn) showed an increasing trend at most stations in Mongolia. Their spatial distribution was relatively consistent, with highs in the center and northeast and lows in the southeast. The extreme precipitation indexes R95p and SDII showed a decreasing trend in spatial variation at most stations, while the R20 showed an increasing trend.
The TNn of the extreme temperature index had a weak effect on GPP in Mongolia, while the others had an inhibitory effect on vegetation growth. The extreme precipitation index, however, promoted the growth of vegetation, in which R20 had a significant positive correlation with GPP in 43.40 % of the regions, which was the main factor influencing vegetation growth.
The SEM-based study of the relationship between GPP and extreme climate indices found that R20 significantly and positively affects GPP (P < 0.001). TNx not only significantly affects R20 and SU, but also moderates GPP through indirect pathways.
