Тенденция изменения выбросов CO2 в государственном энергетическом секторе в ЕС
Автор: Ниемерка Эльжбета, Ядвищак Петр, Саег Мардирос Ара
Журнал: Advanced Engineering Research (Rostov-on-Don) @vestnik-donstu
Рубрика: Безопасность деятельности человека
Статья в выпуске: 4 (91) т.17, 2017 года.
Бесплатный доступ
Короткий адрес: https://sciup.org/142211884
IDR: 142211884 | УДК: 621.893 | DOI: 10.23947/1992-5980-2017-17-4-122-128
Текст статьи Тенденция изменения выбросов CO2 в государственном энергетическом секторе в ЕС
Образец для цитирования : E. Niemierka, P. Jadwiszczak, M.
-
A. Sayegh. CO 2 emission trend in public energy sector in EU. Vestnik of DSTU, 2017, vol. 17, no.4, pp. 122 - 128.
Introduction. The mitigation of climate change requires reduction or inhibition of greenhouse gases (GHG) emission. Different types of contaminants caused incomparable impact on anthropogenic global warming [2-3]. One of the significant major of European Union (EU) climate policy framework is decreasing CO 2 emission from fuel combustion in public
∗ The research is done within the frame of the independent R&D.
∗∗∗ Работа выполнена в рамках инициативной НИР.
electricity and heat production (PEAHP) sector. PEAHP contains the sum of three emission categories from: electricity plants, combined heat and power plants and heat only plants [4]. The impact of other pollutants than CO 2 from PEAHP is vanishingly small. EU legislation sets mandatory CO 2 emission reduction targets in all EU Member States (MS) [4-7]. PEAHP based on fuel combustion is responsible for a significant part of the annual CO 2 emissions in the EU, which is slightly decreased to around 220 000 kt CO 2 , thus it providing nearly 30% of European emissions as it shown in Figure 1 [1]. The CO 2 emission from fuel combustion in PEAHP depends on the both of the consumed conventional energy (constant and amounted about 15 700 PJ) [1] and the CO 2 emission factor (EF), characterized by the technology of generation. In Europe, enlargement of required electricity and heat is caused by growing demand, which are met by alternative or renewable energy sources with a constant PEAHP energy from fossil fuel combustion.

Fig. 1. CO 2 emission changes over the period 1990 to 2011 in EU.
Рис. 1. Изменения выбросов CO 2 в период с 1990 по 2011 гг. в ЕС.
The EU climate framework actions concerned in decreasing the electricity and heat consumption (by essential energy improvements on consumers side e.g. in buildings, energy systems, etc.) and decreasing CO 2 emission factor (EF) per energy unit (e.g. by fuel switching, improvements in generation technology and distribution efficiency, use of cogeneration, renewable sources etc.). There are many other indicators, which will be discussed and analysed in future papers. The PEAHP as a one of the well-controllably and highly-centralized economic sector allows to national and regional scale large improvements. All changes in PEAHP concerned with large efforts and time-consuming processes.
The CO 2 emission trends in European PEAHP. To determine the CO 2 emission trends, European Environment Agency long-term sectoral database was used [1]. The database includes energy consumption and emission statistics over the period from 1990 to 2011 for 26 EU countries. This investigation illustrates the distribution changes overview and the trends of CO 2 emissions in PEAHP for EU over the period from 1990 to 2011. Figure 2 shows statistical analyses of inter-annual variations of CO 2 emissions range in EU countries over the period 1990 to 2011.

Years
Fig. 2. CO 2 emissions range in EU countries from 1990 to 2011.
Рис. 2. Диапазон выбросов CO 2 в странах ЕС с 1990 по 2011 гг.
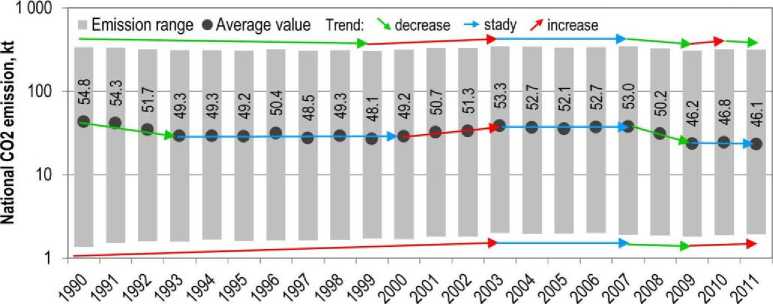
The maximum national emissions come from German PEAHP and they are semi stable (over 300 kt CO 2 /a) [1]. The variability of maximum could be divided into four periods: stable decrease until 1999, the unfavourable growth over the period 1999 to 2003, the stable steady emission between 2003 to 2007 and slow decrease with fluctuations after 2007. The analysis of obtained results are related to energy consumption and the impurities of PEAHP intensity. The minimum national emissions came from the smaller EU countries like MLT, LVA or CYP with emissions less than 2 kt CO 2 /a [1]. The variability of minimum emissions could be divided into four periods: the unfavourable growth until 2003, the slight fluctuations between 2003 to 2007, the steady and stable decrease between 2007 to 2009, small and short-term growth after 2011. These trends are related to the development in countries economy and the increase in energy consumption compared to 1990 .
Безопасность деятельности человека
The average national emissions describe the total variability of emissions in all EU countries and illustrates the two-decades trend (from 1990 to 2011) as fluctuating with downward tendency. The six noticeable periods are: significant decline before 1993, stabilization from 1993 to 2000, considerable increase from 2000 to 2003, slightly fluctuating stabilization from 2003 to 2007, dynamic decline from 2007 to 2009 and stabilization until 2011. The CO 2 emission tendency is a complex issue that has been affected by legislation, economy, ecology and technical development. In this reason stabilization of the emission averages can be caused by different reasons, which can be divided into: 1) increase the minima with decreases maxima (1993-1999), 2) stabilization of both minima and maxima (2003-2007) and 3) opposing variation of minima and maxima (2009-2011). The emission variations reflect the political changes of the 90s, the European economic crisis and energy legislations. The stabilized diminishing of EU emissions average is an evident result of EU climate change mitigation actions accompanied by both of economic and ecological development in Europe.
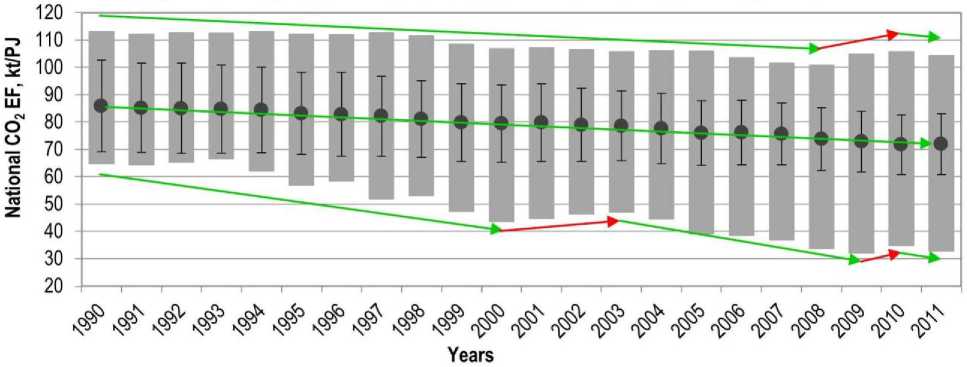
To clarify a situation of PEAHP emission distribution in EU countries the national CO 2 emission factors (EF) were assumed, as a relation indicator between the consumed energy and emitted CO 2 during all cycles of electricity and heat production and distribution. The low values of EF are concerned with clean and environmentally friendly technologies, while high EF are accompanied by old and inefficient technologies of PEAHP. The decreasing trend of EF in Figure 3 shows the technology and fuels improvements in European PEAHP over the period from 1990 to 2011.
Figure 3 shows the favourable downward trend of EF during two-decades in European countries, with the episode of growth since 2008. The trend of minimum EF shows the more significant decline with SWE as the European leader in national EF limitation. The average of EF in EU constantly falls down, it`s around 0,78% per year, which reflects the constant PEAHP development in Europe and right direction of EU`s climate protection framework actions. The decrease of EF standard deviation reflects that all national values tend to bring closer to the diminishing average value of EU national CO 2 emission.
-
■ EF range • EFaverage value I Standard deviation Trend: ^decrease -► stady >* increase

Fig. 3. Changes and trends of national EF in EU countries from 1990 to 2011.
Рис. 3. Изменения и тенденции EF (коэффициент выбросов) в странах ЕС с 1990 по 2011 гг.
CO 2 emission changes from PEAHP in MS of EU. CO 2 emission in EU consists of the sum of all MS national emissions of EU. To estimate the share of CO 2 emission for each EU country, the distribution value of CO 2 emissions from 1990 to 2011 was analysed as it shown in Figure 4A. The distribution of CO 2 emissions at the national level was very high and achieve from 1.9 (MLT) to 314.1 (DEU) kt CO 2 in 2011 [1]. The top CO 2 emitter countries were DEU, POL, GBE and ITA which emits more than 60% of EU emission and haven’t changed their place in the emission classification from 1990. These are large population and area countries with large energy consumption. Table 1 shows the statistic CO 2 emission changes for EU countries from PEAHP between 1990 to 2011. The most favourable change from 12.0 to 2.9 kt CO 2 (76.0%) was observed for LTU, while the most unfavourable change from 1.7 to 3.7 kt CO 2 (-121.6%) was observed for CYP. The CO 2 emission from PEAHP strongly depends on energy consumption, but the changes of both values have not always been analogous. Figure 4B shows the distributions PEAHP energy consumption in EU countries, as a comparison of 1990 and 2011. With reference to the data shown in the Table 1, the most favourable change from 185.6 to 61.1 PJ (67.1%) was observed for LTU, while the most unfavourable change from 101.7 to 236.7 PJ (132.7%) was for SWE. The countries characterized by high CO 2 emission from PEAHP were the countries with energy-intensive economies like (DEU, GBE, POL, etc.). To compare the emissions in EU countries, national emission factor (EF) was assumed, as a relation between the national energy consumption and the national CO 2 emission from PEAHP (Figure 4C).

a )

b )

c )
Fig. 4. a ) CO 2 emission distribution in each EU SM from 1990 to 2011 (CO 2 kt); b ) Distribution of public electricity and heat consumption in EU countries from 1990 to 2011 (PJ); c ) EF distribution in each EU country from 1990 to 2011 (kt CO 2 /PJ).
Рис. 4. a) Распределение выбросов CO 2 в каждой стране ЕС с 1990 по 2011 гг. (CO 2 кт); b) Распределение общего потребления электроэнергии и тепла в странах ЕС с 1990 по 2011 гг. (ПДж); c) Распределение факторов выбросов в каждой стране ЕС с 1990 по 2011 гг. (CO 2 кт / ПДж).
The analysis of national EF value in EU each country includes three rating categories of EF values distribution in 1990, in 2011 and the changes of EF values during from 1990 to 2011 as shown in Figure 4C. The EF values in particular EU countries are extremely different both in 1990 and 2011. In basic 1990 year the EF value varies from 64.7 in LTU to 112.9 kt CO 2 /PJ in GRC. In 2011 year the minima value achieved was 32.8 in SWE and maxima 104.2 kt CO 2 /PJ in GRC.
Table 1
Таблица 1
National statistical relative changes of PEAHP emission and energy consumption from 1990 to 2011 in EU countries Национальные статистические относительные изменения выбросов PEAHP и потребления энергии с 1990 по 2011 гг. в странах ЕС.
|
Country |
Energy consumption |
CO 2 emission |
CO 2 EF |
|
AUT |
52.8% |
-3.6% |
-37.0% |
|
BEL |
14.3% |
-26.1% |
-35.3% |
|
BGR |
-15.0% |
-5.7% |
10.9% |
|
Country |
Energy consumption |
CO 2 emission |
CO 2 EF |
|
CYP |
119.0% |
121.6% |
1.2% |
|
CZE |
3.8% |
-1.4% |
-5.0% |
|
DEU |
12.6% |
-7.3% |
-17.7% |
Безопасность деятельности человека
|
Country |
Energy consumption |
CO 2 emission |
CO 2 EF |
|
DNM |
-1.5% |
-29.7% |
-28.6% |
|
ESP |
38.2% |
12.3% |
-18.7% |
|
EST |
-46.4% |
-49.7% |
-6.3% |
|
FIN |
79.4% |
29.2% |
-28.0% |
|
FRK |
4.9% |
-19.3% |
-23.1% |
|
GBE |
-6.8% |
-29.1% |
-23.9% |
|
GRC |
34.8% |
24.3% |
-7.7% |
|
HUN |
-18.5% |
-30.7% |
-15.0% |
|
IRL |
25.8% |
5.0% |
-16.6% |
|
ITA |
-0.8% |
-14.7% |
-14.0% |
|
Country |
Energy consumption |
CO 2 emission |
CO 2 EF |
|
LTU |
-67.1% |
-76.0% |
-27.2% |
|
LVA |
-55.7% |
-66.8% |
-25.1% |
|
MLT |
54.6% |
41.3% |
-8.6% |
|
NLD |
45.7% |
26.5% |
-13.2% |
|
POL |
-23.8% |
-27.5% |
-4.9% |
|
PRT |
19.8% |
-0.4% |
-16.9% |
|
ROU |
-54.1% |
-51.5% |
5.8% |
|
SVK |
-48.9% |
-57.0% |
-15.9% |
|
SVN |
11.8% |
3.9% |
-7.0% |
|
SWE |
132.7% |
0.5% |
-56.8% |
The most significant national EF changes were characterised by 10.9% increase in BGR (from 88.7 to 97.2 kt CO 2 /PJ) and by 56.8% decrease in SWE (from 75.9 to 32.8 kt CO 2 /PJ). Table 1 shows the detailed changes of EF in each EU country. Such variations are due to different levels of national PEAHP technology, EF baseline and country economic potential.
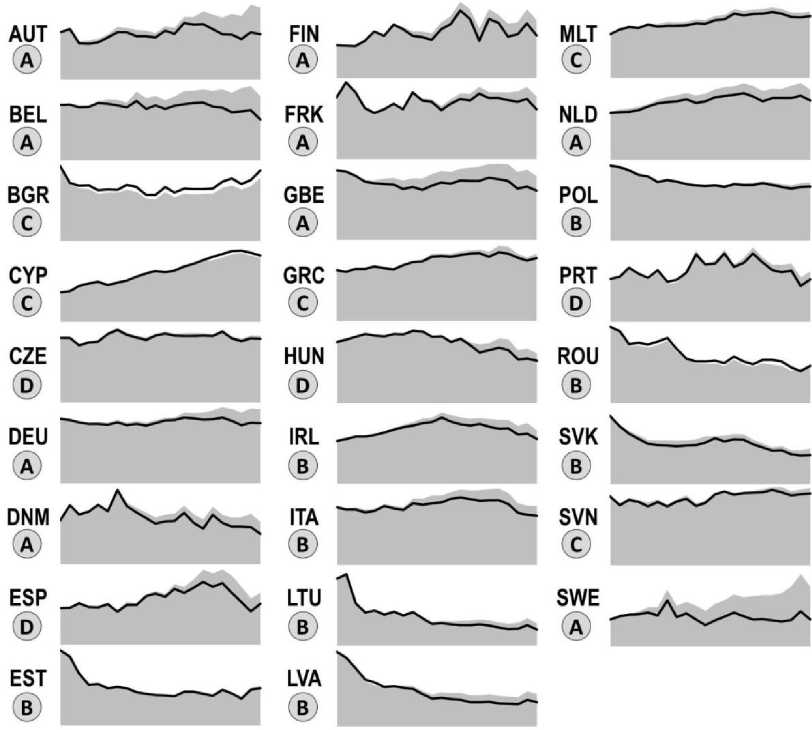
Changes of CO 2 emission profiles from PEAHP in each EU country. The national CO 2 emissions are dynamic values, which depend on time, political, economic, technology progress and national legislation. On the base of European Environment Agency data [1] 26 illustrative profiles of CO 2 emission and energy consumption from EU each national PEAHP were provided as shown in Figure 5. The line in each profile represents CO 2 emission and the grey area expresses the energy consumption from 1990 to 2011. All presented national profiles start at theoretical point which join the emission and energy consumption and illustrate the base proportions in 1990.

Fig. 5. Illustrative profiles of CO 2 emissions and energy consumption from PEAHP in the period from 1990 to 2011.
Рис. 5. Иллюстративные профили выбросов CO 2 и потребления энергии от PEAHP в период с 1990 по 2011 гг .
The presented results indicate the strong dependency of national CO 2 emission and PEAHP energy consumption, which can be classified into four groups as it shown in Table 2. The group A includes the countries where the CO 2 emissions decrease with increasing energy consumption. In group B the emissions and energy consumptions are decreasing simultaneously. Group C is characterized by increased emissions and energy consumption simultaneously. Group D includes MS of EU with stable emissions and energy consumption or with CO 2 reduction due to improvements in the recent years.
Table 2
Таблица 2 Grouping EU countries due to PEAHP emissions and energy consumptions
Группировка стран ЕС из-за выбросов PEAHP и потребления энергии
|
Group |
CO 2 emission |
Energy consumption |
EU Countries |
|
A |
decrease |
increase |
AUT, BEL, DEU, DNM, FIN, FRK, GBE, NLD, SWE |
|
B |
decrease |
decrease |
EST, ITA, IRL, LTU, LVA, POL, ROU, SVK |
|
C |
increase |
increase |
BGR, CYP, GRC, MLT, SVN |
|
D |
stable or improvement |
stable: CZE or improvements in recent years: ESP, HUN, PRT |
|
The groups A and B present the positive trends in national PEAHP and economy. According to EU climate legislation the CO 2 reduce actions do not hamper the national economic growth without energy prices increasing [4,7].Classified as category C countries consume increasing value of energy from fuel combustion with slightly improvements in PEAHP. At the current stage in these countries the economic development seems to be the major target than environmental issue.
The analysis show positive tendency in European PEAHP. CO 2 emissions from public energy sector are successively reduced by improvements in energy production technologies and reduce of fuel combustion.
Conclusions. The assessment and classification of environmental impact of public electricity and heat production sector in EU is a complex issue. The PEAHP from conventional fuel combustion is still responsible for a significant portion of annual CO 2 emission in EU. Since 1990 the EU climate legislations and framework actions let to decrease CO 2 emissions from fuel combustion in PEAHP, with slightly rising in overall energy consumption in Europe. This has been achieved in two main ways: first by reduction of energy consumption, second by improvement in PEAHP technologies. The EU climate policy takes into account the countries potential and sets adequate ecological goals and environmental targets. On the one hand, this leads to changes in pace and size of CO 2 emissions in EU individual countries and on the other hand it accelerates the progress of environmental friendly actions in Europe. Environment legislations are the cornerstone of the EU's strategy to improve the climate and energy economy.
The ”top four” countries with the largest national CO 2 emissions from PEAHP haven’t changed from 1990 to 2011. There are also significant relative emission changes e.g. CYP, where the CO 2 emissions increased over twice in the same period, while LTU decreased CO 2 emission over three times for the same period.
The average CO 2 emission in Europe has a downward trend. In all EU countries the national CO 2 emissions have changed: sometimes it has fallen and in others has even risen.
The availability of data and multi-range dependencies shape the image of CO 2 emissions from European and national PEAHP. Regular monitoring of European national and regional emission changes allows the evaluation and correction of the CO 2 reduction scenarios and actions to achieve near zero-carbon PEAHP.
Безопасность деятельности человека
Список литературы Тенденция изменения выбросов CO2 в государственном энергетическом секторе в ЕС
- European Environment Agency, National emissions reported to the UNFCCC and to the EU Greenhouse Gas Monitoring Mechanism, 2013.
- Ogden J., Anderson L., Sustainable Transportation Energy Pathways: A Research Summary for Decision Makers. Part 2, Institute of Transportation Studies, University of California, Davis (ITS), 2011, pp. 133-169.
- Intergovernmental Panel on Climate Change, Climate Change 2014. Synthesis Report, 2014.
- Regulation (EU) No. 525/2013 of the European Parliament and of the Council on a mechanism for monitoring and reporting greenhouse gas emissions and for reporting other information at national and Union level relevant to climate change and repealing Decision, No. 280/2004/EC.
- European Commission, Climate strategies & targets. Available at: https://ec.europa.eu/clima/policies/strategies_en (accessed: 12.09.2017)
- European Environment Agency, Greenhouse gas emission trends, 2017. Available at: https://www.eea.europa.eu (accessed: 12.09.2017)
- W. J. Antholis. The Good, the Bad, and the Ugly: EU-U.S. Cooperation on Climate Change, 2009. Available at: www.brookings.edu (accessed: 12.09.2017)


