Territorial planning and Zipf's law

Author: Kabanov Vadim N.
Journal: Economic and Social Changes: Facts, Trends, Forecast @volnc-esc-en
Section: Administration in territorial systems
Article in issue: 2 (62) т.12, 2019.
Free access
Territorial planning is an integral part of strategic planning in accordance with the current legislation of the Russian Federation. When development strategies are elaborated, the assessment of the socio-economic situation in the region should be based on the results obtained in the course of studying the current situation in a constituent entity of the Russian Federation in comparison with its border territorial entities, as well as in comparison with indicators in the macroregion (federal district). SWOT analysis is the most common technology for assessing the situation in a region. Due to various reasons the use of this method does not provide high accuracy of the result. The use of the Zipf distribution (inversely proportional dependence) as a reference provides an opportunity for a more accurate quantitative analysis of the dynamics of indicators used to assess the socio-economic situation in territorial entities. The goal of the paper is to determine current external conditions, trends and imbalances in the socio-economic situation in a region with the use of Zipf's law. In contrast to the traditional use of the law in the study of demographic indicators, our paper aims to consider the dynamics of changes in gross regional product and in the number of jobs. The results indicate that the distribution of the value added and the distribution of number of jobs tend to an inversely proportional function. The discussion of the results is presented in the form of a discussion on the impact of socio-economic situation on the formation of long-term development plans; the discussion takes into account the positions of constituent entities of the Russian Federation on the Zipf curve. In addition, we substantiate the possibility and necessity of using the gross regional product indicator in the conditions of the Russian Federation. Our conclusions show the advantage of using distributions to study the existing external environment in a constituent entity of the Russian Federation. Practical application of Zipf's law helps define the starting conditions and forecast the consequences of implementation of socio-economic development strategies more accurately and to substantiate quantitative indicators for long-term plans.
Zipf's law, gross regional product, gross value added, number of jobs, population, strategic planning, territorial planning
Short address: https://sciup.org/147224157
IDR: 147224157 | UDC: 332.1; | DOI: 10.15838/esc.2019.2.62.6
Text of the scientific article Territorial planning and Zipf's law
With the adoption of the RF Law “On strategic planning in the Russian Federation”, the forecast (Articles 33 and 34, Law 172-FZ), as well as the scheme of territorial planning (Article 38, Law 172-FZ) are elaborated in the strategic planning documents in addition to the strategy for socio-economic development of the constituent entity of the Russian Federation (Article 32, Law 172-FZ). In accordance with Law 172-FZ, the scheme of territorial planning should reflect the main provisions of the strategy for socio-economic development of the constituent entity of the Russian Federation, the macroregion and the country as a whole. It should be noted that the sequence of development of strategic planning documents does not strictly regulate the order in which the documents should be developed. In this regard, there may be situations in which the development of territorial planning schemes may be ahead of the formation of the socio-economic development strategy.
It is important to emphasize that the development of documents for long-term planning of socio-economic development of territorial entities should meet the objectives (Article 8, Law 172-FZ) and should not contradict the principles (Article 7, Law 172-FZ). Therefore, the strategy and the scheme of territorial planning should be based on the findings of the study of the existing “internal and external conditions, trends, constraints, imbalances and opportunities”1 and “provide an opportunity to assess the achievement of socio-economic development goals using quantitative and (or) qualitative targets, criteria and methods for their evaluation used in the strategic planning process”2. Based on these requirements, in order to quantify imbalances and disproportions it is expedient to use the features that describe the employment of economically active population and the efficiency of jobs functioning in the economy of the territorial entity.
It is not difficult to predict the goal of socioeconomic development of the constituent entity of the Russian Federation, which is formulated, in most cases, as improving the quality of life taking into account the interests of economic agents [1]. It is necessary to pay attention to the expected degree of participation of the federal government in the implementation of regional strategies, the priority of which “should not consist in addressing the issues of equalizing the socio-economic indicators of the regions, but in implementing specific infrastructure projects aimed at improving the transport and economic connectivity of territories, interregional integration and territorial mobility of the population, as well as increasing the availability of social infrastructure services” [2].
In order to measure the extent to which the goal of long-term socio-economic development has been achieved it is necessary to determine quantitative indicators. Most often, they include gross domestic product, the number of jobs, and population size; these indicators are widely used in forecasting [3] and strategic planning [4]. Indeed, the dependence of the number of residents on the number of jobs in the settlement or constituent entity does not require proof. It is clear that value added is created in the workplace and therefore depends on the number of jobs and the industry they operate in. In addition, the amount of value added is significantly affected by the efficiency of jobs.
Territorial planning regulated by Chapter 3 of the Town Planning Code of the Russian Federation3 requires that objects of federal and regional significance along with the transport and social infrastructure be depicted on the maps of the territory of RF constituent entities. The capacity of the objects of regional transport and social infrastructure that are planned to be constructed in the long term is calculated according to the rules established by the Regulations4 42.13330.2011. If we consider its provisions, we will find it easy to formulate a conclusion about the dependence of the capacity of transport and social infrastructure facilities on the number of inhabitants in the settlements. According to the logic of our work, the number of inhabitants depends on the number of jobs, and the change in the number of jobs is not difficult to estimate by the amount of value added produced by the economy of the settlement.
The development of strategic planning documents (socio-economic development strategy and territorial development scheme) is preceded by the study of “internal and external conditions, trends, constraints, imbalances, disproportions and opportunities”. In this regard, we consider it important to study the changes in the quantitative indicators of gross regional product, number of jobs and population size. The relevance of the research topic under consideration is confirmed by the norms of the current legislation of the Russian Federation (Paragraph 11, Article 7; Paragraph 2, Article 8, Law 172-FZ) that determine the study of the initial socio-economic situation in constituent entities of the Russian Federation for the goals of long-term socio-economic planning and forecasting. It is necessary to point out once again that the territorial planning scheme is an integral part of strategic planning documents. The location of socio-economic and transport infrastructure of regional and federal importance depends on the forecasted settlement system.
The goal of our research is to determine the current external conditions, trends, imbalances and disproportions in the socio-economic situation of the Volgograd Oblast.
To achieve the goal we address the following tasks:
-
1. We study the dynamics of changes in gross regional product, the number of jobs and population size in the same units of measurement.
-
2. We test Zipf’s law for the quantitative indicators of a macro-region that assess the external environment of the Volgograd Oblast.
Research methods
Different measurement units are used to measure gross regional product, the number of jobs and population size. Bringing the indicators to a common scale of measurement is possible with the use of relative indicators. From our point of view, the most interesting is the relative indicator characterizing the importance of a constituent entity of Russia for the country as a whole. In this regard, statistical values describing the total value for the Russian Federation were used as a basis for obtaining relative indicators. Thus, the study brought together the results for each quantitative indicator under consideration. The relative index was calculated according to the formula:
d Si =
DSi i=n ’
X DSi i=1
where dSi is the share of value added produced by the i-th constituent entity of the Russian Federation in the corresponding year;
DSi – value added (GRP), produced by the i-th constituent entity of the Russian Federation in the corresponding year, in monetary units (rubles);
i = n
X D si — the amount of added value i = 1
(GRP) produced by all “n” constituent entities of the Russian Federation (GDP), expressed in monetary units (rubles).
Zipf’s law (rank – size) in research methods did not appear accidentally. The law is widely used not only in linguistics and economic geography, but also in assessing the socioeconomic situation of a territory [5], the attractiveness of settlements [6], spatial and economic research [7] and traditionally – to assess income inequality [8]. At the same time, some researchers fully confirm the effect of Zipf’s law [9], while others establish restrictions on its action [10]. If we lay aside the discussions with mathematicians concerning the rank – size function (inversely proportional function), and consider only the results of the study provided further, then there is no obstacle to comparing the quantitative indicators with the graph of the inversely proportional function (y = 1/x, where x is the serial number of the territory, and y shows how many times the indicator for the region under the corresponding number is lower than the maximum value in the sample).
For the purposes of our study, with regard to the territory of the Volgograd Oblast, a non-traditional macroregion was formed; it consists of the subjects that are part of Russia’s Southern Federal District, and in addition includes the Saratov and Voronezh oblasts, the regions that have a common border with the region under consideration. From our point of view, this configuration provides the most objective analysis of external conditions that influence the socio-economic situation in the Volgograd Oblast.
Traditionally, the analysis of external conditions is carried out in relation to border territorial formations (subjects of the federation), with a graphical image of the results of such analysis with respect to the maximum value of indicators defined for the subject included in the macroregion. Based on such a comparison, a matrix of strengths and weaknesses is formed as part of the SWOT analysis.
Research results
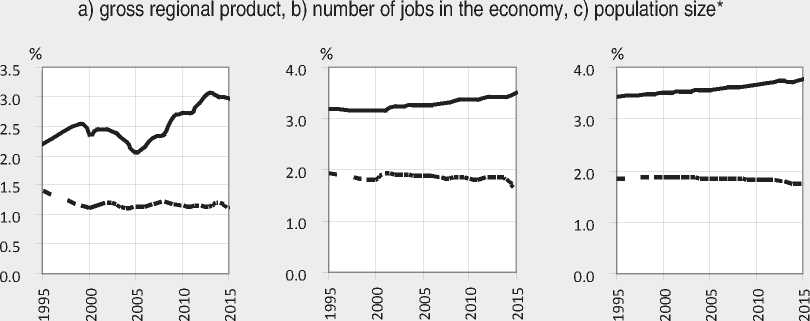
When assessing the current socio-economic situation, the dynamics of changes in quantitative indicators in most cases are presented in the form of graphs, for example, in comparison with the leading region of a macroregion. With regard to the Volgograd Oblast, this comparison is made with the corresponding characteristics of Krasnodar Krai (Fig. 1) . Statistical observations for 1995–2015 were used as initial data for the following indicators:
Figure 1. Traditional definition of the socio-economic situation in the constituent entity of the Russian Federation relative to the leader of the macroregion:
^“^“ Krasnodar Krai
™ “ ' Volgograd Oblast
^“^“ Krasnodar Krai
™ “ ' Volgograd Oblast
Krasnodar Krai
- “ ' Volgograd Oblast
a)
b)
c)
* Built according to the data from Table 1.
Table 1. Change in the share of regions in the value of the RF indicator, %
|
Region |
1995 |
2000 |
2005 |
2010 |
2015 |
|
Share of GRP in GDP, % |
|||||
|
Krasnodar Krai |
2.20 |
2.36 |
2.07 |
2.73 |
3.00 |
|
Volgograd Oblast |
1.39 |
1.12 |
1.13 |
1.15 |
1.13 |
|
Share of jobs, in % |
|||||
|
Krasnodar Krai |
3.19 |
3.16 |
3.28 |
3.37 |
3.52 |
|
Volgograd Oblast |
1.92 |
1.79 |
1.88 |
1.82 |
1.62 |
|
Share of population, in % |
|||||
|
Krasnodar Krai |
3.42 |
3.51 |
3.57 |
3.66 |
3.76 |
|
Volgograd Oblast |
1.85 |
1.86 |
1.85 |
1.82 |
1.74 |
|
Source: Russian Statistical Yearbook. 2017: Statistics Collection . Rosstat. Moscow, 2017. 686 p. |
|||||
-
– gross regional product5 (gross value added) as a share in the GDP of the Russian Federation, in %;
-
– the number of jobs6 as a share in the employed population of the Russian Federation, in %;
-
– population size7 as a share in the population of the Russian Federation, in %.
The graphs are based on the statistical information given relative to the values of the Russian Federation; that is, the graphs show the share of the region in the value corresponding to the Russian Federation (Tab. 1) . On the basis of graphical analysis we can draw a conclusion about the multidirectional changes in the characteristics under consideration. It should be noted that the changes in value added (gross regional product, GRP, Fig. 1a ) are subject to the greatest changes in comparison with the population size (Fig. 1c) and the number of jobs
(Fig. 1b) . The slower changes in the population of the Volgograd Oblast are explained by the changes in the structure of the sex and age composition in the direction of increasing the average age. The lower dynamics of the changes in the number of jobs compared to GRP is explained by a sufficiently high proportion of jobs created and maintained in the social sphere (at the expense of budgets of all levels).
We did not consider strengths and weaknesses in the framework of the present study, because from our point of view, the results of the SWOT analysis, as a rule, suffer from the subjectivity of assessments and can be used as a supplement when comparing the quantitative values of indicators used to describe the socioeconomic situation and development.
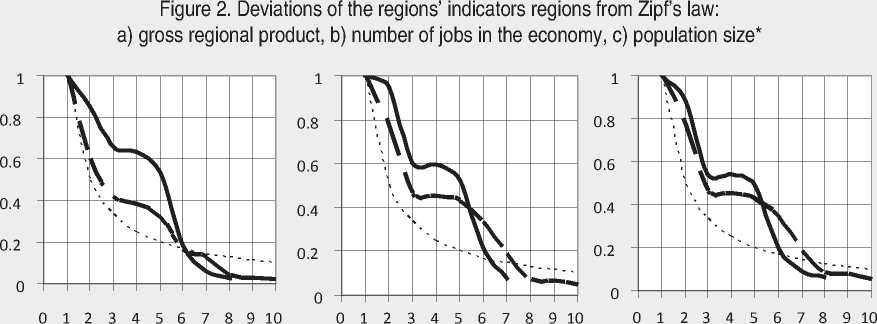
The result of the analysis of graphs (see Fig. 1) is usually represented by conclusions about the multidirectional development of the leader and the region under consideration. “Chasing the leader” is the strategy that is most often proposed in order to overcome this situation. Without denying the evidence of such conclusions, it is necessary to pay attention to the graphs that represent the distribution of the values of quantitative indicators arranged in ascending order relative to the indicators of the region that occupies a leading position in the macroregion. The comparison of the graphs that represent the values from the maximum to the minimum value with the inversely proportional function (Zipf curve) can lead to the formation of completely unexpected socio-economic development strategies (Fig. 2 a, b, c).
The dynamics of changes in the quantitative indicators obtained as a quotient obtained by dividing the value of the features of the subject of the Russian Federation by the total value of the corresponding indicator of the Russian Federation as a whole and arranged in ascending order is given in Table 2 . We use the five-year research period proceeding from the conditions of the most visual representation of the results on the graphs (see Fig. 2 a, b, c).
1995 2015 1995 2015 1995 2015
........1/х 1/х ....... 1/х
а) Ь) с)
* Compiled with the use of the data from Table 2.
Table 2. Distribution of relative values of regional indicators, %
|
Region |
1995 |
2000 |
2005 |
2010 |
2015 |
|
Share of GRP in GDP, % |
|||||
|
1. Krasnodar Krai |
2.20 |
2.36 |
2.07 |
2.73 |
3.00 |
|
2. Rostov Oblast |
1.87 |
1.52 |
1.46 |
1.75 |
1.80 |
|
3. Voronezh Oblast |
1.17 |
0.86 |
0.74 |
0.92 |
1.27 |
|
4. Volgograd Oblast |
1.39 |
1.12 |
1.13 |
1.15 |
1.13 |
|
5. Saratov Oblast |
1.45 |
1.10 |
0.95 |
1.00 |
0.95 |
|
6. Astrakhan Oblast |
0.41 |
0.52 |
0.39 |
0.38 |
0.49 |
|
7. Republic of Crimea |
0.00 |
0.00 |
0.00 |
0.00 |
0.38 |
|
8. Adygeya Republic |
0.13 |
0.10 |
0.09 |
0.13 |
0.13 |
|
9. Republic of Kalmykia |
0.06 |
0.14 |
0.05 |
0.06 |
0.07 |
|
10. Sevastopol |
0.00 |
0.00 |
0.00 |
0.00 |
0.06 |
|
Share of jobs, in % |
|||||
|
1. Krasnodar Krai |
3.19 |
3.16 |
3.28 |
3.37 |
3.52 |
|
2. Rostov Oblast |
3.03 |
2.90 |
2.84 |
2.81 |
2.69 |
|
3. Volgograd Oblast |
1.92 |
1.84 |
1.88 |
1.82 |
1.62 |
|
4. Saratov Oblast |
1.89 |
1.79 |
1.75 |
1.79 |
1.59 |
|
5. Voronezh Oblast |
1.67 |
1.69 |
1.58 |
1.56 |
1.51 |
|
6. Republic of Crimea |
0.00 |
0.00 |
0.00 |
0.00 |
1.18 |
|
7. Astrakhan Oblast |
0.68 |
0.66 |
0.67 |
0.66 |
0.66 |
|
8. Sevastopol |
0.00 |
0.00 |
0.00 |
0.00 |
0.24 |
|
9. Adygeya Republic |
0.25 |
0.24 |
0.23 |
0.23 |
0.21 |
|
10. Republic of Kalmykia |
0.20 |
0.18 |
0.17 |
0.17 |
0.15 |
|
Share of population, in % |
|||||
|
1. Krasnodar Krai |
3.42 |
3.51 |
3.57 |
3.67 |
3.76 |
|
2. Rostov Oblast |
3.03 |
3.03 |
3.01 |
2.99 |
2.89 |
|
3. Volgograd Oblast |
1.85 |
1.86 |
1.85 |
1.82 |
1.74 |
|
4. Saratov Oblast |
1.85 |
1.84 |
1.83 |
1.76 |
1.70 |
|
5. Voronezh Oblast |
1.68 |
1.66 |
1.62 |
1.63 |
1.59 |
|
6. Republic of Crimea |
- |
- |
- |
- |
1.30 |
|
7. Astrakhan Oblast |
0.69 |
0.69 |
0.70 |
0.71 |
0.70 |
|
8. Adygeya Republic |
0.30 |
0.31 |
0.31 |
0.31 |
0.31 |
|
9. Republic of Kalmykia |
0.21 |
0.21 |
0.20 |
0.20 |
0.28 |
|
10. Sevastopol |
- |
- |
- |
- |
0.19 |
|
Compiled with the use of: Russian Statistical Yearbook. 2017: Statistics Collection . Rosstat. Moscow, 2017. 686 p. Note. The regions are ranked according to quantitative characteristics for the year 2015. |
|||||
The graphical representation of the distribution of values of quantitative indicators of constituent entities of the Russian Federation included in the macroregion shows the movement toward the Zipf curve (the thin dotted line). The highest rates of approximation to the dependence described by the inversely proportional function (the Zipf curve) are observed in the indicator “gross regional product” (see Fig. 2a, Tab. 2). This fact confirms the conclusion that the amount of the produced value added to the greatest extent reflects the result of redistribution of resources in favor of leaders at the expense of other subjects of the macroregion. The territory of the Volgograd Oblast, which ranks third in the Southern Federal District throughout the period (1995-2015, see the coordinate with the value 3 on the X-axis), experiences the most dramatic decline in the indicators. It should be noted that such a fall was facilitated by the influence of the progressive growth of the economy of the Voronezh Oblast.
The volume of gross regional product (GRP) in the Volgograd Oblast can be maintained or increased only in the case of a significant increase in GRP in Krasnodar Krai and in the Rostov Oblast or if the economy of the Volgograd Oblast moves from the third to the second place in terms of value added in the Southern Federal District of the Russian Federation. This conclusion can be considered as an example that takes into account the processes that occur in the external environment, without which it is very difficult to form scientifically substantiated long-term development goals.
To assess the growth potential of GRP in Krasnodar Krai and in the Rostov and Voronezh oblasts, it is necessary to perform additional research related to the study of the position of these regions in the group of leaders in the Russian Federation. In our paper, such a task was not set and was not addressed.
The opportunities for changing the position of the Volgograd Oblast in the macroregion (for example, its transition from the 3rd to the 2nd place) are associated with the need to adopt very ambitious goals as a guide for a long-term socio-economic development program. These goals should provide for the achievement of such GRP growth rates, which in the short term will ensure the approach or, better still, the excess of the value added produced, for example, in the Rostov Oblast taking into account the long-term development plan of this territorial entity.
The dynamics of distribution of the values of the number of jobs (see Fig. 2b) allow us to reveal those subjects of the Russian Federation in which the decrease in number of jobs is the greatest (Volgograd and Saratov oblasts). In general, the distribution of values describing the number of jobs approaches the Zipf curve much more slowly than GRP (see Fig. 2a).
The lower rate of approach to the inversely proportional function should be explained by the influence of the state, which reduces the number of jobs in the social sphere (education, health, culture, management) much slower than private business structures.
It should be emphasized that the efforts of regional public authorities aimed at preserving existing jobs and creating new ones can significantly change the value added created by the region’s economy. At the same time, creating new jobs is not enough. It is important that such jobs are long-term (for example, they function the entire time required to achieve strategic goals). In addition to the duration of jobs functioning, the level of wages in these workplaces is of critical importance. It is not necessary to prove that the amount of wages is a significant, if not the major, factor that influences the decision to change the place of residence. The number of the population expressing willingness to move according to the wage criterion is increasing every year.
The distribution of the population of the regions included in the macroregion approaches the Zipf curve most slowly (see Fig. 2b). The slowest rate of this figure is due to the increase in the proportion of the population of retirement age because of the increase in life expectancy. This category of residents is the least dynamic, since it has a guaranteed income in the form of a state pension and belongs to the number of residents who are more attached to the place of permanent residence.
Discussion
If we omit the details of Zipf’s law application in linguistics, then it can be argued that the inversely proportional function (Zipf’s law) is used most widely in traditional Russian research on income inequality [8] and in the analysis of settlement systems [5, 7, 9]. A similar picture is observed in the publications of foreign authors [11, 12]. Assessing the IQ of the population of a region can be named among the non-traditional areas of application of Zipf’s law [13, 14]. Attention should be paid to the use of the inversely proportional function in the construction of gravitational models of interaction of urban areas [15], and in the substantiation of specialization of social and territorial associations taking into account globalization processes[16].
The application of Zipf’s law in the studies on economic indicators, which in this paper include gross regional product and the number of jobs, is not a novelty. The results of the study of the distribution of value added, and in comparison with the distribution of the inversely proportional function as well, are used to draw conclusions about the impact of economic development on population concentration [17]. In fairness, it is necessary to consider the published findings of the studies that refute any significant impact of economic development on the intensity of the formation of agglomerations in Latin America [18].
Let us pay attention to the popular criticism of the quantitative indicator “gross domestic product” (value added). This criticism, as a rule, is based on the authority of the Nobel Prize winner J. Stiglitz [19, 112]. At the same time, very often, one does not notice the fact that the criticism does not refer to the indicator itself, but to the influence of the financial market on the amount of the produced value added. The growth of this influence is due to the fact that during a sufficiently long period of time the financial market is growing due to the exponential increase in the volume of instruments and transactions that are not related to the actual production of goods or provision of services. In other words, there is an increase in the virtual money supply. We agree with J. Stiglitz’ critical thoughts regarding the above specifics. As for the findings of our research, we can say that all Russia’s constituent entities included in the study show a slight influence of the financial market on the indicator of gross regional product. From this point of view, the application of GRP (value added) appears to be quite correct.
There is no need to prove the importance and objectivity of the indicator “number of jobs” in a socio-territorial association of the population. As previously emphasized, it is jobs that produce value added in all economic activities, and the amount of monetary remuneration for work forms the volume of consumption in the market of goods. In this regard, the use of this indicator to assess the socio-economic situation in the region should be regarded as an objectively necessary measurement.
Population size is the basis for making decisions on the placement of social infrastructure and for assessing the demand in the housing market, including the capacity of engineering infrastructure. Studying this indicator refers to the necessary and sufficient conditions for the functioning of the territorial planning process. The application of Zipf’s law to study the distribution of population in the territory of Russia’s constituent entity or macroregion is studied in sufficient detail [6].
The arguments in favor of the fact that the conclusions formed by the use of Zipf’s law are significantly influenced by the sample size and by the quantitative and qualitative characteristics of the objects under consideration seem well-founded [10]. Currently, we are trying to assess the impact of the sample size and the subjects included in it on the reliability of the findings, but it will be premature to publish the findings of these studies.
Conclusions
-
1. Comparison of the results of evaluation of the socio-economic situation of the region relative to the leader in the traditional way (see Fig. 1 a, b, c) and by means of distribution of quantitative indicators (see Fig. 2 a, b, c) allows us to say that the data presented in the form of distribution provide a more accurate assessment. The advantages of a research that uses distribution include the possibility of studying several territorial entities (for example, the present paper considers ten Russia’s constituent entities).
-
2. Comparison of value added distributions shows the tendency of quantitative values toward the graph of inversely proportional dependence (Zipf’s law, see Fig. 2a), which is typical for a market (competitive) economy. It is important to emphasize that for the representative regions included in the sample, the share of economic activity in the sphere of finance does not have any significant impact on the value of gross regional product (GRP). This fact allows us to say that the dynamics of changes in GRP describes with sufficient accuracy the processes taking place in the economy of Russia’s constituent entities.
-
3. The graph that depicts the distribution of values describing the change in the number of effective jobs in the economy (see Fig. 2b) shows a slower movement toward the Zipf curve. Such dynamics most likely characterize the degree of state participation in the creation and preservation of jobs in the services sector (social infrastructure). In fact, the share of jobs created and maintained at the expense of budgets of all levels is not less than half of the number of jobs in the non-productive sector of the economy (in the services sector) [20].
-
4. The indicator “population size” should be considered as the most inert and the least responsive to economic changes (see Fig. 2b). This is explained by the fact that quite a large part of the population does not belong to the economically active population (young people under the age of 18 and the older generation above the retirement age). If the majority of young people are not yet able to make independent decisions related to the change of place of residence, then the older generation makes such decisions on the basis of long reflection and careful weighing of the arguments for and against.
We can point out that studying the current situation by comparing the distribution of the objects under consideration with the basic (ideal or theoretical) distribution will allow us to identify general trends of representative subjects, to find a place in this system for a particular region more accurately (in our paper – for the Volgograd Oblast), and to simulate the consequences of the given strategic landmarks.
Gross regional product most closely reflects the processes associated with growth of or decline in economic activity. If the first six territories are characterized by a drop in value added production (GRP) relative to the leader (Krasnodar Krai), then the territories under the numbers 7–10 (see Tab. 2) show minor fluctuations relative to the steady value. Based on the logic of Zipf’s law, it is important to emphasize that it is the subjects under the numbers 7–10 that have the greatest potential for growth, which, most likely, will not meet significant resistance from the business located on the territory of the leader (Krasnodar Krai).
On closer examination of the graph that shows the distribution of the employed population we note that the behavior of the curve is somewhat different as compared to GRP. The change in the behavior is due to the presence of the Republic of Crimea in the group of Russia’s constituent entities under consideration. The shift of the Astrakhan Oblast toward a lower place indicates that the number of employees in Crimea exceeds that in the Astrakhan Oblast. However, if we pay attention to the distribution of GRP, then we note that the Astrakhan Oblast ranks higher than Crimea (see Tab. 2). The conclusion is obvious: the comparison of the distributions shows that the economic efficiency of jobs in the Astrakhan Oblast is higher.
A similar conclusion can be made when comparing the Volgograd and Voronezh oblasts. By 2015, the Voronezh Oblast was ahead of the Volgograd Oblast in terms of value added. At the same time, the number of jobs in the Voronezh
Oblast is still less than in the Volgograd Oblast.
The shape of the curve describing the distribution of the population in the representative regions was influenced by the inclusion of the indicator of the Republic of Crimea in 2015. In general, the situation with the distribution of the population is characterized by the lowest rate. In our opinion, the availability of jobs is a major reason determining the choice of the place of residence by the economically active population. And these are not just any jobs in any area of economic activity, but those whose quality (type of activity) and the level of remuneration meet the requirements of employees.
The economic substantiation of the location of production facilities, transport, engineering and social infrastructure should be considered the most important condition, without which strategic territorial planning does not make sense. Our point of view is described in more detail in [21, 22].
References Territorial planning and Zipf's law
- Gainanov D.A., Biglova G.F., Ataeva A.G. Strategic management of key development potential of split-level territorial socio-economic systems. Ekonomicheskie i sotsial'nye peremeny: fakty, tendentsii, prognoz=Economic and Social Changes: Facts, Trends, Forecast, 2017, vol. 10, no. 2, pp. 35-47. . DOI: 10.15838/esc.2017.2.50.4
- Ivanter V.V. et al. Structural and investment policy for modernization of the Russian economy. Problemy prognozirovaniya=Studies on Russian Economic Development, 2017, no. 4, pp. 3-16..
- Nizhegorodtsev R.M., Piskun E.I., Kudrevich V.V. The forecasting of regional social and economic development. Ekonomika regiona=Economy of Region, 2017, no. 1, pp. 38-48. . DOI: 10.17059/2017-1-4
- Silin Ya.P., Animitsa E.G., Novikova N.V. Regional aspects of new industrialization. Ekonomika regiona=Economy of Region, 2017, no. 3, pp. 684-696. . DOI: 10.17059/2017-3-4
- Makarova M.N. Small towns in the spatial structure of regional population distribution. Ekonomicheskie i sotsial'nye peremeny: fakty, tendentsii, prognoz=Economic and Social Changes: Facts, Trends, Forecast, 2017, vol. 10, no. 2, pp. 181-194. . DOI: 10.15838/esc.2017.2.50.10
- Fattakhov R.V., Abdulov R.V. Economic and demographic factors shaping urban settlement (the Central Federal District case study). Regional'naya ekonomika: teoriya i praktika=Regional Economics: Theory and Practice, 2015, no. 11, pp. 2-15..
- Kozlova O.A., Sos'kova O.N. Spatial differentiation factors of urban population density in the industrial regions of the Urals and Trans-Urals. Ars Administrandi=Iskusstvo upravleniya, 2018, no. 1, pp. 64-79. .
- DOI: 10.17072/2218-9173-2018-1-64-79
- Shamrai-Kurbatova L.V., Filippov M.V. Main provisions of the mechanism for remuneration of employees, taking into account the cost of electronic information used in the organization. Biznes. Obrazovanie. Pravo=Business. Education. Law, 2017, no. 4, pp. 207-212..
- Rastvortseva S.N., Manaeva I.V. Analyzing the effect of the Zipf's law in Russian cities. Ekonomicheskii analiz: teoriya i praktika=Economic Analysis: Theory and Practice, 2015, no. 46, pp. 56-66..
- Kolomak E.A. What does the deviation from Zipf's law mean? EKO=ECO, 2016, no. 11, pp. 121-128..
- Clifton N., Cooke P., Kalsø Hansen H. Towards a reconciliation of the ‘Context-less' with the ‘Space-less'? The Creative class across varieties of capitalism: New Evidence from Sweden and the UK. Regional Studies, 2013, vol. 47, no. 2, pp. 201-215.
- DOI: 10.1080/00343404.2012.665991
- González-Val R., Lanaspa L. Patterns in US urban growth, 1790-2000. Regional Studies, 2016, vol. 50, no. 2, pp. 289-309.
- DOI: 10.1080/00343404.2014.906742
- Glückler J. Knowledge, networks and space: connectivity and the problem of non-interactive learning. Regional Studies, 2013, vol. 47, no. 6, pp. 880-894.
- DOI: 10.1080/00343404.2013.779659
- Veresh P. Percentage ratio and non-Gaussian distribution Zipf of creativity and IQ in a population. Sotsium i vlast'=Socium and Power, 2016, no. 4, pp. 29-36..
- Poot J., Alimi O., Cameron M.P., Mare D.C. The gravity model of migration: the successful comeback of an ageing superstar in regional science. Investigaciones Regionales -Journal of Regional Research, 2016, vol. 36, pp. 63-86.
- McCann P., Ortega-Argilés R. Smart Specialization, Regional Growth and Applications to European Union Cohesion Policy. Regional Studies, 2015, vol. 49:8, pp. 1291-1302,
- DOI: 10.1080/00343404.2013.799769
- Florida R., Gulden T., Mellander Ch. The rise of the mega-region, Cambridge. Journal of Regions, Economy and Society, 2008, vol. 1, pp. 459-476.
- DOI: 10.1093/cjres/rsn018
- Aroca P., Atienza M. Spatial concentration in Latin America and the role of institutions. Investigaciones Regionales -Journal of Regional Research, 2016 vol. 36, рр. 233-253.
- Stiglitz J., Sen A., Fitoussi J.-P. Neverno otsenivaya nashu zhizn': pochemu VVP ne imeet smysla: doklad Komissii po izmereniyu effektivnosti ekonomiki i sotsial'nogo progressa . Moscow: Izd-vo Instituta Gaidara, 2016. 216 p.
- Lavrent'eva E.V., Chumakova E.A. Assessing the influence of municipality's budget structure on human capital development. Ekonomicheskii analiz: teoriya i praktika=Economic Analysis: Theory and Practice, 2016, no. 10, pp. 68-78..
- Kabanov V.N., Dontsov D.G., Yushkova N.G., Mikhailova E.V. Prostranstvenno-strategicheskoe razvitie territorii . Volgograd: Niva, 2018. 276 p.
- Kabanov V.N. Principles of deploying the objects of social and transport infrastructure in regional strategic planning documents. Ekonomicheskie i sotsial'nye peremeny: fakty, tendentsii, prognoz=Economic and Social Changes: Facts, Trends, Forecast, 2018, vol. 11, no. 3, pp. 71-83. .
- DOI: 10.15838/esc.2018.3.57.5
