Text Region Extraction: A Morphological Based Image Analysis Using Genetic Algorithm

Автор: Dhirendra Pal Singh, Ashish Khare
Журнал: International Journal of Image, Graphics and Signal Processing(IJIGSP) @ijigsp
Статья в выпуске: 2 vol.7, 2015 года.
Бесплатный доступ
Image analysis belongs to the area of computer vision and pattern recognition. These areas are also a part of digital image processing, where researchers have a great attention in the area of content retrieval information from various types of images having complex background, low contrast background or multi-spectral background etc. These contents may be found in any form like texture data, shape, and objects. Text Region Extraction as a content from an mage is a class of problems in Digital Image Processing Applications that aims to provides necessary information which are widely used in many fields medical imaging, pattern recognition, Robotics, Artificial intelligent Transport systems etc. To extract the text data information has becomes a challenging task. Since, Text extraction are very useful for identifying and analysis the whole information about image, Therefore, In this paper, we propose a unified framework by combining morphological operations and Genetic Algorithms for extracting and analyzing the text data region which may be embedded in an image by means of variety of texts: font, size, skew angle, distortion by slant and tilt, shape of the object which texts are on, etc. We have established our proposed methods on gray level image sets and make qualitative and quantitative comparisons with other existing methods and concluded that proposed method is better than others.
Image processing, Text detection, Genetic algorithm, Morphological Dilatation, Erosion, Edge detection
Короткий адрес: https://sciup.org/15013527
IDR: 15013527
Текст научной статьи Text Region Extraction: A Morphological Based Image Analysis Using Genetic Algorithm
Digital Image Processing [1][2] is an art of examining; identifying and judging the impact of images so that one can be explore the significance of the image for study by the human interpreters. The Area of computer vision and pattern recognition is also a part of Digital Image Processing which shows a great attention in content retrieval from images and videos. Detection and extraction of text regions in an image is a well known problem in the computer vision study area. These contents may be found in any form like texture data, shape, and objects. Text Extraction as a content from an mage is a class of problems in Digital Image Processing Applications that aims to provides necessary information which are widely used in many fields medical imaging, pattern recognition, Robotics, Artificial intelligent Transport systems etc. To extract the text data information has becomes a challenging task. Text provides highly condensed information about the contents of images. Sometimes it remains difficult to extract and carry out any of the text matter from the image, which can be used for further analysis. The difficulty in text extraction persist due to the following reasons; The text properties vary randomly with non-uniform distribution, Texts present in an image may have different disorganized background, image Background and text may be ambiguous, Unknown text size, position, orientation, and layout: captions lack the structure usually associated with documents leads to a wide range of character sizes in a same scene.
Text extraction and localization method can be classified in various ways; mainly it is characterized by two main methods, one is Thresholding based method and another is Grouping based method. Graphically, we can further classify these methods:
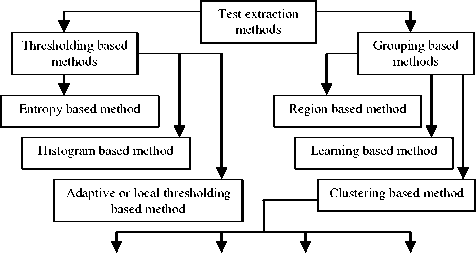
Density based K-means Graph theory Gaussian Modeling
Fig 1. Text Extraction Methods
Text understanding systems include three main objectives: text detection, text extraction and text recognition. A text extraction system usually assumes that text is the major input contributor, but also has to be robust against variations in the detected text’s bounding box size. Text localization methods, usually grouped into region-based, edge-based, connected components-based and texture based [3]. Text extraction is an essential and vital step as it sets up the quality of the final recognition result. It aims at segmenting text from background, meaning isolated text pixels from those of background. A number of methods are proposed for text extraction and localizing [3]. Text information extraction is very useful in document processing applications [4][5], Identification of Number Plate[6] etc. . Text may be embedded in videos [7] and to extract text is very challenging task from videos. Morphological operations are also used in text extraction [8]. In Morphological based text analysis, as proposed by Jui-Chen Wu et al. [9] text regions are detected from cluttered images. In this paper, Jui-Chen Wu et al. proposed a morphological based text extraction algorithm. J fabrizio et al.[10] Proposed an algorithm which decompose text strings and then restore text strings with a specified region with the help of support vector machine. S. Liang et al. [11] also proposed a morphological based approach for text string extraction from a simple background scene text images. On the basis of frequency, orientation and spacing of the text, Victor Wu et al. proposed a robust algorithm [12] for text detection and recognition in images.
In this Paper, to test the performance and robustness of our proposed algorithm, we have compared our proposed algorithm with the edge based algorithm for text region extraction and localization proposed by J. Samarabandu et.al.[13][14]. The comparison is based on the qualitatively i.e. image quality enhancement features of edge, intensity and entropy and quantitatively i.e. precision, recall, f-score.
The present paper is organized in five sections. First section namely; Introduction, describes the introduction and previous research on image analysis methods, second section describes the proposed algorithm, third section describes various parameters to test the performance the proposed method, fourth section describes experimental results. In this section we have compare our method with the method proposed by J. Samarabandu et.al.[13][14]. Last section describes conclusion of this paper and future prospects.
-
II. Proposed algorithm description
We proposed following algorithm for text detection and text region extraction:
Step1: Create an initial population
Step2: Calculate the objective functions for the current population
Step3: Apply cumulative fitness assignment criteria and selection procedure
Step4: Apply the NSGA II [9] Algorithm for selection of new population.
Step5: Find Best Individuals.
Step6: Apply Crossover and Mutation on the new population (obtained by Step 4) for creating a new population.
Step7: Display Image using best individuals
(obtained by Step 5).
Step8: Apply local enhancement and morphological operations.
Step9: Obtain the text region extracted Image.
In Digital Image Processing, Morphology is a science of shape, regions and Structures. Morphology is often used for extracting the image components that are helpful in image analysis by representing regions and shapes. There are some fundamental operations of image morphology they are Dilation and Erosion. Dilation performs the effects of filling in the valleys between spiky edges while erosion performs the effects of deleting spiky edges. In other way Dilation maximizes the pixels to the boundaries of the objects in an image while Erosion minimizes the number of pixels from the boundaries of the object. But both the operations are useless without Structuring Elements. The size of structuring element play important role for both Erosion and Dilation operations. Structuring element has some common shapes like squares, lines disks. The centre pixel of structuring element is called the origin and it classifies the pixel which is being processed. Mathematically, if X is an Image and Y is an Structuring element in two dimensional space say Z, then Dilatation of X by Y is defined as:
X ⊕ Y={|(Yˆ)z ∩ X ≠∅ } (1)
Where Ø means empty set, ∩ means AND operator, and (Yˆ) defines reflection of Y about its origin and shifting it by Z. Dilation defines set of all displacements, z, such that (Y) and x overlap by at least one element. Dilation may also be defined as:
X ⊕ Y={Z|[(Yˆ) z ∩ X] ∈ X} (2)
While Erosion can be defined as :
X Θ Y={Z|(Yˆ) z ∈ X} (3)
Above equation employs set of all points Z such that X, shifted by Z, is a subset of X i.e. Y is fully contained with in X. Therefore by above both the equations we can conclude that, Dilation of image X is equivalent to the erosion of the complement of the image X.
Genetic Algorithm is very useful and powerful procedure for solving a broad range of problems. For better results Genetic algorithms provides a new set of approximation at each generation, by the process of selecting individuals according to their level of fitness in the problem domain and breeding them together using operators borrowed from natural genetics. This process leads to the evolution of populations of individuals that are better suited to the environment than the individuals from which they are created, as in natural adaptation. The members in a set of population having high fitness values are called ‘most fit members’, only can survive, and the
‘least fit members’ having low fitness value are eliminated from the population.
Since our goal is to emphasize high visual information display, sharpening and identifying the extracted text quality, we enhance our proposed results by applying local transformation method, proposed by C. Munteanu and A. Rosa [15] that is based on gray level distribution in the neighborhood of every pixel is given as:
g ( x , y ) = k * { M /( с ( X , y ) + b } * { f ( X , y ) - C * m ( x , У ) } + m ( x , У ) a (4)
where, a,b,c and k are tunable parameters,
g(x,y) stands for output pixel intensities,
f(x,y) stands for input pixel intensities,
M stands the global mean,
σ(x,y) and m(x,y) stands for the local standard deviation and mean calculated in the neighborhood of 3x3,
A 3x3 neighbourhood around a point (x,y) in an image[16] is shown below-
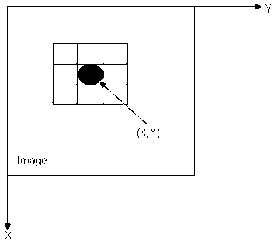
Fig 2. A 3x3 neighbourhood around a point (x,y) in an image
We proposed a fitness function criteria which is based on individual objective i.e. intensity, entropy and edges. Our aim of Proposed method is to maximize all the objectives using various methods like Sobel Edge Detector [17], Scale Transformation method etc. After evaluating fitness of all individual objectives (Entropy, Edge and Intensity), combined fitness or cumulative fitness is calculated. In proposed text extraction and localizing method resolution enhancement process is used with the use of Genetic Algorithm by introducing three parameters; edge, for identifying the clear boundary, intensity, for enhancement and improvement in image quality and third parameter entropy, for measure of disorders in the image. It restores undistorted frequency content using iterative process with genetic algorithm.
Edges in an image can be defined as rapid changes in image intensity over a small region. One method of measuring these changes is the use of discrete difference operators. It consists of two masks which calculate the changes in both the direction i.e. in the X direction and Y direction respectively.
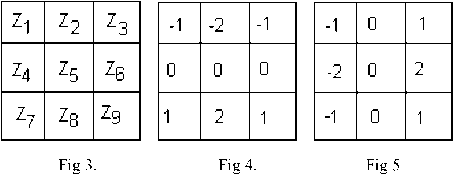
Figure 3 shows a 3x3 region of Image, Z’s are gray level values and masks are used to compute gradient at point Z5 . In Figure 4 Sobel mask for gradient component Gx and in Figure 5 Sobel mask for gradient component Gy are represented.
For image pixel I(x,y) labeled as Z 5 above,
Gx= (Z7 +2 *ZS +Z„ ) - (Z, +2 *Z2 +Z3 )
Gy = (Z3+2*Z6+Z9) - (Z+2*Z4+Z7)
and Gradient = [Gx2 + Gy2 ]1/2
Now number of edgels are calculated by calculating gradients at every pixel in the image.
In Genetic Algorithm, we use genetic operator ‘Selection operator’ and ‘Crossover Operator’. Genetic Operators are the step that guides the Genetic Algorithm towards better solutions. In Genetic Algorithm, search space or state space, act as a container of all the feasible (possibly best) solutions. Each point in the search space represents one possible solution, marked by its value which is called its fitness value. A simple Genetic Algorithm can be understand by knowing the some basic terms i.e. Chromosomal representation of solution, genetic operators etc.
To formulate the process of natural solution in a machine, a method is needed to encode potential solution of the problem in the form that a computer can process, is known as representation technique. Chromosome of image are to be represented as an array of real integer of length four [a, k, b, c] where a, k, b and c are the parameter and the values of a ranging from o to 1.5, k from 0.5 to 1, b from 0 to 0.5 and c from 0 to 1.0. We proposed Tournament Selection which operates by choosing some individuals randomly from a population and selecting the best from this group to survive in to the next generation. Once Selection has chosen fit individuals, they must be randomly altered in hopes of improving their fitness for the next generation. Crossover is a mating technique to produce better individuals. In Crossover, two individuals are chosen to swap segments of their code, to produce offspring. We have used Arithmetic Crossover [18]. In Arithmetic Crossover, some arithmetic operation is performed to make a new offspring and it can be defined as a linear combination of two chromosomes such as:
Offspring1 = ρ*α+(1- ρ) *β
Offspring2 = (1- ρ) *α+ ρ*β
Where α and β be two parents in the mating pool and ρ is a random number and ρ Є [0,1].
In the proposed paper, we have taken different sets of images of different sizes, we have choose Maximum number of generation =10; this is the criteria to stop the evolution, simple mutation has to be taken having probability=0.1, Arithmetic crossover has to be taken having crossover probability =0.8, selection has to be taken as tournament selection, and finally, size of the population =48.
-
III. Performance statistical parameters
For the purpose of objectively testing the performance of proposed method, we have number of classifiers; they are Precision, Recall, Accuracy and F-Score[19]. Since Recall and Precision individually measures the quality of information retrieval therefore, for convenient purpose we make use of a single measure ‘F-Score’ to do the similar assessment. Hence we have expressed our proposed algorithm results in terms of Accuracy and F-Score. Precision is defined as the ratio of correctly detected characters to sum of correctly detected characters plus false positives where false positives / false alarms are those regions in the image which are actually not characters of a text, but have been detected by the algorithm as text. Recall is defined as the ratio of the correctly detected characters to sum of correctly detected characters plus false negatives where false negatives / misses are those regions in the image which are actually text characters, but have not been detected by the algorithm. Accuracy measures the degree of exactness or fidelity and may be defined as the ration of the sum of true positive (TP) and true negative (TN) to the sum of true positive, false positive (FP), true negative and false negative (FN) expressed as Accuracy= (TP+TN)/(TP+TN+FP+FN). F-score is the harmonic mean of recall and precision rates and expressed as F-Score = (2*Precision*Recall)/(Precision+Recall).
-
IV. Experimental results
The outcome of proposed method has been implemented on the Computer System having Microsoft Windows XP Professional Service Pack 3, Intel Pentium 3.20GHz CPU, 512 MB Ram, and used MATLAB 7.0 (R14). We have illustrated our proposed technique on various gray level images of different sizes. The framework proposed here addresses a new robust and adaptive text region extraction criteria using genetic algorithm. For evaluating the accuracy of our proposed method, we have tested various statistical measures which maximize the image quality. On the basis of the image quality and statistically as described in various tables, we compared our proposed method with the method proposed by J. Samarabandu et.al.[13][14].
Table 1. Size of Images
|
Sl. No. |
Image |
Image Size(in pixels) |
|
1. |
A |
270x420 |
|
2. |
B |
480x640 |
|
3. |
C |
480x640 |
|
4. |
D |
480x640 |
|
5. |
E |
240x320 |
|
6. |
F |
480x640 |
|
7. |
G |
480x640 |
|
8. |
H |
480x640 |
|
9. |
I |
480x640 |
|
10. |
J |
461x614 |
|
11. |
K |
480x640 |
|
12. |
L |
600x800 |
|
13. |
M |
480x640 |
I1KG2 POWE» .Аатйх
#$$ ■.-■'■■..• .
qi rnpv ; Hbs,
Л^Ч^Й*^^^^ ■. ■»■ №^«K@>-«^- smv^i^ NRF VX'Q
(a)
(b)
(c)
(g)

(d)
(h)
(e)

(i)
(f)
(j)
(k)
(b)
(a)
(i)
(a) (b)
(ii)
(l)
(a) (b)
(iii)
(m)
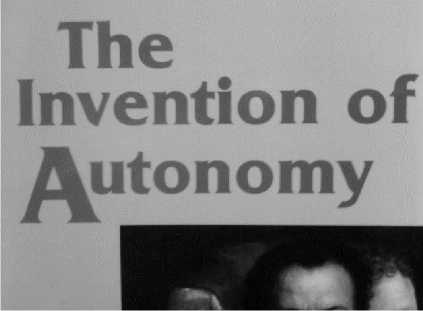
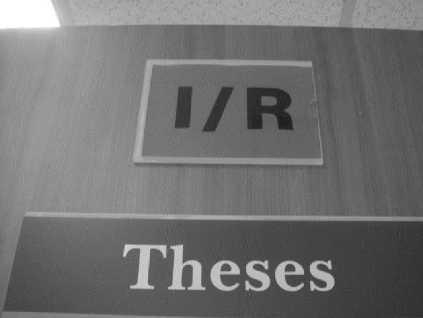
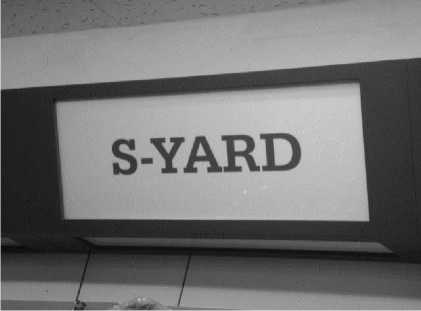
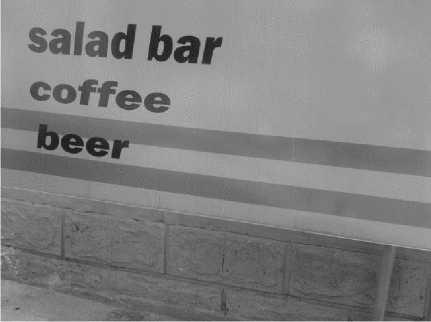
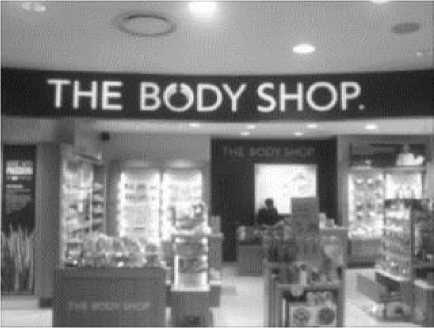
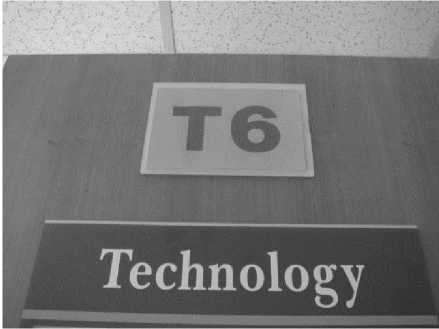
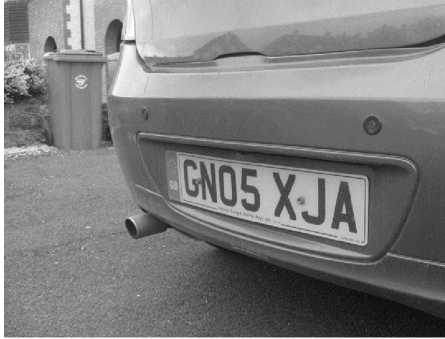
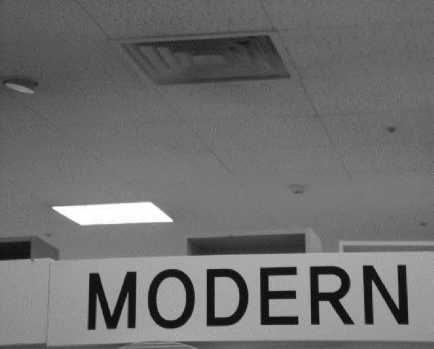
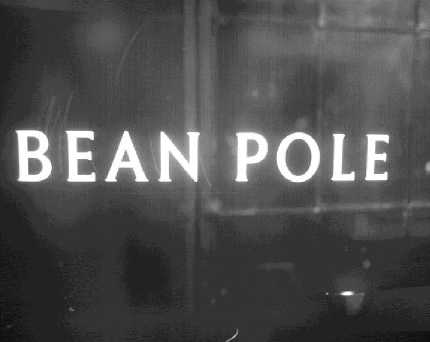
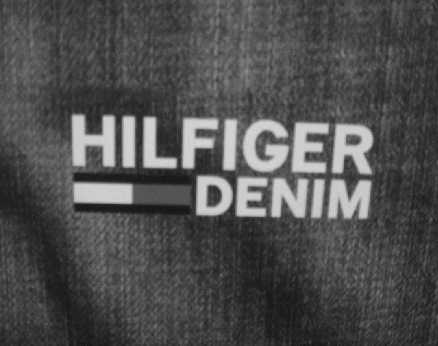
Fig 6. Original Images for experimentation purpose
(a) (b)
(iv)
(a) (b)
(v)
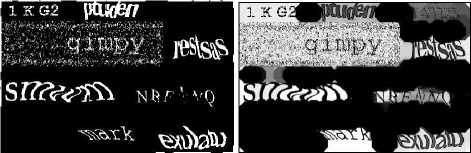
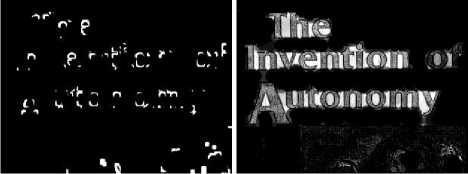
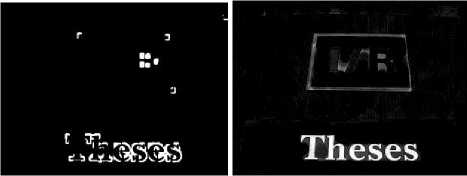
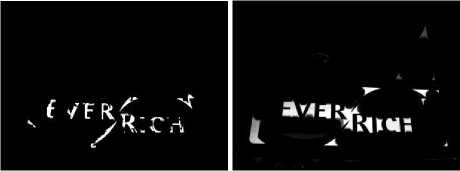
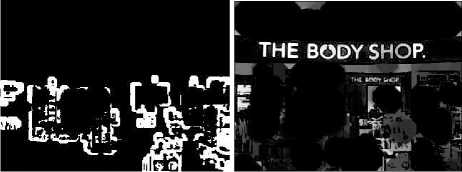
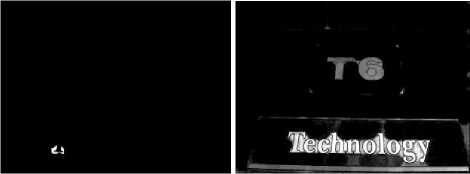
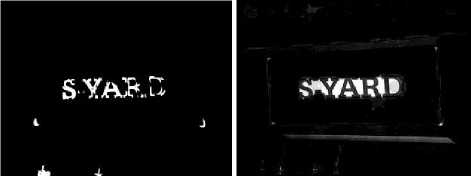
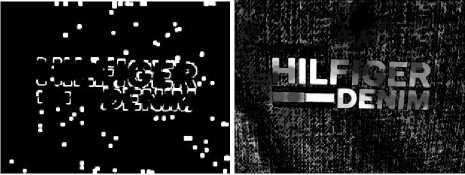
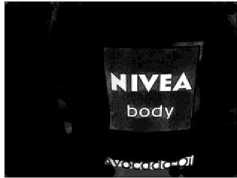
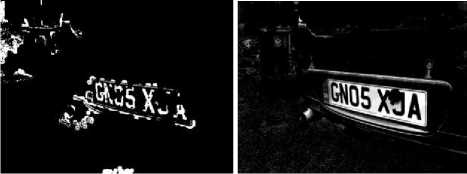
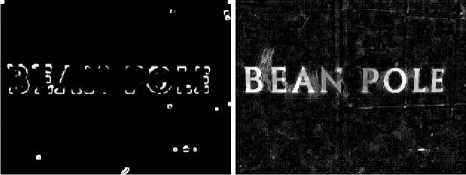
Comparison of results obtained by the proposed method and J. Samarabandu algorithm is visually shown in Figure 7. It can be identified clearly that the proposed method enhance[20] the image as well as extracted the text region efficiently. The value of the statistical performance parameters are also given in tables (Table 2 -Table 6).
(a) (b)
(vi)
(a) (b)
(vii)
(a) (b)
(xiii)
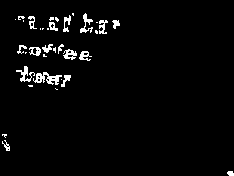

Fig 7. (a) Images generated by J. Samarabandu Method, (b) Images generated by the Proposed method.
(a) (b)
(viii)

(a) (b)
(ix)
(b)
(a)
(x)
>a::f:R.\ mi па^
(a) (b)
(xi)
(a) (b)
(xii)
Table 2. Comparison of Performance Measure ‘F-Score’
|
Sl. No. |
Image Name |
F-SCORE |
|
|
J. Samarabandu Method |
Proposed Method |
||
|
1. |
a |
0.4313 |
0.6890 |
|
2. |
b |
0.1161 |
0.5885 |
|
3. |
c |
0.0926 |
0.7690 |
|
4. |
d |
0.0665 |
0.5639 |
|
5. |
e |
0.3555 |
0.5574 |
|
6. |
f |
0.0042 |
0.4378 |
|
7. |
g |
0.0645 |
0.7465 |
|
8. |
h |
0.1102 |
0.5231 |
|
9. |
i |
0.1045 |
0.4123 |
|
10. |
j |
0.1668 |
0.7055 |
|
11. |
k |
0.0858 |
0.2130 |
|
12. |
l |
0.0827 |
0.8319 |
|
13. |
m |
0.2129 |
0.8547 |
|
14. |
Average |
0.1456 |
0.6017 |
Table 3. Comparison of Performance Measure ‘Accuracy’
|
Sl. No. |
Image Name |
ACCURACY |
|
|
J. Samarabandu Method |
Proposed Method |
||
|
1. |
a |
0.2815 |
0.5269 |
|
2. |
b |
0.0617 |
0.4170 |
|
3. |
c |
0.0486 |
0.6247 |
|
4. |
d |
0.0344 |
0.3926 |
|
5. |
e |
0.2162 |
0.3864 |
|
6. |
f |
0.0021 |
0.2803 |
|
7. |
g |
0.0333 |
0.5956 |
|
8. |
h |
0.0583 |
0.3542 |
|
9. |
i |
0.0552 |
0.2597 |
|
10. |
j |
0.0910 |
0.5450 |
|
11. |
k |
0.0448 |
0.1192 |
|
12. |
l |
0.0420 |
0.7122 |
|
13. |
m |
0.1191 |
0.7463 |
|
14. |
Average |
0.0837 |
0.4584 |
Table 4. Comparison of Intensity Values
|
Sl. No. |
Image Name |
INTENSITY |
|
|
J. Samarabandu Method |
Proposed Method |
||
|
1. |
a |
9.2567e+003 |
8.8850e+003 |
|
2. |
b |
3.9807e+003 |
1.3135e+004 |
|
3. |
c |
3.1624e+003 |
7.5185e+003 |
|
4. |
d |
2.3005e+003 |
3.0623e+003 |
|
5. |
e |
3.9561e+003 |
2.9082e+003 |
|
6. |
f |
157.0623 |
5.9767e+003 |
|
7. |
g |
2.0712e+003 |
4.9634e+003 |
|
8. |
h |
3.8929e+003 |
7.8963e+003 |
|
9. |
i |
3.6769e+003 |
3.8856e+003 |
|
10. |
j |
6.3262e+003 |
9.6308e+003 |
|
11. |
k |
2.7487e+003 |
3.7874e+003 |
|
12. |
l |
4.2610e+003 |
3.3283e+004 |
|
13. |
m |
7.2955e+003 |
2.0705e+004 |
Table 5. Comparison of Entropy Values
|
Sl. No. |
Image Name |
ENTROPY |
|
|
J. Samarabandu Method |
Proposed Method |
||
|
1. |
a |
2.2170 |
4.8586 |
|
2. |
b |
0.6198 |
4.0027 |
|
3. |
c |
0.4965 |
4.1400 |
|
4. |
d |
0.3716 |
2.6010 |
|
5. |
e |
1.7154 |
3.5658 |
|
6. |
f |
3.5658 |
2.7929 |
|
7. |
g |
0.3564 |
3.7388 |
|
8. |
h |
0.5777 |
3.3555 |
|
9. |
i |
0.5527 |
2.5710 |
|
10. |
j |
0.8524 |
4.1998 |
|
11. |
k |
0.4634 |
1.3945 |
|
12. |
l |
0.4443 |
5.5466 |
|
13. |
m |
1.0543 |
5.9271 |
Table 6. Comparison of Edges Values
|
Sl. No. |
Image Name |
EDGES |
|
|
J. Samarabandu Method |
Proposed Method |
||
|
1. |
a |
7448 |
6921 |
|
2. |
b |
3414 |
15170 |
|
3. |
c |
2817 |
6422 |
|
4. |
d |
2015 |
2688 |
|
5. |
e |
3571 |
2471 |
|
6. |
f |
140 |
8064 |
|
7. |
g |
1827 |
6685 |
|
8. |
h |
3510 |
9471 |
|
9. |
i |
3188 |
4989 |
|
10. |
j |
6309 |
7286 |
|
11. |
k |
2430 |
6475 |
|
12. |
l |
4055 |
19228 |
|
13. |
m |
6397 |
15527 |
It is clear from the above tables that our criteria of choosing genetic algorithm whose fitness is to maximize of the parameters intensity, entropy and edges and by the Table 4, Table 5 and Table 6. Each parameter shows higher values and describes the robustness of proposed algorithm. We have compared our proposed algorithm with the algorithm proposed by J. Samarabandu et.al.[13][14]. In terms of text region extraction and image enhancement i.e. qualitatively and statistically, we have display our proposed image and compared with the image proposed by J. Samarabandu in Figure 7. As we have clearly identified by the tables and the parameters intensity, entropy and edges whose values are much higher than the value proposed by the J. Samarabandu et.al. [13][14], this comparison describes that our proposed image is an enhance image. We have also compared the values of accuracy and f-score proposed by our algorithm and J. Samarabandu et.al. [13][14] which are listed in Table 2 and Table 3. On average, the proposed algorithm achieved f-score of 0.6017 and accuracy of 0.4584 and the values of f-score and accuracy obtained by J. Samarabandu et.al. algorithm are 0.1456 and 0.0897 respectively. Qualitatively, proposed algorithm extracted the text as well as text region very clearly, while on the other hand the image generated by the method proposed by J. Samarabandu does not clearly extracted text as well as text region. Therefore, In terms of image enhancement, text extraction and text region extraction, the proposed algorithm achieves great results.
-
V. Conclusions
Key concentration of this paper is to extract the text and identify the text regions from various types of gray image set containing document text images and caption text images, using Genetic Algorithm by incorporating morphological methods. It can be seen that by using the proposed method, very promising and excellent results are achieved. All outcomes are qualitatively shown in various figures (Figure.7) and quantitatively in tables. We believe that our proposed method definitely bring a massive impact in the research towards digital image processing applications. Further, the proposed method may also be extended by applying on the other image processing applications.
Список литературы Text Region Extraction: A Morphological Based Image Analysis Using Genetic Algorithm
- Andrews, H. C. and Hunt, B. R., Digital Image Restoration, Engleword Cliffs, NJ:Printice Hall, 1997.
- Jain, A. K, Fundamentals of Digital Image Processing, Prentice-Hall Inc., 1989.
- Jung, K, Kim, K. I. and Jain, A. K. “Text information extraction in images and video: a survey”, Pattern Recognition, 37(5), pp. 977–997, 2004.
- Jain, A. K. and Yu, B., “Document representation and its application to page decomposition”, IEEE Transaction on Pattern Analysis and Machine Intelligence, vol. 20, pp. 294-308, March, 1998.
- Jain, A. K. and Zhong, Y., “Page segmentation using Texture analysis”, Pattern Analysis, 29(5), pp. 743-770, 1996.
- Kim, D. S. and Chien, S. I., “Automatic car licence Plate extraction using modified generalized symmetry transform and image wrapping”, Proceedings of International symposium on industrial electronics, vol. 3, pp. 2022-2027, 2001.
- Sato, T., Kanade, T., Hughes, E. K. and Smith, M. A., “Video OCR for digital news aechieve”, 1998 IEEE international workshop on content based access of image and video database, pp. 5260, Bombay, 1998, India.
- Hasan, Y. M. Y. and Karam, L. J., “Morphological text extraction from images”, IEEE Transaction on Image Processing, 9(11), 1978-1983, 2000.
- Wu, Jui-Chen, Hsieh, Jun-Wei, and Chen, Yung-heng, “Morphology-based text line extraction”, Machine Vision and Applications, vol.19, no. 3, DOI 10.1007/s00138-007-0092-0, pp. 195-207, 2008.
- Fabrizo, J., Cord, M. and Marcotegui, B., ‘Text extraction from street level images”, CMRT09, IAPRS, vol. XXXVIII, Part 3/W4 3-4 September, 2009.
- Liang, S. and Ahmadi, M., “A Morphological approach to text string extraction from regular periodic overlapping text/background images”, Computer Vision, Graphics, Image Processing, vol. 56, pp. 102-113, September, 1994.
- Wu, V., Manmatha, R. and Riseman, Edward M., “TextFinder: An Automatic System to Detect and Recognize Text in Images”, IEEE Transactions on Pattern Analysis and Machine Intelligence, vol. 21, no. 11, November 1999.
- Liu, Xiaoqing and Samarabandu, J., An Edge-based text region extraction algorithm for Indoor mobile robot navigation”, in Proceedings of the IEEE International Conference on Mechatronics and Automation (ICMA 2005), Niagara Falls, Canada, pp. 701-706, vol. 2, July 2005.
- Liu, Xiaoqing and Samarabandu, J., “Multiscale edge-based Text extraction from Complex images”, ICME 2006, IEEE International Conference on Multimedia and Expo 2006, pp. 1721-1724, 2006.
- Munteanu, C. and Roas, A., “Gray-Scale Image Enhancement as an automatic Process Driven by Evolution”, IEEE Transaction on Systems, Man, and Cybernetics, Part B: Cybernetics, vol. 34, no. 2, pp.1292-1298, April 2004.
- Gonzalez, Rafel C. and Woods, Richard E., Digital Image Processing, Addison-Wesley, 1987.
- Davis, L. S., “A Survey of Edge Detection Techniques”, Computer Graphics and Image Processing, vol. 4, pp. 248-270, 1975.
- Michalewicz, Z., Genetic Algorithms+Data Structures=Evolution Programs. Berlin, Germany: Springer-Verlag, 1996.
- Korfhage, R., Information Storage and Retrieval, Willey, NewYork, 1997.
- Singh, D. P. and Khare, A., “Evolutionary Image Enhancement Using Multi-Objective Genetic Algorithm”, International Journal of Image, Graphics and Signal Processing, 6(1), pp. 61-67, November, 2013, DOI: 10.5815/ijigsp.2014.01.09.
