Texture Classification Using Complete Texton Matrix

Author: Y.Sowjanya Kumari, V. Vijaya Kumar, Ch. Satyanarayana
Journal: International Journal of Image, Graphics and Signal Processing(IJIGSP) @ijigsp
Article in issue: 10 vol.9, 2017.
Free access
This paper presents a complete image feature representation, based on texton theory proposed by Julesz’s, called as a complete texton matrix (CTM)for texture image classification. The present descriptor can be viewed as an improved version of texton co-occurrence matrix (TCM) [1] and Multi-texton histogram (MTH) [2]. It is specially designed for natural image analysis and can achieve higher classification rate. TheCTM can express the spatial correlation of textons and can be considered as a generalized visual attribute descriptor. This paper initially quantized the original textures into 256 colors and computed color gradient from RGB vector space. Then the statistical information of eleven derived textons, on a 2 x 2 grid in a non-overlapped manner are computed to describe image features more precisely. To reduce the dimensionality the present paper extended the concept of present descriptor and derived a compact CTM (CCTM). The proposed CTM and CCTM methods are extensively tested on the Brodtaz, Outex and UIUC natural images. The results demonstrate the superiority of the present descriptor over the state-of-art representative schemes such as uniform LBP (ULBP), local ternary pattern (LTP), complete –LBP (CLBP), TCM and MTH.
Texton, Histogram, quantization, color gradient, dimensionality
Short address: https://sciup.org/15014238
IDR: 15014238
Text of the scientific article Texture Classification Using Complete Texton Matrix
Published Online October 2017 in MECS
Local texture patterns of images plays an important role in a wide variety of image processing applications like image analysis, image retrieval [ 1, 2 ,3, 4], age classification[5, 6], face recognition [7-11], texture classification [ 12-14]. The task of deriving a texture pattern is one of the difficult problems because texture is defined by many researchers based on their applications, perceptual motivation and there is no generally agreed definition for textures. The three most vital features of any image texture are the shape, texture and color. Out of these three essential features, the “color is the most important” and easily distinguishing visual feature.There are many color based approaches and the most popular methodcolor histogram. The color histogram is simple to implement but it lacks spatial information. Texture deal with object surface, which can be coarse or rough and can exhibit uniform or regular or irregular patterns. The statistical and structural categories are two important and fundamental approaches for texture analysis. The textures are treated as statistical phenomena in statistical or stochastic approach. The idea of texture primitives, frequently called texels or textons are introduced by a structural approach. Structural texture models, work well with macro textures with clear constructions. In the literature several authors derived various statistical methods to effectively characterize the local texture patterns. Gray-level co-occurrence matrix (GLCM) [15] is one of the popular and the earliest texture features , which considers the co-occurrence statistics of pixel pairs in images defined along the horizontal, vertical, diagonal, and anti-diagonal directions [15]. The other popular texture analysis methods are Markov random field (MRF) model [16], simultaneous auto-regressive (SAR) model [17], Wold decomposition model [18], Gabor filtering [19, 20] and wavelet decomposition [21, 22] etc... Later He and Wang [23] proposed the texture spectrum (TS) by simultaneously considering all eight pixels surrounding the center pixel of a 3 x 3 neighborhood. The TS approach could not yield a good texture classification rate. Motivated by the TS approach, later Ojalaet al. [24] proposed the local binary pattern (LBP) that extracts significant local information precisely by deriving a LBP code. The LBP is also extensively used for rotation invariant texture classification [25, 26].
The term texton was proposed by Julesz [27] more than 20 years ago and it played major role in the texture analysis [28-32 ] , texture classification [33-35] , age classification [28] and other applications of texture [35, 36]. The texton theory [27] emphasizes more on critical distances (d) between texture elements and textons. The textons are formed only if the adjacent elements lies within the d-neighborhood arehaving similar attributes. Texture is also described in terms of micro-primitives (textons) and their statistical placement rules. The goal of textons is to describe complex structures with simpler primitives. The texton co-occurrence matrices (TCM) [1] and multi-texton histogram (MTH) [2] can describe the spatial correlation of textons, for an image retrieval. This paper proposes an efficient mechanism for generation of texton features and extraction of low level features from textons. The present paper integrates the color, texture and shape features using textons and derives a complete texton matrix (CTM) and CCTM to describe image features for a precise texture classification. This method can express the spatial correlation of textons and has the discrimination power of texture, color, and shape features. Color and texture have a close relationship via fundamental micro-structures in natural images.
The rest of this paper is organized as follows. In Section 2, the TCM and MTH are introduced. The proposed CTM and CCTM are presented in the Section 3. In Section 4, results, discussions and performance comparisons with other methods is carried out under various natural databases. Section 5 concludes the paper.
-
II. Brief Description About TCM and MTH
In this section, We briefly review, texton cooccurrence matrix (TCM) [1] and Multi texton histogram (MTH) [2] methods.
-
A. The texton co-occurrence matrix (TCM)
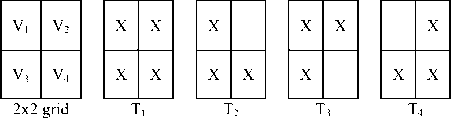
In TCM the original color image is quantized in to 256 colors in RGB color space. TCM can represent the spatial correlation of textons, and it can discriminate color, texture and shape features simultaneously. The four pixels of 2x2 grid are denoted as V 1 , V 2 , V 3 and V 4 .The TCM approach used five texton categories T 1 , T 2 , T 3 , T 4 and T 5 on a 2x2 grid in an overlapped manner as shown in Fig.1. The five types of textons are identified if and only if three or all four pixels of the 2x2 grid are identical. The pixels with identical values of a texton category remain unchanged and the rest of the pixels are assigned to zero.
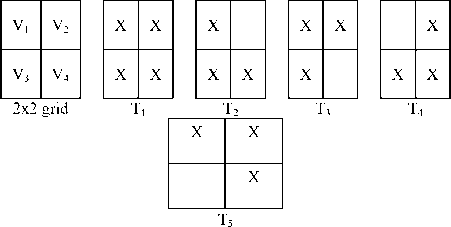
Fig.1. The five types of textons used in TCM.
Textons are detected in TCM, by moving the 2x2 grid from left-to-right and top-to-bottom on the entire image with one pixel as step length (overlapped manner). Thus the TCM generates, five components of texton image as shown in Fig.1. The final texton image in TCM is derived by combining/fusing all five types of texton images (T 1 ,T 2 ,T 2 ,T 4 and T 5 ) together (FIG.2). The TCM approach constructed a co-occurrence matrix on final texton image and utilized energy, contrast, entropy and homogeneity parameters to describe image features for image retrieval.
|
14 |
10 |
15 |
16 |
9 |
9 |
|
22 |
22 |
12 |
16 |
20 |
20 |
|
7 |
8 |
14 |
14 |
15 |
15 |
|
10 |
12 |
14 |
2 |
15 |
15 |
|
0 |
7 |
18 |
18 |
16 |
2 |
|
7 |
7 |
2 |
4 |
4 |
16 |
(a) Grey level values of raw image
|
0 |
0 |
0 |
0 |
0 |
0 |
|
0 |
0 |
0 |
0 |
0 |
0 |
|
0 |
0 |
0 |
0 |
15 |
15 |
|
0 |
0 |
0 |
0 |
15 |
15 |
|
0 |
0 |
0 |
0 |
0 |
0 |
|
0 |
0 |
0 |
0 |
0 |
0 |
(b) Texton type T 1 identification
|
0 |
0 |
0 |
0 |
0 |
0 |
|
0 |
0 |
0 |
0 |
0 |
0 |
|
0 |
0 |
0 |
0 |
15 |
0 |
|
0 |
0 |
0 |
0 |
15 |
15 |
|
0 |
0 |
0 |
0 |
0 |
0 |
|
0 |
0 |
0 |
0 |
0 |
0 |
(c) Texton type T2 identification
|
0 |
0 |
0 |
0 |
0 |
0 |
|
0 |
0 |
0 |
0 |
0 |
0 |
|
0 |
0 |
14 |
14 |
15 |
15 |
|
0 |
0 |
14 |
0 |
15 |
0 |
|
0 |
0 |
0 |
0 |
0 |
0 |
|
0 |
0 |
0 |
0 |
0 |
0 |
(d) Texton type T3 identification
|
0 |
0 |
0 |
0 |
0 |
0 |
|
0 |
0 |
0 |
0 |
0 |
0 |
|
0 |
0 |
0 |
0 |
0 |
15 |
|
0 |
0 |
0 |
0 |
15 |
15 |
|
0 |
7 |
0 |
0 |
0 |
0 |
|
7 |
7 |
0 |
0 |
0 |
0 |
(e) Texton type T 4 identification
|
0 |
0 |
0 |
0 |
0 |
0 |
|
0 |
0 |
0 |
0 |
0 |
0 |
|
0 |
0 |
0 |
0 |
15 |
15 |
|
0 |
0 |
0 |
0 |
0 |
15 |
|
0 |
0 |
0 |
0 |
0 |
0 |
|
0 |
0 |
0 |
0 |
0 |
0 |
(f) Texton type T 5 identification
|
0 |
0 |
0 |
0 |
0 |
0 |
|
0 |
0 |
0 |
0 |
0 |
0 |
|
0 |
0 |
14 |
14 |
15 |
15 |
|
0 |
0 |
14 |
0 |
15 |
15 |
|
0 |
7 |
0 |
0 |
0 |
0 |
|
7 |
7 |
0 |
0 |
0 |
0 |
(g) Final texton image in TCM
Fig.2. The frame work for texton detection in TCM: raw image (Fig. 2(a)); detection of texton categories T 1 ,T 2 ,T 3 ,T 4 ,T 5 ( Fig. 2 (b) to 2(f)) ;
final texton image (Fig. 2 (g)).
-
B. Texton detection in multi texton histogram (MTH)
In MTH approach the RGB color space is quantized in to 64 colors. The MTH framework identified four types of textons T6, T7, T8 and T9 on a 2x2 grid and they are shown in Fig.3. The common property of these four textons types are they consist of two identical pixels in the 2x2 grid.
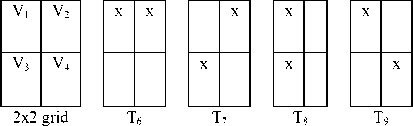
Fig.3. The four types of textons used on MTH.
The textons are detected in the MTH approach by moving (non-overlapped manner) the 2x2 grid from left-to-right and top-to-bottom with step length of 2 pixels on entire image. In MTH, the pixel values in the 2x2 grid are un-changed if any of the textontype (T 6 ,T 7 ,T 8 and T 9 ) is detected. If no texton type is identified, all the pixels of 2 x 2 grid are assigned to a value zero. The working mechanism of texton detection in MTH is shown in Fig.4.
|
14 |
10 |
15 |
16 |
9 |
9 |
|
22 |
22 |
12 |
16 |
20 |
20 |
|
7 |
8 |
14 |
14 |
15 |
15 |
|
10 |
12 |
14 |
2 |
15 |
15 |
|
0 |
7 |
18 |
18 |
16 |
2 |
|
7 |
7 |
2 |
4 |
4 |
16 |
|
T 6 |
||
|
T 6/ T 7 |
T 7 /T 9 |
|
|
T 7 |
T 6 |
T 9 |
(a) Raw image grey level values (b) Texton type and identification
|
0 |
0 |
0 |
0 |
9 |
9 |
|
0 |
0 |
0 |
0 |
20 |
20 |
|
0 |
0 |
14 |
14 |
15 |
15 |
|
0 |
0 |
14 |
2 |
15 |
15 |
|
0 |
7 |
18 |
18 |
16 |
2 |
|
7 |
7 |
2 |
4 |
4 |
16 |
(c) Final Texton image in MTH
Fig.4. The texton detection mechanism of MTH.
-
III. Complete Texton Matrix (CTM) Approach
The basic unit of an image is the pixel and its associated value that represents a color component or a gray level value. The algorithms based on pixel level have not shown better results on image analysis. A pattern is generally formed based on some similarities that exist between adjacent pixels. The value of a pixel is also influenced by the surrounding pixel values on which the definition of texton is based. The image attributes has a very close relationship with textons.
The proposed CTM method derived features from color images by quantizing the color images into 256 colors. The color gradient is evaluated from RGB vector space. After this, to describe image features the statistical information of textons are computed. A small element size, such as 2 x 2 grid is considered for texton representation by most of the scholars in the literature for texture classification, image retrieval etc... This 2 x 2 representation enhances texture discrimination power because the texton gradients appear only at texture boundaries. Textons are defined as a set of blobs or emerging patterns that share a common property all over the image. If the textons of an image consists of several pixels (large textons) and the scale of the textons is large a coarse texture may result. An obvious shape may result if the textons in the image are large and consists of few texton categories.
|
X |
|
|
X |
|
X |
X |
T 10 T 11
|
14 |
10 |
15 |
16 |
9 |
9 |
|
22 |
22 |
12 |
16 |
20 |
20 |
|
7 |
8 |
14 |
14 |
15 |
15 |
|
10 |
12 |
14 |
2 |
15 |
15 |
|
0 |
7 |
18 |
18 |
16 |
2 |
|
7 |
7 |
2 |
4 |
4 |
16 |
|
T 11 |
T 10 |
T 6 /T 11 |
|
T 3 |
T 1 |
|
|
T 4 |
T 6 |
T 9 |
-
(a) Original Image (b) Texton identification
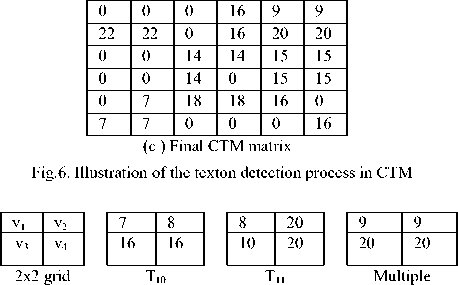
Fig.5. The defined texton types {T1,T11 }of CTM on a 2x2 grid..
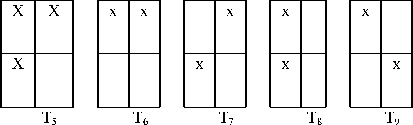
The proposed CTM approach defined all possible types of texton templates, i.e. 11 texton templates, on 2 x 2 grid and out of these, the texton types (T1, T2, T3, T4, T5) are exactly similar to the TCM and the texton types (T 6 , T7, T8 and T9) are exactly similar to that of MTH model. The texton types T 10 and T 11 are shown in Fig.5. The texton type T 1 is formed if all the four pixel values of the 2x2 grid are same. The next four special type of textons T 2 ,T 3 ,T 4 ,T 5 are formed if three pixel values are identical in a 2 x 2 grid and the remaining six special types of textons T 6 ,T 7 ,T 8 ,T 9 ,T 10 and T 11 are defined when two pixels have identical values.
(a)
(b)
(c )
textons T 1 and T10 (d)
Fig.7. The texton types with two identical pixels that are not part of MTH.
To detect the texton, we move (non-overlapped manner) the 2x2 grid from left-to-right and top-to-bottom with 2 pixels as the step length, on entire image. In each grid, we detect whether the type of texton is present or not. If a type of texton is present, the pixels of texton type of the 2x2 grid are kept in original values, others are assigned to zero. If two or more types of textons are present in the same 2x2 grid, then texton type with more number of identical pixels is considered. The working mechanism of the proposed CTM is shown in Fig.6. The CTM is a 2-dimensional array, where a row represents the pixel value and the column represents the texton type. The CTM (p,Tn)=k denotes the texton type Tn with grey level value p is appeared in the original image k times. In this paper Tn ranges from 1 to 11 and p ranges from 0 to 255. The dimension of basic CTM is 256 x 11. The CTM descriptor provides rich information and provides high indexing capabilities than MTH and TCM, since the CTM provides the additional indexing i.e.,texton type associated with the grey level value. In the literature the relationship between the values of neighboring pixels is well characterized by co-occurrence matrix, however, the dimensionality is the major problem and thus the performance can be decreased. The histogram based methods are simple to implement, have high indexing performance and however, they ignore spatial information. The computation process of CTM is simple when compared to the methods that are based on GLCM. The eleven texton types used in the CTM descriptor provides richer information than those in TCM[1] and MTH[2], because the proposed CTM descriptor considered the co-occurring probability of two, three and four similar valued pixels instead of only three and four similar valued pixels as in TCM and only few two similar valued pixels as in the case of MTH. The proposed CTM descriptor and MTH are faster than TCM in detecting textons, because in TCM the textons are detected in a 2x2 grid throughout the image with one pixel as step length (overlapped manner). Further the detected textons in a neighborhood may overlap in TCM. The formation of final texton image in TCM is a time consuming process because of fusing operation of texture types. The step length in the CTM descriptor is set to two pixels to reduce this computation cost. High dimensionality is one of the major issues of the existing methods that are based on GLCM [15].One cannot represent the discrimination power of color, texture and shape totally by using few feature vectors (energy, homogeneity, contrast, entropy etc) of GLCM[15],as in the case of TCM [1] and others.The MTH does not identify all texton types with two identical pixels and it does not have a provision to recognize multiple texton types on a 2x2 grid as shown in Fig.7.
The MTH assigns a value zero to all pixels of 2x2 grid when the texton types with two identical pixels T 10 and T 11 of CTM are identified. This is because the MTH is not defined overT 10 and T 11 .Multiple texton types can be formed with two identical pixels on a 2 x 2 grid as shown in Fig.3 which are not properly identified in MTH. Further if three or more pixels have same value in the 2x2 grid, MTH results an ambiguity in representing the texton type as shown in Fig. 8. The MTH approach can recognize the 2 x 2 grid of Fig.5 as T 6 or T 9 .
|
75 |
75 |
|
25 |
75 |
2x2 grid
|
75 |
75 |
|
25 |
75 |
|
75 |
75 |
|
25 |
75 |
|
75 |
75 |
|
25 |
75 |
Texton type T 5 Texton type Texton type in TCM &CTM T 6 MTH T 9 in MTH
Fig.8. Ambiguity in identifying texton types in MTH.
The CTM overcomes this, by defining all possible textons with, three and four identical pixels. The CTM initially identifies the texton type with four identical pixels, if it is not found then it identifies the texton type with three identical pixels, and it identifies the texton with 2 identical pixels.
To reduce the dimensionality of CTM, the present paper quantized the complete texton matrix (CTM) and derived compact CTM (CCTM). The CCTM partitioned the gray levels of the image into n-groups and computes histogram of each texton type of that group. The CCTM divided the grey levels of image into j groups {j0, j 1, ^.,jn- 1 }. Each group consists of set of grey levels {g0,g 1 ,^,gm- 1 }. The CCTM g (j,T n ) = z represents , the texton type T n appeared in the group j, z times i.e., the texton type T n appeared with grey level values ranging from (Jxg m ) to ( (J+1)Xg m ) -1) is appeared in the image z times. The dimension of the CCTM is ((N/g m ) x Tn). Where N is the number of gray levels in the image and Tnis the number of texton types considered, in our case it is 11. The histogramfeatures from CTM and CCTM are given to machine learning classifiers like Liblinear, LibSVM and Naivebayes.
-
IV. Experimental Results and Discussions
The present descriptor is evaluated against five other published state-of-art representative of LBP schemes such as uniform LBP(ULBP)[26], the LTP [11] descriptors, CLBP-SMC [37], TCM [1] and MTH[2]. The effectiveness of the proposed and other methods are investigated based on a series of experiments on three representative texture databases: Brodtaz[38], Outex [39]
and UIUC[40]. The Brodtaz database consists of gray level images and the other databases contain color images (mostly in RGB). The images of these databases are captured under varying lighting, illumination and other conditions with varying sizes. Each database consists of various classes and each class consists of various images.
We selected 30 different texture images with a 512x512 pixels size from the Brodtaz database. The sample images are show in Fig.9. We divided each image into 16 non-overlapped texture images of size 128x128 and this results a dataset of 480 images (30x16). The present study used 60 images for training purpose (two images from each class). The remaining 420 texture images (14 texture image per class) are used for testing purpose.
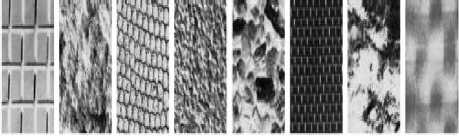
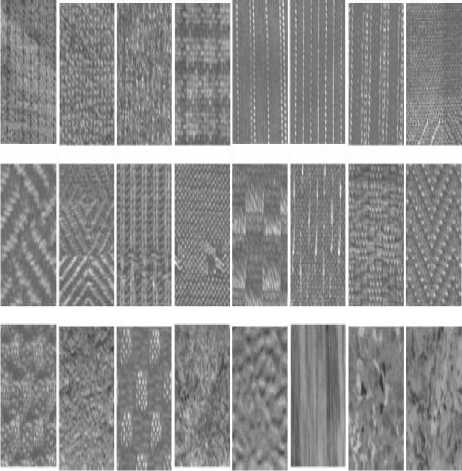
Fig.10. The sample images of 24 classes from Outex database.
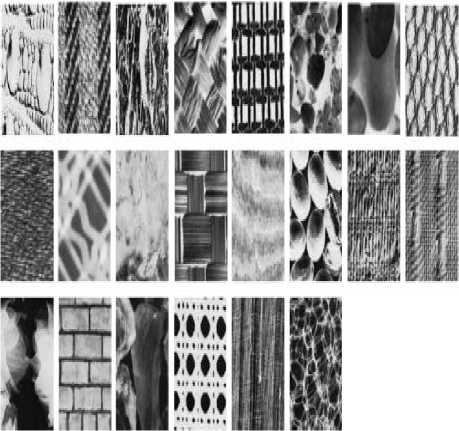
Fig.9. Samples of 30 classes randomly selected from the Brodatz database.
The Outex database contains two test suits: Outex-TC-10(TC12-000) and Outex-TC-12(TC12-001). There are 24 classes of texture images in both TC10 and TC12. These images are captured under three illumination conditions namely 1. “inca’ 2. t184 3. Horizon with nine rotation angles i.e. 0o,5o,10o,15o,30o,45o,60o,75o,90o. The resolution of each image in TC10 and TC12 are 128x128 under each illumination condition and in each rotation angle, there are 20 images. The present paper considered the Outex images under illumination condition “inca” with 0o of rotation, for training purpose. The images with non-zero rotation angles with three illumination conditions are used for testing purpose. The sample images from Outex database are shown in Fig.10.
The sample images of UIUC database are shown in Fig.11. This database includes 25 classes and each class consists of 40 images resulting a total of 1000(25x40) texture images. The size of each image is 640x480. The present paper considered one texture image from each class and partitioned it into 15 non-overlapped images of size 128x128. This results a total of 375 (25x15) images and out of this 50 images (2 images from each class) are used for training purpose and reaming 325 images (25x13) are used for test purpose.
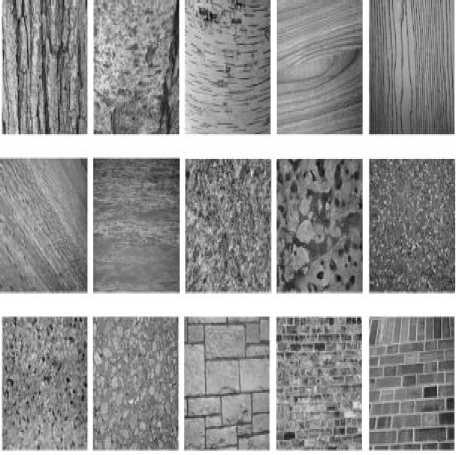
Fig.11. Samples of 25 classes from the UIUC database.
This paper experimented CCTM descriptor using grey level range 4, 8 and 16 i.e. each group consists of 4, 8 and 16 consecutive gray levels. The dimensions of CCTM 4, CCTM 8 and CCTM 16 are 64x11, 32x11 and 16x11 respectively.
The average classification rates of each texture database on the proposed CTM CCTM 4, CCTM 8 and CCTM 16 descriptors using Liblinear, LibSVM and Naivebaye’s are given in Table 1. The last row under each proposed method gives the average classification rate of the particular classifier on all databases considered . The Liblinear exhibited a high classification rate which is almost 2 % higher than SVM and 3% to 4% higher than Naivebayes on all databases. In the rest of the paper, the classification rates of Liblinear are mentioned on the proposed CTM and CCTM descriptors.
Table 1. Average classification rate of CTM and CCTM on different databases using different classifiers.
|
Proposed Methods |
Databases |
Liblinear |
LibSVM |
Naivebayes |
|
CTM |
Brodtaz |
91.56 |
89.84 |
87.62 |
|
Outex _TC10 |
96.1 |
93.12 |
91.56 |
|
|
Outex_TC12 |
90.76 |
89.56 |
88.57 |
|
|
UIUC |
91.18 |
91.42 |
86.92 |
|
|
Average |
92.4 |
90.99 |
88.67 |
|
|
CCTM 4 |
Brodtaz |
95.37 |
93.42 |
92.87 |
|
Outex _TC10 |
96.9 |
94.56 |
93.46 |
|
|
Outex_TC12 |
95.25 |
93.45 |
91.48 |
|
|
UIUC |
94.28 |
93.24 |
91.42 |
|
|
Avg |
95.45 |
93.67 |
92.31 |
|
|
CCTM 8 |
Brodtaz |
96.54 |
95.24 |
93.12 |
|
Outex _TC10 |
97.8 |
95.47 |
93.45 |
|
|
Outex_TC12 |
96.65 |
94.15 |
92.83 |
|
|
UIUC |
95.72 |
94.24 |
92.74 |
|
|
Avg |
96.68 |
94.78 |
93.04 |
|
|
CCTM 16 |
Brodtaz |
90.72 |
88.14 |
87.64 |
|
Outex _TC10 |
95.2 |
93.12 |
90.45 |
|
|
Outex_TC12 |
90.31 |
88.98 |
86.86 |
|
|
UIUC |
90.56 |
90.14 |
87.12 |
|
|
Avg |
91.69 |
90.09 |
88.01 |
Table 2 represents the classification rates of different methods on Brodtaz, database. The CTM, CCTM 4 , CCTM 8 and CCTM 16 descriptors outperform all the other techniques and shows large improvement than ULBP and LTP descriptors. However the CLBP-SMC, TCM, MTH descriptors have shown improved classification rate on Brodtaz textures. The CCTM4and CCTM8 displayed higher classification results than CTM and CCTM16. The CTM and CCTM4have almost improved the classification performance of about 4% and 9% respectively when compared to TCM and MTH approach.
In Table 3, we can see classification results of Outex database. The performances of ULBP and LTP descriptors have shown improvement on this database when compared to Brodtaz texture database. The classification accuracy for TC_10 is significantly higher than that for TC12, because the training and testing images are under the same illumination. The Table 2 clearly exhibits the superiority of proposed methods over considered existing methods. However CCTM4and CCTM8exhibited high performance when compared to other descriptors and even including CTM and CCTM16. The proposed descriptors CTM, CCTM4 and CCTM8 has shown almost 2% to 3% of high classification rate when compared to LTP, CLBP-SMC, TCM and MTH descriptors on Outex database.
The classification accuracy over the UIUC database on the proposed and existing descriptors is shown in Table 4. The classification rate is very poor for ULBP and LTP descriptors and moderate for CLBP-SMC [37], TCM [1] and MTH [2] this may be due to lot of orientation and scale changes in UIUC database however the proposed descriptors achieved high classification rate, this clearly indicates the CTM and its variants are more robust to orientation and scale changes. The CTM, CCTM 4 and CCTM 8 descriptors have achieved 4%, 7% and 8% of high classification rates on UIUC database when compared to CLBP-SMC, TCM and MTH approaches. This is because the proposed methods integrated the merits of TCM and MTH and derived additional textons to capture more spatial information to increase the classification accuracy.
Table 2. The classification accuracy on the Brodatz database using different descriptors.
|
Methods |
Classification rate |
|
ULBP[26] |
40.28 |
|
LTP[11] |
57.50 |
|
CLBP_SMC[37] |
85.23 |
|
TCM [1] |
86.57 |
|
MTH[2] |
87.25 |
|
CTM |
91.56 |
|
CCTM 4 |
95.37 |
|
CCTM 8 |
96.54 |
|
CCTM 16 |
90.72 |
Table 3. The classification accuracy on the Outex database using different methods.
|
Methods |
TC10 |
TC12 |
|
|
“t” |
“h” |
||
|
ULBP[26] |
84.87 |
65.19 |
64.03 |
|
LTP[11] |
94.14 |
75.88 |
73.96 |
|
CLBP_SMC[37] |
96.56 |
90.30 |
92.29 |
|
TCM [1] |
94.22 |
90.68 |
92.65 |
|
MTH[2] |
93.56 |
89.8 |
91.87 |
|
CTM |
96.1 |
90.10 |
91.42 |
|
CCTM 4 |
96.9 |
94.82 |
95.68 |
|
CCTM 8 |
97.8 |
96.42 |
96.88 |
|
CCTM 16 |
95.2 |
89.91 |
90.72 |
Table 4. The classification accuracy on the UIUC database using different methods.
|
Methods |
Classification rate |
|
ULBP[26] |
54.65 |
|
LTP[11] |
67.16 |
|
CLBP_SMC[37] |
87.64 |
|
TCM [1] |
85.70 |
|
MTH[2] |
87.83 |
|
CTM |
91.18 |
|
CCTM 4 |
94.28 |
|
CCTM 8 |
95.72 |
|
CCTM 16 |
90.56 |
Proposed and existing methods е Brodtaz • TC10 • TC12
• TC12 • UIUC
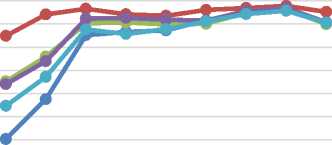
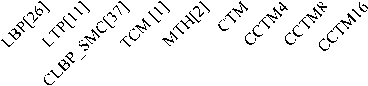
Fig.12. Performance comparison of proposed method and existing methods on considered databases.
The ULBP and LTP showed the low classification results when compared to other descriptors because it is unable to capture magnitude information. The coarse quantization of the images limits the performance of nontexton based methods. The CTM and its variants show more robustness to monotonic illumination changes due to gradients approach.
The classification rate on all four databases using the proposed and other descriptors is plotted in Fig.12 and following are noted.
-
1. The performance of ULBP and LTP are too low on Brodtaz textures when compared to other three texture databases. Out of these two, ULBP has shown low performance.
-
2. The classification rate of all descriptors are little low on Brodtaz textures around 85% to 90%, however the CCTM 4 and CCTM 8 have achieved a classification rate around 95%.
-
3. The performance of all descriptors is high on Outex database when compared to Brodtaz and UIUC databases.
-
4. The performance of CCTM 8 is very high on all databases followed by CCTM 4 , CTM and CCTM 16 and followed by other descriptors MTH, CLBP-SMC, TCM, LTP and ULBP.
-
V. Conclusion
We proposed two descriptors namely complete texton matrix (CTM) and compact CTM (CCTM), to describe image features that represent both the spatial correlation of texture orientation and texture color based on textons for efficient texture classification. The present paper derived CCTM 4 , CCTM 8 and CCTM 16 with different values of grey level range g=4,8 and 12, to test the efficacy of the proposed compact CTM. The dimension of CTM,CCTM 4 , CCTM 8 and CCTM 16 is 256 x 11, 64 x 11, 32 x 11 and 16 x11 respectively. The CCTM 4 and CCTM 8 descriptors achieved an average of 2% higher classification rate when compared CTM with low dimensionality. The proposed descriptors considered all texton types on a 2 x 2 grid and they are very easy to implement and well suited for large-scale image dataset retrieval. The experiments were conducted on Brodtaz, Outex and UIUC natural images and the experimental results validated that our methods has strong discrimination power of color, texture and shape features, and outperforms other LBP based methods.
References Texture Classification Using Complete Texton Matrix
- Guang-Hai Liu, Jing-Yu Yang, Image retrieval based on the texton co-occurrence matrix, Pattern Recognition 41 (2008) 3521 – 3527.
- Guang-Hai Liu a, LeiZhang b, Ying-KunHou d, Zuo-YongLi c, Jing-YuYang, Image retrieval based on multi-texton histogram, Pattern Recognition, 43(2010),2380–2389.
- V.Vijaya Kumar, A. Srinivasa Rao, YK Sundara Krishna, “Dual Transition Uniform LBP Matrix for Efficient Image Retrieval”, I.J. Image, Graphics and Signal Processing (IJIGSP), Vol. 8, 2015, pp: 50-57.
- H. Marko, M. Pietikäinen, and C. Schmid, “Description of interest regions with center-symmetric local binary patterns,” in Proc. Comput. Vis., Graph. Image Process., vol. 4338. 2006, pp. 58–69.
- Pullela R Kumar, V. Vijaya Kumar, Rampay.Venkatarao, “Age classification based on integrated approach”. International Journal Of Image, Graphics And Signal Processing (IJIGSP), Vol. 6, Iss.7, 2014, pp. 50-57.
- V. Vijaya Kumar, Jangala. SasiKiran , V.V. HariChandana, “An effective age classification using topological features based on compressed and reduced grey level model of the facial skin”, International journal of image, graphics and signal processing (IJIGSP), , Vol.6, Iss.1, 2013, pp.9-17.
- Mohd.AbdulMuqeet, RaghunathS.Holambe, Enhancing Face Recognition Performance using Triplet Half Band Wavelet Filter Bank, I.J. Image, Graphics and Signal Processing, 2016, 12, 62-70.
- G S Murty ,J SasiKiran , V.Vijaya Kumar, “Facial expression recognition based on features derived from the distinct LBP and GLCM”, International Journal of Image, Graphics And Signal Processing (IJIGSP), Vol.2, Iss.1, pp. 68-77,2014.
- K. Srinivasa Reddy, V.Vijaya Kumar, B.Eshwarareddy, “Face Recognition based on Texture Features using Local Ternary Patterns”, I.J. Image, Graphics and Signal Processing (IJIGSP), Vol.10, 2015, pp: 37-46.
- G. SatyanarayanaMurth, J.SasiKiran, V. Vijaya Kumar, “ Facial expression recognition based on features derived from the distinct LBP and GLCM, I.J. Image, Graphics and Signal Processing (IJIGSP), Vol. 2, 2014, pp: 68-77.
- X. Tan and B. Triggs, “Enhanced local texture feature sets for facerecognition under difficult lighting conditions,” IEEE Trans. ImageProcess., vol. 19, no. 6, pp. 1635–1650, Jun. 2010.
- M. Srinivasa Rao , V.Vijaya Kumar, Mhm Krishna Prasad, “Texture Classification based on First Order Local Ternary Direction Patterns”, I.J. Image, Graphics and Signal Processing (IJIGSP), 2017, 2, 46-54.
- Z. Guo, L. Zhang, and D. Zhang, “Rotation invariant texture classificationusing LBP variance (LBPV) with global matching,” Pattern Recognit., vol. 43, no. 3, pp. 706–719, 2010.
- G. Zhao, T. Ahonen, J. Matas, and M. Pietikäinen, “Rotationinvariantimage and video description with local binary pattern features,” IEEE Trans. Image Process., vol. 21, no. 4, pp. 1465–1477, Apr. 2012.
- R. M. Haralick, K. Shanmugam, and I. Dinstein, “Textural features forimage classification,” IEEE Trans. Syst., Man, Cybern., vol. SMC-3, no. 6, pp. 610–621, Nov. 1973
- G. Cross, A. Jain, Markov random field texture models, IEEE Trans. Pattern Anal. Mach. Intell. 5 (1) (1983) 25–39.
- J. Mao, A. Jain, Texture classification and segmentation using multi-resolution simultaneous autoregressive models, Pattern Recognition 25 (2) (1992) 173–188.
- F. Liu, R. Picard, Periodicity, directionality, and randomness: wold features for image modeling and retrieval, IEEE Trans. Pattern Anal. Mach. Intell. 18 (7) (1996) 722–733.
- B.S. Manjunath, W.Y. Ma, Texture features for browsing and retrieval of image data, IEEE Trans. Pattern Anal. Mach. Intell. 18 (8) (1996) 837–842.
- J. Han, K.-K. Ma, Rotation-invariant and scale-invariant Gabor features for texture image retrieval, Image Vision Comput. 25 (2007) 1474–1481
- T. Chang, C.C. Jay Kuo, Texture analysis and classification with tree-structured wavelet transform, IEEE Trans. Image Process. 2 (4) (1993) 429–441.
- Laine, J. Fan, Texture classification by wavelet packet signatures, IEEE Trans. Pattern Anal. Mach. Intell. 11 (15) (1993) 1186–1191.
- D.-C. He and L. Wang, “Texture unit, texture spectrum, and texture analysis,” IEEE Trans. Geosci. Remote Sens., vol. 28, no. 4, pp. 509–512, Jul. 1990
- T. Ojala, M. Pietikäinen, and D. Harwood, “Performance evaluation oftexture measures with classification based on Kullbackdiscrimination ofdistributions,” in Proc. 12th IAPR Int. Conf. Pattern Recognit., vol. 1.Oct. 1994, pp. 582–585.
- T. Ojala, M. Pietikäinen, and T. Mäenpää, 2002, “Multi-resolution gray-scale and rotation invariant texture classification with local binary patterns,” IEEE Trans. Pattern Anal. Mach. Intell., vol. 24, no. 7, pp. 971–987.
- R. L. Kashyap and A. Khotanzad, 1986, “A model-based method for rotation invariant texture classification,” IEEE Trans. Pattern Anal. Mach. Intell., vol. 8, no. 4, pp. 472–481,
- Julesz B (1981): Textons, the elements of texture perception, and their interactions. Nature 290:91-97.
- Eswara Reddy, P.ChandraSekhar Reddy, V.Vijaya Kumar, 2012 “Texton based shape features on local binary pattern for age classification”, International journal of image, graphics and signal processing (IJIGSP), Vol. 7, No.4, pp.54-60.
- Beck J, Prazdny K, Rosenfeld A (1983): A theory of textural segmentation. In: Human and Machine Vision, Beck J, Hope B, Rosenfeld A, eds. New York: Academic Press, pp. 1-38
- J. Malik, S. Belongie, J. Shi and T. Leung, “Textons, Contours and Regions: Cue Integration in Image Segmentation,” Proc. of Seventh International Conference on Computer Vision, Kerkyra, Greece, Sept 20-27, 1999, pp. 918-925.
- M Varma, A Zisserman, in Proceedings of the 7th European Conference on Computer Vision, Copenhagen, Denmark. Computer Vision, 3. Classifying images of materials: Achieving viewpoint and illumination independence (SpringerBerlin, 2002), pp. 255–271.
- U Ravi Babu,V Vijay Kumar,B. Sujatha, “Texture classification based on texton features”, International Journal Of Image, Graphics and Signal Processing (IJIGSP), Vol.4, Iss.8, 2012, pp.36-42, ISSN: 2074-9074.
- M. Varma and A. Zisserman, 2009, “A statistical approach to material classification using image patch exemplars,” IEEE Trans. Pattern Anal. Mach. Intell., vol. 31, no. 11, pp. 2032–2047.
- M. Varma, and A. Zisserman, 2005, “A statistical approach to texture classification from single images,” International Journal of Computer Vision, vol. 62, no. 1-2, pp. 61-81.
- P. Kiran Kumar Reddy, B. Eswar Reddy, V Vijay Kumar, “Wavelet based texton cross and diagonal shape descriptor for discrimination of textures”, International Journal of Digital Signal and Image Processing (IJDSIP). Vol. 2, Issue 3, 2014, pp: 11-26, ISSN : 2347-4521
- M.Joseph Prakash, Saka.Kezia, Dr.I.SantiPrabha, Dr.V.Vijaya Kumar, “A New Approach for Texture Segmentation using Gray Level Textons” , International Journal of Signal and Image Processing (IJSIP), Vol. 6, Iss. 3, 2013, pp:81-89, ISSN: 2005-4254
- Z. Guo, L. Zhang, and D. Zhang, “A completed modeling of local binary pattern operator for texture classification,” IEEE Trans. Image Process., vol. 9, no. 16, pp. 1657–1663, Jun. 2010
- http://www.ux.uis.no/tranden/brodatz.htmlS.
- http://www.outex.oulu.fi/index.php?page=image_databaseS.
- Svetlana Lazebnik, CordeliaSchmid and Jean Ponce. A Sparse Texture Representation Using Local Affine regions. IEEE Transactions on Pattern Analysis and Machine Intellignece, Vol.27, No.8, pp:1265-1278, August, 2005.
