Texture Features based Blur Classification in Barcode Images

Author: Shamik Tiwari, Vidya Prasad Shukla, Sangappa Biradar, Ajay Singh
Journal: International Journal of Information Engineering and Electronic Business(IJIEEB) @ijieeb
Article in issue: 5 vol.5, 2013.
Free access
Blur is an undesirable phenomenon which appears as image degradation. Blur classification is extremely desirable before application of any blur parameters estimation approach in case of blind restoration of barcode image. A novel approach to classify blur in motion, defocus, and co-existence of both blur categories is presented in this paper. The key idea involves statistical features extraction of blur pattern in frequency domain and designing of blur classification system with feed forward neural network.
Blur, Motion, Defocus, Texture feature, Neural Network, Pattern Classification
Short address: https://sciup.org/15013210
IDR: 15013210
Text of the scientific article Texture Features based Blur Classification in Barcode Images
Published Online November 2013 in MECS DOI: 10.5815/ijieeb.2013.05.05
Bar codes are being extensively used for commercial purposes [1]. It can be seen that unique 1-D or 2-D barcodes are essential part of product description for recognition. Barcodes encode a series of characters or symbols to hold explicit information and provide a key in database. Product description such as its benefits, contents and cost can be easily accessed by barcode. Customer can acquire details about a product in a superstore, while travelling or at home. Consumer can retrieve the product information by first decoding the product’s barcode with a scanning device, and then communicating this information to product server. These days, the user-friendliness of cell phones with digital camera facility gives a portable way for decoding barcode without use of the traditional laser scanner which has lack of portability. Camera phones can take an image of the barcode and after that it can transfer decoded information to a consumer product server to access product description [2]. Despite the fact that camera phone provides a mobile platform, applying a camera phone in this application is not an easy task due to geometric distortion, noise, and blurring in image at the time of image acquisition. Image blurring [3] is often an issue that affects the performance of a bar code identification system.
There are mainly two kinds of blurring [4]: one is motion blur, which is occurred due to the relative motion among image acquisition device and object at the instance of image capturing. The other is defocus blur, which is due to the inaccurate focal length adjustment when capturing photos. Blurring induces the degradation of image quality. There are two approaches of deblurring; one is blind and other nonblind deconvolution. For blind restoration of barcode images it is required to estimate blur parameters for deblurring. Before application of any blur parameters estimation approach automatic blur classification is highly enviable. That is to judge what type of blur is available in the captured image.
Harr wavelet transform has the capability to discriminate different types of edges. Tong et al. [5] presented a method that applies Haar wavelet transform to estimate sharpness factor of the image and after that revealed whether this image is sharp or blurred and then in case blurred image, they measured strength of blur. Yang et al. [6] addressed the motion blur detection scheme using support vector machine to classify the digital image as blurred or sharp. Aizenberg et al. [7] presented a work that identifies blur type, estimates blur parameters and perform image restoration using neural network. They considered four kinds of blur namely rectangular, motion, defocus, and Gaussian as a pattern classification problem. Bolan et al. [8] proposed an image blurred region detection and classification method which can automatically detect blurred image regions and classifies the blur types without either image deblurring or kernel estimation. They developed a new blur metric using singular value feature to detect the blurred regions of an image and also analyze the alpha channel information and classify the blur type of the blurred image regions into defocus blur or motion blur, respectively.
Methods which are dependent on correct identification of the edges suffer with two problems. First, Edge detection involves using a threshold value to decide if a given pixel is blurred or not. Choosing incorrect threshold values will result in poor edge detection resulting in an incorrect blur decision. Second, in presence of noise edge detection algorithms give poor results. Liu et al. [9] presented a framework for partial blur detection and classification i.e. whether some portion of image is blurred as well as what types of blur arise in motion and defocus categories. They considered maximum saturation of color, gradient histogram span and spectrum details as blur features.
Statistical features have been extensively used in object classification. Papageorgiou et al. [10] used global statistical features for classification to detect the car objects. Zhang et al. [11] illustrated that image representation focused on local features distribution is successful for categorization of object and highly textured images. Arivazhagan et al. [12, 13] proposed a method based on classification of mosaic images. They applied Ridgelet and Curvelet transformation on image and then find statistical features of transformed images. Devendran et al. [14] discusses texture based scene classification problem using support vector machine and feed forward neural network. Shamik et al. [15] used statistical moments to classify noises using feed forward neural network. However, we have not found any application of texture features to feature extraction for blur classification. In this paper we extract statistical features of blur patterns in frequency domain and classified using feed forward neural network.
This paper is organized into nine sections including the present section. In section two to six, we discuss the theory of image degradation model, barcode segmentation, blur patterns, statistical features and feed forward neural network respectively. Section seven describes the methodology of blur classification scheme. Section eight discusses experimental results and in the final section nine, conclusion is discussed.
-
II. IMAGE DEGRADATION MODEL
The degradation process of an image can be modelled by the following convolution process as described in [3, 4]:
д ( X , у )=/( X , У )⊗ℎ( х , У )+ Л ( х , У ) (1)
Where д ( х ,у) is the degraded image, / ( X , У ) is the uncorrupted original image, ℎ( х , У ) is the point spread function that caused the degradation and Л ( х , у ) is the additive noise in spatial domain. In view of the fact that, convolution operations used in spatial domain is equivalent to the multiplication in frequency domain, so image degradation model is:
G ( и ,v)= F ( и ,V) Н ( и ,V)+ N ( и ,V) (2)
Motion blur occurs in an image because of relative motion between image capturing device and the scene. Let the image to be acquired has a relative motion to the capturing device by a regular velocity (vrelative) and makes an angle of α radians with the horizontal axis for the duration of the exposure interval [0,t exposure ], the distortion is one dimensional. Expressing motion length as L = vrelative ×texposure, the point spread function (PSF) for spatial domain can be modeled as [9, 10]:
The defocus blur also known as out of focus blur is appears due to a system of circular aperture. It can be modeled as a uniform disk as [11, 12]:
ℎ( x , У )=
{ nR2 ^ √ X2 + ^ ≤ " (4)
0 otherwise
Where R defines the radius of the disk.
Sometimes image contains co-existence of both blurs. In that case the blur model becomes:
ℎ( X , У )= a ( x , У ) ⊗ b ( x , У ) (5)
Where a ( x , у ), b ( x , у ) are point spread functions for motion and defocus blur respectively and ® is convolution operator. The degradation process model equations (1) and (2) can be expressed as (6) and (7) in frequency domain respectively:
g ( X , у )= f ( X , У )⊗ a ( x , У )⊗ b ( x , У )+ Л ( x , У ) (6)
G ( и ,v)= F ( и ,V) A ( и ,V) В ( и ,V)+ N ( и ,V) (7)
-
III. BARCODE SEGMENTATION
The initial step is localization of barcode area in camera based document image. To crop barcode from image we must find two points corresponding to the top-left and bottom-right corner of the barcode area. In literature, a variety of approaches available for localization of 1-D or 2-D bar code by spatial domain investigation [25–29], with Gabor filter [30] and frequency domain examination [31-32]. A difference of gradient method is used for barcode segmentation. The principle behind this approach is that a 1-D barcode consists of vertical bars. Therefore, we may trace the barcode by finding area with high horizontal gradients and low vertical gradients. Based on this idea, following gradient difference operation has been applied to an image f ( X , у ):
I GX - Gy I (8)
Where G and G are absolute values of gradient in x and y direction. Sobel operator is applied to calculate gradient because it smoothes the input image by a superior amount and more robustness to noise due larger convolution mask. The Sobel operator [33] computes the gradient by using the discrete differences between the rows and columns of 3x3 neighborhoods using convolution mask as given in Fig.1.
ℎ(X,У)= f "l ^ √X2 + у2 ≤ ~ and —=-tana
0 otherwise
|
-1 |
0 |
+1 |
|
-2 |
0 |
+2 |
|
-1 |
0 |
+1 |
|
+1 |
+2 |
+1 |
|
0 |
0 |
0 |
|
-1 |
-2 |
-1 |
Gx
Gy
Figure.1: Sobel convolution masks
So the gradient is computed by the following equations where Z’s are the intensities arranged as in Fig.2.
Gx = ( Z 7 + 2 Z 8 + Z 9)–( Z 1 + 2 Z 2 + Z 3) (9)
Gy = ( Z 3 + 2 Z 6+ Z 9)-( z 1+2 z 4+ z 7) (10)
|
Z1 |
Z2 |
Z3 |
|
Z4 |
Z5 |
Z6 |
|
Z7 |
Z8 |
Z9 |
Figure.2: Image neighborhood
Afterwards, we low-pass filtered the result to eliminate isolated edges and noise. The point where this operation is maximized is assumed to be located within the barcode. From this point, we move outwards to establish precise left and right bounds for the entire barcode. Fig.3 shows the original image captured using mobile camera phone and figure 4 is segmented image.
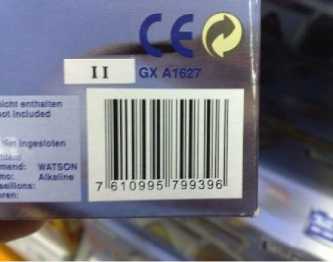
Figure.3: camera image containing barcode[34]
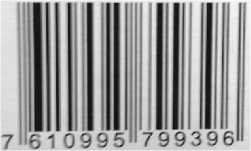
Figure.4: Segmented barcode image
-
IV. BLUR PATTERNS
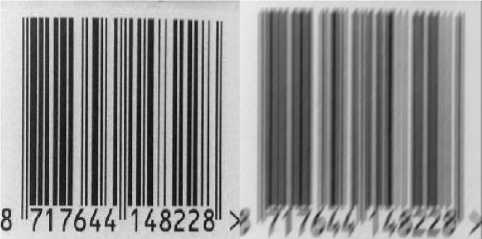
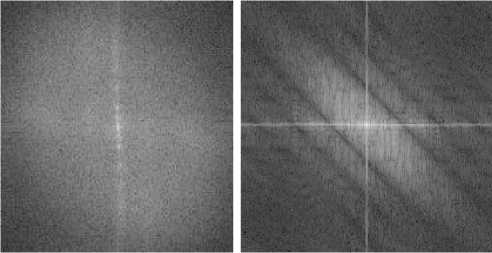
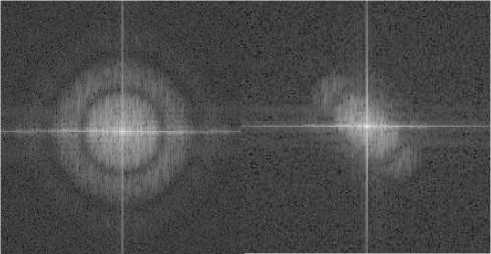
Blurring reduces significant features of image such as boundaries, shape, regions, objects etc., which creates problem for image analysis in spatial domain. The motion blur, defocus blur are appeared differently in frequency domain, and the blur categorization can be easily done using these patterns. If we convert the blurred image in frequency domain, it can be seen from frequency response of motion blurred image that the dominant parallel lines appear which are orthogonal to the motion orientation with near zero values [16, 17, 18 and 19]. In defocused blur one can see appearance of some circular zero crossing patterns [20, 21 and 22]. Fig.5 shows the effect of different blurs on the Fourier spectrum of original image. We can consider these patterns in frequency domain as image itself.
(a) (b)
(c) (d)
(e) (f)
Figure. 5: (a) Original barcode image [34] (b) Motion blurred image (c) Fourier spectrum of original image (d) Fourier spectrum of blurred image with motion length 10 pixels and motion orientation 450 (e) Fourier spectrum of blurred image with defocus blur of radius 5 (f) Fourier spectrum of image with coexistence of both blurs
-
V. FEATURES SET
Texture belongs to the surface and structure representation of an Image. Texture is a usual repetition of an element or pattern on a surface. Image textures are complex visual patterns consist of entities or regions with sub-patterns with the different characteristics such as intensity, color, shape, size, etc. An image region has a constant texture if a set of its characteristics are constant, slowly changing or approximately periodic.
Blurred images have specific patterns in frequency spectrum. Statistical methods examine [23, 24] the distribution by analyzing local features at all point and getting statistical measures from the distributions. Statistical functions such as mean, median, standard deviation and moments are most frequent to characterize data set, which have been used as pattern features in many applications. Central moments are one of the principal features used for describing the shape of a histogram. Higher moments can be used to classify the actual shape of the distribution function.
Let X i be a discrete random variable that represents gray level in an image and let р(Л / ), i = 0,1,......, L —
-
1, be the respective probability density function, where L is the number of available gray levels or intensities. A histogram is an estimation of the probability of occurrence of intensity values X j as measured by p (Aj ). Thus the central moment function is given by the equation:
Un = ^(Х1-тГр(Хд (11)
Where n is the order of moment.
Features extraction is done by computing the common descriptors based on statistical moments up to fourth order and in addition that uniformity and entropy also measured. So the combination of central moments and statistical moments is used as hybrid feature sets. The feature set consists of six features as follows.
Feature(1): Mean (m)- computes the average intensity. It is the standardized first central moment of the probability distribution in image.
m = T^A i p(A i ) (12)
Feature(2): Standard deviation(o)-computes the average contrast. It is the standardized second central moment of the probability distribution.
т = ^kW (13)
Feature(3): Smoothness (R)- computes the relative smoothness of the gray values in a region. R has 0 value for a area of constant intensity and tends to 1 for areas with large variation in the value of its gray levels.
R = 1 —1/(1 +ст2) (14)
Feature(4): Skewness(S) - computes the third moment, is a measure of symmetry of distribution. S gives 0 value for symmetric histograms about the mean otherwise gives either positive or negative value depending whether histogram has been skewed above or below the mean.
Рз =^(\ — т)3р(\)(15)
Feature(5): Uniformity (U) - is also known as energy. It gives a maximum value when all gray levels are equal probable and decreases from there.
и = T^P 2(XD(16)
Feature(6): Entropy (E) - A measure of randomness.
Thus six statistical features (12-17) are calculated for every image.
-
VI. FEEDFORWARD NEURAL NETWORK
A successful pattern recognition methodology [15] depends greatly on the particular choice of the classifier . a n artificial neural network is system which can be seen as an information-processing paradigm. ANN has been designed as generalizations of mathematical models identical to human cognition system. They are composed of interconnected processing units called neurons that work as a collective unit. It can be used to establish complex relationships among inputs and outputs by identifying patterns in data. The feed forward neural network refers to the neural network which contains a set of source nodes which forms the input layer, one or more than one hidden layers, and single output layer. In case of feed forward neural network input signals propagate in one direction only; from input to output. There is no feedback path i.e. the output of one layer does not influence same layer. One of the best known and widely acceptable learning algorithm in training of multilayer feed forward neural networks is Back-Propagation. The back propagation is a type of supervised learning algorithm, which means that it receives sample of the inputs and associated outputs to train the network, and then the error (difference between real and expected results) is calculated. The idea of the back propagation algorithm is to minimize this error, until the neural network learns the training data. This can be implemented by:
A w^ ( n + 1) = 7 ( 5 pj O pj ) + ^ A w jt ( n ) (18)
Where П is the learning rate, a is the momentum, d pj is the error and n is the number of iteration.
-
VII. METHODOLOGY
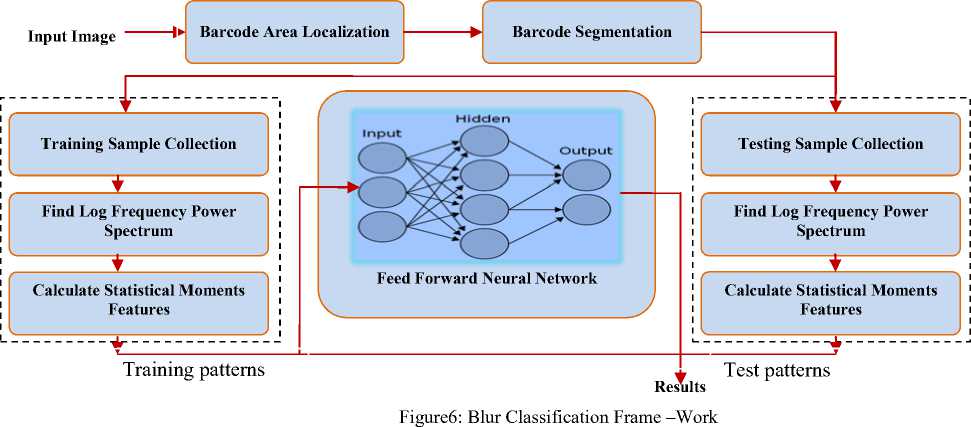
The steps of the algorithm to classify blur are detailed in figure6. These are seven major steps: image acquisition, preprocessing of images, calculation of logarithmic frequency spectrum, feature extraction of blur pattern, data normalization, designing of neural network classifier system and result analysis.
In the initial steps we introduced blurs namely motion, defocus and co-existence of both blur with varying degree of parameters to the preprocessed images. Then we find the logarithmic frequency spectrum of blurred and non blurred image to get the blur patterns. Once the blur patterns acquired, the method demands the extraction of features. So the statistical texture features have been calculated in the next step to prepare the training and testing database. Finally with this feature database training and testing performed using feed forward back propagation neural network. Fig.6 describes the overall methodology.
-
VIII. EXPERIMENTAL RESULTS
The performance of the proposed technique has been evaluated using many camera based barcode images. The WWU Muenster Barcode Database [34] of barcode images has been used in order to carry out experimental work. We have taken 100 barcode images. Then, the three different classes of blur (motion, defocus and mixed) were synthetically introduced with different parameters to make the databases of 3000 blurred images (i.e., 1000 images with each class of blur).
The classification is achieved using a feed forward neural network with single input layer consist of six neurons (selected for the six statistical texture features), two hidden layer with ten and six neurons and single output layer consists of four neurons. Back propagation is pertained as network training principle where the training dataset is designed by the extracted moment features of the blur patterns.
The whole training and testing features set is normalized into the range of [0, 1], whereas the output class is assigned to zero for the lowest probability and one for the highest. Out of 3000 blurred images we have used half of them for training and remaining for testing. In blur classification problem, we have used the four quantities of result evaluation as specified below:
-
(i) True Positive (T P )
In case of test pattern is positive and it is categorized as positive, it is considered as a true positive.
-
(ii) True Negative (TN):
In case of test pattern is negative and it is categorized as negative, it is considered as a true negative.
-
(iii) False Positive (F P )
In case of test pattern is negative and it is categorized as positive, it is considered as a false positive.
-
(iv) False Negative (FN):
In case of test pattern is positive and it is categorized as negative, it is considered as a false negative
Numberoftruepositive(T )
T=
PR Total number of positive in dataset (Np)
Numberoftruenegative (T )
T=
NR Total number of negative in dataset (N )
Numberoffalsepositive(F )
F=
PR Total number of negative in dataset (N )
Numberoffalsenegative (F )
F=
NR Totalnumberofpositive in dataset (N )
The aim of any classification technique is maximizing the number of correct classification given by True Positive Rate (T PR ) and True Negative Rate (T NR ), whereas minimizing the wrong classification given by False Positive Rate (F PR ) and False Negative Rate (F NR ) as given in equations (19)-(22).
The values of positive and Negative samples used as testing samples are 1000 and 2000, respectively for each blur categories. The data in Table I give the above discussed rates given by the classifier. Testing results give classifications accuracies as 95.9 %, 96.3%, and 99.2% for motion, defocus and mixed blur categories respectively. Classification accuracy is calculated as mean of true positive rate and true negative rate.
Table I
|
Classification Results(in percentage) |
||||
|
Blur Type |
True Positive Rate |
True Negative Rate |
False Positive Rate |
False Negative Rate |
|
Motion Blur |
94.6 |
97.2 |
2.8 |
5.4 |
|
Defocus Blur |
97.4 |
95.2 |
4.8 |
2.6 |
|
Mixed Blur |
99.4 |
99.0 |
1.0 |
.6 |
|
Motion Blur Classification Accuracy 95.9 |
||||
|
Defocus Blur Classification Accuracy 96.3 |
||||
|
Mixed Blur Classification Accuracy 99.2 |
||||
-
IX. CONCLUSION
In this paper, we have proposed a new blur classification scheme for barcode images taken by mobile cameras. The scheme makes use of the ability of statistical feature to discriminate blur patterns appear in frequency domain. This work shows identification of blur type can help to choose the appropriate blur parameter estimation approach for non-blind restoration of barcode images.
ACKNOWLEDGMENT
References Texture Features based Blur Classification in Barcode Images
- J. Vartiainen, T. Kallonen, and J. Ikonen, “Barcodes and Mobile Phones as Part of Logistic Chain in Construction Industry,” The 16th International Conference on Software, Telecommunication, and Computer Networks, pp. 305 – 308, September 25-27, 2008.
- K. Q. Wang, “Barcode character segmentation for mobile cameras”, technical report of NOKIA, 2003.
- Jain A.K., “Fundamentals of Digital Image Processing”, Prentice Hall International, 1989.
- Gonzalez R.C., Woods R.E., “Digital Image Processing”, Prentice Hall, 2007.
- Tong, H., Li, M., Zhang, H., Zhang, C., “Blur detection for digital images using wavelet transform,” in proceedings of IEEE international conference on Multimedia and Expo, Vol. 1, pp. 17-20, 2004.
- Kai-Chieh Yang, Clark C. Guest and Pankaj Das, "Motion blur detecting by support vector machine", Proc. SPIE 5916, 59160R 2005.
- I.Aizenberg, N. Aizenberg, T. Bregin, C. Butakov, E. Farberov, N. Merzlyakov, O. Milukova “Blur Recognition on the Neural Network based on Multi-Valued Neurons”, Journal of Image and Graphics. Vol.5, 2000.
- Bolan Su, Shijian Lu, and Chew Lim Tan.,” Blurred image region detection and classification”, In Proceedings of the 19th ACM international conference on Multimedia (MM '11). ACM, New York, 2011.
- Renting Liu; Zhaorong Li; Jiaya Jia, "Image partial blur detection and classification," IEEE Conference on Computer Vision and Pattern Recognition, 2008(CVPR 2008), vol., no., pp.1, 8, 23-28 June 2008.
- Papageorgiou C. P. and T. Poggio, “A Trainable System for Object Detection,” Int. Journal of Comp.Vision, 38(1), pp. 15-33, 2000.
- Zhang J. and M. Marszalek, “Local Features and Kernels for Classification of Texture and Object Categories: A Comprehensive Study,” Int. Journal of Comp. Vision, Springer Science + Business Media, 10, pp. 1-26, 2006.
- Arivazhagan S et al., “Texture Classification using Ridgelet Transform,” Proc. of Sixth Intl. Conf. on Comp. Intell. and Multimedia Applications, pp. 2005.
- Arivazhagan S et al., “Texture Classification using Curvelet Statistical and Co-occurrence Features,” Proc. of 18th Intl. Conf. on Pattern Recognition, 2006.
- Devendran V et. al., “Texture based Scene Categorization using Artificial Neural Networks and Support Vector Machines: A Comparative Study,” ICGST-GVIP, Vol. 8, Issue IV, pp. 45-52, December 2008.
- Shamik Tiwari, Ajay Kumar Singh and V P Shukla, “Statistical Moments based Noise Classification using Feed Forward Back Propagation Neural Network”, International Journal of Computer Applications 18(2):36-40, March 2011.
- Shamik Tiwari, Ajay Kumar Singh and V P Shukla, Certain Investigations on Motion Blur Detection and Estimation, in Proceedings of International Conference on Signal, Image and Video Processing, IIT Patna, pp. 108-114 ,Jan,2012.
- Mohsen Ebrahimi Moghaddam, Mansour Jamzad,"Linear Motion Blur Parameter Estimation in Noisy Images Using Fuzzy Sets and Power Spectrum Images", EURASIP Journal on Advances in Signal Processing, Vol. 2007,pp. 1-9, 2007.
- Michal Dobe?, Libor Machala, Tomá? Fürst, “Blurred image restoration: A Fast Method of Finding the Motion Length and Angle”, Digital Signal Processing, Vol. 20, Issue 6, pp. 1677-1686, ISSN 1051-2004, December 2010.
- Su Bolan, S Lu.,C. L. Tan, “Restoration of Motion Blurred Document Images”, 27th ACM Symposium on Applied Computing, Italy, March 2012.
- Moghaddam, M.E., “A Mathematical Model to Estimate Out of Focus Blur,” in proceedings of 5th IEEE international symposium on Image and Signal Processing and Analysis, pp. 278-281, 2007.
- Sakano, M., Suetake, N., Uchino, E., “A robust Point Spread Function estimation for Out-of-Focus Blurred and Noisy Images based on a distribution of Gradient vectors on the polar plane,” in the Journal of Optical Society of Japan, co-published with Springer-Verlag GmbH, Vol. 14, No. 5, pp. 297-303, 2007.
- Tsung-Ying Sun, Sin-Jhe Ciou; Chan-Cheng Liu; Chih-Li Huo; "Out-of-focus blur estimation for blind image deconvolution: Using particle swarm optimization" , in proceedings of IEEE International Conference on Systems, Man and Cybernetics, pp.1627-1632, 2009.
- J Sklansky, image segmentation and feature extraction, IEEE transaction on systems, Man and Cybernetics, 8(4):237-247, 1978.
- A.Rosenfeld, Editor, Digital Picture Analysis, Springer Verlag, Berlin, 1976.
- C. Viard Gaudin, N. Normand, and D. Barba, “A bar code location algorithm using a two-dimensional approach,” in Proc. IEEE ICDAR’93, pp. 45– 48, Oct. 1993.
- S.J. Liu, H.Y. Liao, L.H. Chen, H.R. Tyan, and J. W. Hsieh, “Camera-based bar code recognition system using neural net,” in Proc. IEEE IJCNN’93, vol. 2, Nagoya, pp. 1301–1305, Oct. 1993.
- R. Howlett, S. Berthier, and G. Awcock, “Determining the location of industrial bar-codes using neural networks,” in Proc. IEEE IPA’97, vol. 2, pp. 511–515, July 1997.
- S. Arnould, G. Awcock, and R. Thomas, “Remote barcode localisation using mathematical morphology,” in Proc. IEEE IPA’93, vol. 2, pp. 642–646, July 1999.
- D. Chai and F. Hock, “Locating and decoding EAN-13 barcodes from images captured by digital cameras,” in Proc. IEEE ICICS’05, pp. 1556–1560, Dec. 2005.
- A. K. Jain and Y. Chen, “Bar code localization using texture analysis,” in Proc. IEEE ICDAR’93, pp. 41–44, Oct. 1993.
- R. Oktem, “Bar code localization in wavelet domain by using binary morphology” ,in Proc. IEEE SIU’04, pp. 499–501, Apr. 2004.
- Tropf, Alexander, and Douglas Chai. "Locating 1-D Bar Codes in DCT-Domain”, ICASSP2, pp. 741-44, 2006.
- Wenshuo Gao, Lei Yang, Xiaoguang Zhang, Huizhong Liu, “An Improved Sobel Edge Detection”, 3rd IEEE International Conference on Computer Science and Information Technology (ICCSIT), Vol-5, pp.67 – 71, 2010.
- S. Wachenfeld, S. Terlunen, X. Jiang: http://cvpr.uni-muenster.de/research/barcode.
