The alumina dissolution in industrial aluminum cells

Author: Gao Bingliang, Feng Qiuping, Wang Zhaowen
Journal: Журнал Сибирского федерального университета. Серия: Техника и технологии @technologies-sfu
Article in issue: 4 т.11, 2018.
Free access
The dissolution behaviors of primary and secondary alumina in aluminum bath were compared. The dissolution of primary alumina can be divided into a few key steps: fast dissolution upon feeding, crust formation and sludge dissolution. The dissolution rate of secondary alumina is much faster than that of primary alumina. Industrial measurements of alumina concentration in 410 kA and 500 kA cells confirmed the laboratory results.
Alumina dissolution, secondary alumina, aluminium electrolysis, high amperage prebake cell
Short address: https://sciup.org/146279366
IDR: 146279366 | UDC: 669.712.3 | DOI: 10.17516/1999-494X-0060
Растворимость глинозема в промышленных алюминиевых электролизерах
В статье сравнивалось поведение первичного и вторичного глинозема при растворении в электролите. Процесс растворения первичного глинозема может быть представлен двумя ключевыми стадиями: быстрое растворение при питании глиноземом, формирование корки и растворение осадка. Скорость растворения вторичного глинозема гораздо выше, чем первичного. Измерения концентрации глинозема в промышленных электролизерах на 410 кА и 500 кА подтвердили результаты лабораторных исследований.
Text of the scientific article The alumina dissolution in industrial aluminum cells
At present the electrolysis of cryolite-alumina molten salts, also known as Hall-Heroult process, is the only industrial process for the primary aluminum production. The temperature of electrolysis is usually in the temperature range 940 to 970 °C. The cathodic product is liquid aluminum and the anodic product is a mixture of CO/CO2 gas. The energy consumption is about 13500 kWh/t Al.
In 2016, the global primary aluminum production is 58.17 million tons. China produced 31.645 million tons accounting for 54.4 % of global production [1]. Currently, the largest prebake cell operating at 620 kA was started in China in 2016 [2]. Such great achievements were based on the development of fundamentals on aluminum electrolysis, including bath chemistry, cell’s magnetohydrodynamics (MHD) stability of the aluminum metal, energy balance and mass balance, electrode process of super large anode, materials selection and engineering.
In decades, fundamental researches in understanding physical chemical phenomena existed in the cryolitic melt were carried out in Northeastern University, such as dissolution of metals in molten salts; dissolution of oxide in molten salts and anodic bubble behaviors during aluminum electrolysis. A special instrument, called high temperature transparent cell was used to investigate these phenomena [3-13].
The article is based on the paper presented at the IX International Congress “Non-ferrous metals and minerals-2017” [14]. In this paper, the dissolution behavior of alumina in cryolite electrolyte was presented. The mechanism for alumina dissolution under the influences of bath chemistry and temperature were also discussed. The industrial measurement campaigns of alumina concentration in 410 kA and 500 kA cells were also conducted to investigate the spatial effect and bath chemistry on alumina control in high amperage cells.
Introduction of the high temperature transparent cell
Restricted by the high temperature and heavily corrosive environment of the molten salt, studies of industrial aluminum electrolytic cells are very difficult and expensive, particularly for detailed bubble dynamics and alumina dissolution process.
Haupin invented the first generation of transparent cell used for observation of molten salts electrolysis [15]. He employed sapphire windows held in a graphite crucible to ‘see’ the electrolysis process. This kind of transparent cell was limited in high cost and small viewing window. For better viewing, Zhuxian Qiu [3-5] applied square-shaped quartz crucibles to study the metal fog, anode effect and other electrolysis phenomena, e.g. alumina dissolution. The cell enables us to observe experimental phenomena through side window, therefore it is called side-view transparent cell, as shown in Fig. 1(a). This design of cell is limited in time and current density as metal fog rapidly arises and leads to an opaque electrolyte. Qiu [4] improved the transparent cell design using double-chamber crucibles by positioning a square-shaped quartz tube inside the quartz crucible. Gao [5] further improved the cell design by implementing two chambers in one quartz crucible with a slot at the bottom of the middle wall connecting the two chambers. The cell can be operated more conveniently.
Recently, a new transparent cell with a bottom viewing window was developed at Northeastern University, as is shown in Fig. 1(b) [6]. To observe the bubble behavior in the Anode-Cathode Distance (ACD), a new viewing window at the bottom of furnace was opened. The experimental situations are recorded by an Industrial Camera (MV-VS078FC) from bottom viewing window.
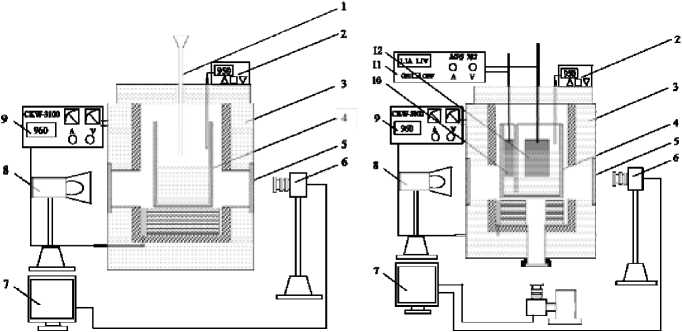
(a) Side-view transparent cell
(b) Bottom-view transparent cell
Fig. 1. The schematic diagrams of side-view transparent cell and bottom-view transparent cell: 1 – Charging pipe; 2 – Thermocouple; 3 – Furnace; 4 – Quartz Crucible; 5 – Side-view Quartz Window; 6 – High Speed Camera; 7 – Computer; 8 – Light Source; 9 – MPS 3100 Temperature Controller; 10 – Cathode; 11 – 702 DC Power Supply; 12 – Anode
Dissolution of alumina in cryolite electrolyte
Industrial aluminum smelters use alumina as the raw material for electrolysis. The alumina dissolution in molten cryolite bath has been a long and challenging topic. The high temperature transparent cell (as shown in Fig. 1 (a)) was used for observing the dissolution behavior of alumina, including comparison of dissolution behavior between the secondary alumina and the primary alumina, physical-chemical properties of alumina on dissolution rate, crust dissolution dynamics [7-10].
Fig. 2 shows snapshots of the dissolution processes of primary alumina and secondary alumina. The experiments were conducted in the melt of 2.4NaF·AlF3-5%LiF-4%CaF2 at 1228 K (955 °C). The melt was not stirred during experiments for observing dissolution behaviors under static bath flow condition.
During the first 20 seconds after addition of primary alumina, a portion of the alumina dispersed through the electrolyte and dissolved quickly in 20 seconds. The undissolved alumina particles, however, formed a layer of boat-like white agglomerate with a dimension of 55 mm х 55 mm х 0.5 mm and floated on the surface of the electrolyte for over 2 minutes. Then the agglomerate sank to the bottom of the crucible and dissolved completely. The whole dissolution process of primary alumina lasted 600 seconds in this experiment.
Upon addition, the secondary alumina dispersed into the melt rapidly in the forms of particles and fine fragments. After 32.6 seconds, the dissolution of secondary alumina was almost completed. It was noticed that there was no crust formed during the dissolution process of secondary alumina. Moreover, gas bubbles released at the interface of the liquid melt and floating particles. In this experiment, the whole dissolution process of secondary alumina lasted 113 seconds, which was significantly faster than that of the primary alumina.
The real reason for disappearance of agglomerate is the damage of connection formed on the surface of molten cryolite between alumina particles. Carbon dust trapped in the secondary alumina burned as soon as it reached the surface of molten electrolyte, the heat of combustion preheated the – 378 –
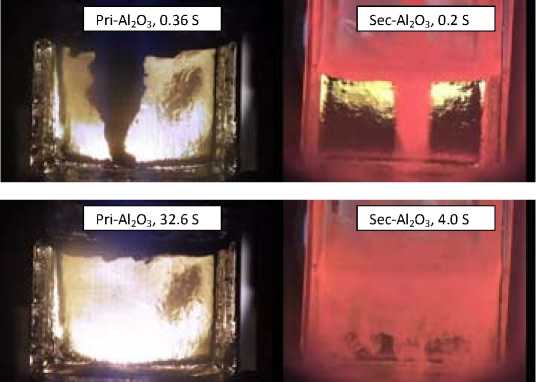
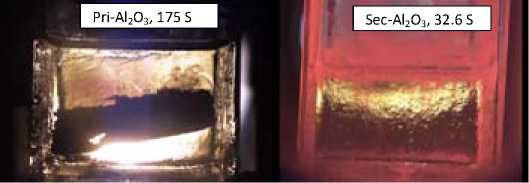
Fig. 2. Comparison of the dispersion of primary alumina and secondary alumina in cryolite-electrolyte at 1228 K alumina and then reduced the temperature gradient between the cold alumina and molten salts; the instantly generated carbon dioxide played a role of agitation, both of which give active help to alumina dissolution. The gas bubbles generated between alumina particles break up the connections between alumina particles. Small pieces of alumina result in faster wetting by the molten electrolyte and longer floating time in electrolyte. After sinking through the melt, much bigger contact area with the melt makes it easier to dissolve.
Our findings encouraged the Chinese aluminum smelters to use the secondary alumina instead of primary alumina for getting better dissolution in the reduction cells. Because the secondary alumina is obtained by absorbing fluorides in the duct gas using primary alumina in the Gas Treatment Center, the smelters have greater motivation to recover the fluorides in the duct gas even the gas scrubbing procedure consumes a lot of energy accounting for 3 % of energy consumption for aluminum smelting.
Effect of physiochemical properties of alumina and bath chemistry on alumina dissolution
Alumina dissolution tests were conducted by using transparent electrolysis cell as shown in Fig. 1 (a), and the corresponding bath compositions are listed in Table 1. The bath chemistry was chosen with respect to the industrial aluminum bath.
The chemical compositions and specifications of four alumina samples were analyzed. The results are listed in Table 2 and Table 3, separately. Rietveld refinement using FullProf Suite Program (2.05) was employed to analyze the phase composition of alumina using X-ray diffraction (XRD) patterns. For
Table 1. Dissolution experiments conducted in different bath chemistry
|
Electrolyte |
Operating Temperature / K |
Initial Superheat / °C |
|
2.45NaF·AlF 3 -3%MgF 2 -2%LiF-2%KF-5%CaF 2 (Bath 1) |
1233 (960 °C) |
5 |
|
2.7NaF·AlF 3 -2%MgF 2 -1.5%LiF-1.5%KF-4.5%CaF 2 (Bath 2) |
1248 (975 °C) |
4 |
Note: Superheat equals to operating temperature minus the liquidus temperature which was calculated from Solheim’s empirical expression [16].
Table 2. Chemical compositions of alumina used in the dissolution experiments
|
Pri-alumina |
Al 2 O 3 |
Na |
Si |
S |
K |
Fe |
Ca |
|
1# |
99.00 |
0.25 |
0.06 |
0.03 |
0.04 |
0.03 |
0.03 |
|
2# |
99.20 |
0.39 |
0.04 |
0.03 |
0.01 |
0.02 |
0.02 |
|
3# |
99.24 |
0.32 |
0.04 |
0.06 |
0.02 |
0.02 |
0.01 |
|
4# |
99.31 |
0.33 |
0.03 |
0.04 |
0.00 |
0.02 |
0.02 |
Table 3. Specifications of the industrial alumina samples [18]
The dissolution behaviors of the 4# alumina sample in Bath 1 and Bath 2 are shown in Fig. 3. In each addition, 2 grams of alumina was added into 200 grams of molten bath. Every data point in the figure means the dissolution time for 1 wt.% of alumina in the bath. During experiment, the temperature was kept constant. With increasing of alumina concentration in the bath, the superheat of the bath increased correspondingly.
As seen in the Fig. 3, for a certain bath chemistry and alumina sample, a plateau was observed if alumina concentration was not higher than 3 %, while the single dissolution time increases linearly with increasing alumina concentration at Al2O3>3 %. This suggests different rate-controlling steps at segmented alumina concentrations. For alumina concentration below 3 %, the dissolution rate was independent of the alumina concentration, which indicates that the order of the reaction was zero and the rate controlling step of the dissolution process was a chemical reaction. While for alumina concentration above 3 %, the structure of the existing melt became effective and the dissolution rate was in the control of diffusion rate.
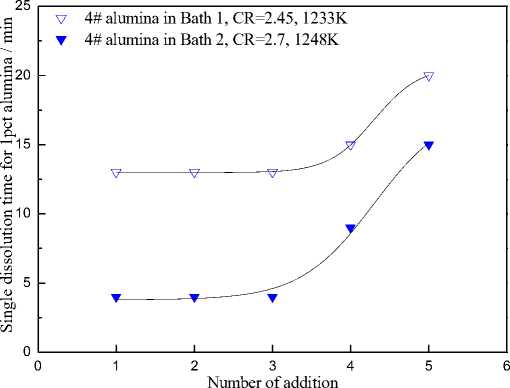
Fig. 3. Single dissolution time of 4# alumina samples in Bath 1 and 2
Alumina concentration / %
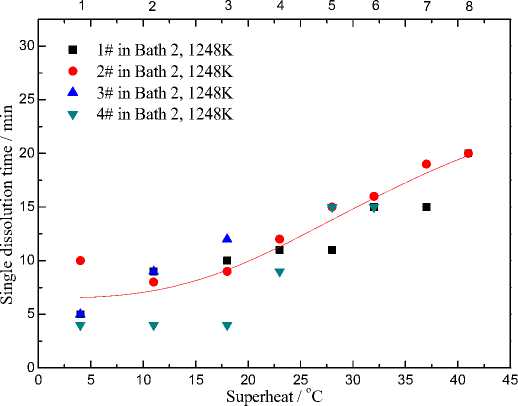
Fig. 4. Dissolution time for 1pct alumina samples vs. bath superheat and alumina concentration in the melts with CR=2.7
Bath superheat is the difference between the bath liquidus temperature and the operating temperature. This difference is important for providing a driving force for the stable heat transfer of the aluminum reduction cell. Along with the continuous feeding of alumina samples in one experiment, the increasing alumina concentration in the electrolyte led to an increase of bath superheat. The dissolution times for 1 wt.% 1#-4# alumina in Bath 2 at 1228 K(955 °C) was summarized and drawn with superheat and alumina concentration in Fig. 4.
The superheat is important for the alumina dissolution process, which prevents the serious retardation caused by localized cooling and enhances the heat transfer during the endothermic dissolution process. Less [19] and Johnson [20] have concluded that there is also a critical point – 381 – for the bath superheat. In their research, once the superheat goes above 10 K (10 °C), the effect on the dissolution rate is negligible. Plots in Fig. 4 showed the same principle, the positive influence of superheat on dissolution rate was completely covered up by the negative influence of increasing alumina concentration which inhibits the dissolution of new added alumina.
Alumina dissolution in 410 kA and 500 kA aluminum electrolytic cells
Alumina contents in one 410 kA industrial pot and one 500 kA industrial pot were measured. The evolution of alumina concentration for 2 hours was tracked combined with recording of cell resistance. Two bath samples were taken from the tested cells at tap end and duct end, simultaneously. The sampling intervals were 3 minutes for 410 kA cell, and 2 minutes for 500 kA cell, respectively. Strontium was employed as the tracer element to investigate the flow state of the molten electrolyte in the cell as well as the amount of liquid electrolyte in the testing cells. It is found that the quantities of the liquid electrolytes were calculated as approximately 8.3 tons in the 500 kA industrial cell and 7.6 tons in the 410 kA industrial cell. Compared to 500 kA cell, the ratio of bath weight to amperage is larger, which might be benefit for better alumina dissolution. However, some other factors, such as alumina properties, bath superheat, play more significant impact on alumina control in industrial cells according to our investigation.
In the case of 410 kA prebake cell, the cell was operated at 957±2 °C. The bath composition was analyzed with chemical methods. The bath molar ratio of NaF to AlF3 is 2.33. The bath contains 1.5 wt.% LiF, 2.3 wt.% KF and 5.6 wt.% CaF 2 . The bath liquidus temperature was analyzed with thermal analysis method as 958 °C. The bath chemistry indicates that the cell was operated at very low superheat (± 2 °C) during alumina measurement. We also observed some bath buildup on one of feed breakers in the test cell.
Fig. 5 shows the alumina concentration evolution for two hours test in 410 kA cell. Obviously, the practical alumina concentration was in the range of 2-5 wt.%, outside the target band of 1.5-3 wt.%. At same sampling time, the alumina concentration difference between two sampling locations is very significant, sometimes more than 3 wt.%. The low superheat might be the main reason for so poor control of alumina concentration.
In the case of 500 kA prebake cell, the cell was operated at 970±2 °C. The bath molar ratio of NaF to AlF 3 is 2.20. The bath contains 0.7 wt.% LiF, 0.6 wt.% KF and 4.3 wt.% CaF 2 . The bath liquidus temperature was analyzed with thermal analysis method as 960 °C. The bath chemistry indicates that the cell was operated at good superheat (8-12 °C) during alumina measurement.
Fig. 6 shows the alumina concentration evolution for two hours test in 500 kA cell. Obviously, the practical alumina concentration was in the range of 1-2 wt.%. Most data are below the lower limit (1.5 wt.%) of target band. The low alumina content might be better for decreasing cell sludge, however, increasing the risk of anode effect.
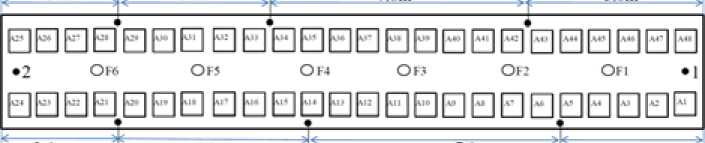
The alumina content distribution was also measured in the same 500 kA cell, which was carried out 14 hours later. Six more sampling positions were selected besides tap end and duct end, which are illustrated in Fig. 7.
Alumina content distribution in the 500 kA cell is shown in Fig. 8. After 14 hours, most data are in the range 1.5-3.0 wt.%. At the same sampling time, the largest content difference of alumina at different locations is about 1 wt.%. Most data confirm that the alumina content distribution in the test
□ n0
□ rob □ g 6° 8
Tap end ○ Duct end
Upper limit
Lower limit

0 20 40 60 80 100 120 140
Time/min
Fig. 5. Alumina content and feed rate vs. time in a 410 kA pre-bake cell: □ - Tap end, о - Duct end
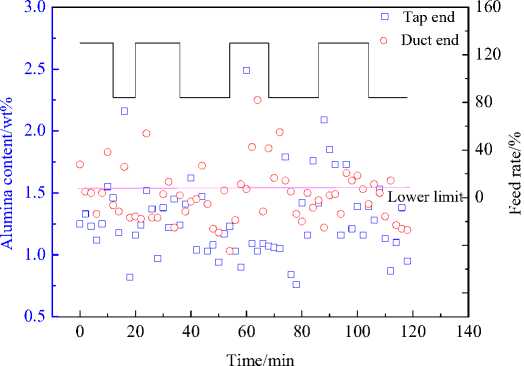
Fig. 6. Alumina concentration and feed rate vs. time in a 500 kA pre-bake cell: □ - Tap end, о - Duct end
5 4 I
Duct end
8 7 6
Fig. 7. Sampling positions in a 500 kA prebake cell, which has length 21 m and width 5 m, 1 to 8 represent sampling positions and F1 to F6 represent alumina feed holes
500 kA cell is basically uniform with average difference of 0.5 wt.%. The temperature fluctuation, as is shown in Fig. 9, indicates that the temperature decrease is about 5 to 8 °C. The bath superheat (8-12 °C) guarantees the enough heat for alumina dissolution.
Alumina samples used in these industrial cells were analyzed in laboratory. The properties of alumina are listed in Table 4. Alumina used in 410 kA prebake cell contains higher content of Li2O and K 2 O, lower content of alpha phase alumina. The average particle size (D50) of alumina used in 500 kA prebake cell is 87.3 μm, which is significantly higher than that of alumina used in 410 kA prebake cell.
The dissolution behaviors of these alumina samples were investigated by the transparent cell method described in previous sections of this paper. It is interesting to find that alumina (500 kA) has much longer floating time in molten cryolite electrolyte than that of alumina
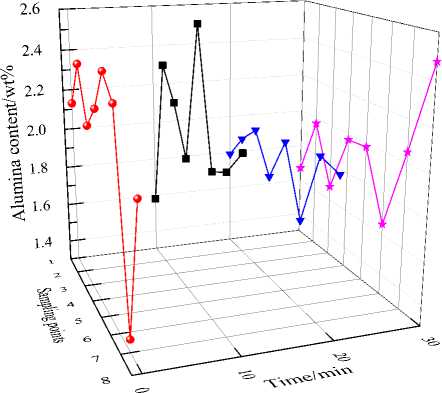
Fig. 8. Alumina concentration distribution in eight positions of 500 kA prebake cell vs. sampling time, (• – 0 min, first sampling; ■ - 10 min, second sampling; ▼ - 20 min, third sampling; ★ - 30 min, fourth sampling)
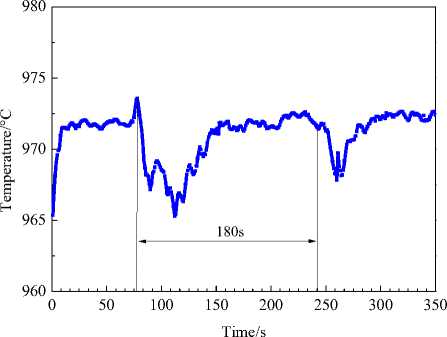
Fig. 9. Temperature fluctuation during alumina feeding in 500 kA reduction cell
Table 4. The physical chemical properties of alumina used in 410 kA prebake cell and alumina used in 500 kA prebake cell
|
Properties |
Alumina (410 kA) |
Alumina (500 kA) |
Properties |
Alumina (410 kA) |
Alumina (500 kA) |
|
Particle size ≤21.2 μm vol. % |
4.91 |
4.70 |
Impurities |
||
|
BET surface area m2/g |
118.70 |
110.10 |
K 2 O, % |
0.051 |
0.034 |
|
Volume Density g/cm3 |
0.94 |
0.97 |
Na 2 O, % |
0.35 |
0.34 |
|
Rest angle ° |
34.6 |
31.9 |
CaO, % |
0.026 |
0.077 |
|
α-Al 2 O 3 % |
3.72 |
8.53 |
Fe 2 O 3 , % |
0.081 |
0.042 |
|
γ-Al 2 O 3 % |
25.57 |
22.70 |
Li 2 O, % |
0.12 |
0.002 |
|
δ-Al 2 O 3 % |
49.01 |
46.49 |
SiO 2 , % |
0.06 |
0.20 |
|
θ-Al 2 O 3 % |
21.70 |
22.28 |
D50 μm |
65.3 |
87.3 |
(410 kA). Floating time means the total floating time of alumina-solid bath agglomerate formed during feeding on bath surface. Longer floating time means lower risk of sludge formation in the reduction cell.
Even if the bath weight/amperage ratio of 500 kA prebake cell is lower than that of 410 kA prebake cell, the other factors, such as proper bath superheat, alumina with higher average particle size and lower impurities, higher operating temperature enable better alumina concentration control and more uniform concentration distribution.
Conclusions
Using the high temperature transparent electrolytic cell, we have showed the nature of some important phenomena in the high temperature molten salts. The cell provided us a lot of information for understanding the dissolution behavior of alumina in cryolite electrolytes.
Bath superheat plays a very important role in alumina control in industrial aluminum electrolytic cells. It is better to control the bath superheat in the range of 8-12 °C for better alumina dissolution and uniform alumina concentration distribution.
Acknowledgements
The work is financially supported by the China Nature Science Foundation Grant under grant No: 51434005, 51529401 and 51574070.
The article is based on the paper presented at the IX International Congress “Non-ferrous metals and minerals-2017”.
References The alumina dissolution in industrial aluminum cells
- The website of the International Aluminum Institute, http://www.world-aluminum.org/statistics/.
- Alton T. Light Metal Age. 2017. Vol. 75. No. 1. P. 26-29.
- Qiu Z.X., Fan L.M., Grjotheim K., Kvande H. Journal of Applied Electrochemistry. 1987. Vol. 17. No. 4. P. 707-714.
- Grjotheim K., Kvande H., Qiu Z.X., Fan L.M. Aluminum. 1989. Vol. 2. P. 157-162.
- Gao B.L., Hu X.W., Xu J.L., Shi Z.N., Wang Z.W., Qiu Z.X. Light Metals 2006. ed. Galloway T.J. Light Metals. TMS. Warrendale. PA. 2006. P. 467-470.
- Zhao Z.B., Wang Z.W., Gao B.L., Feng Y.Q., Shi Z.N., Hu X.W. Light Metals 2015. ed. Hyland M. Light Metals. TMS. Warrendale. PA. 2015. P. 801-806.
- Yang Y.J., Gao B.L., Wang Z.W., Shi Z.N., Hu X.W. Metall. Mater. Trans. B. 2013. Vol. 44. No. 5. P. 1296-1303.
- Yang Y.J., Gao B.L., Wang Z.W., Shi Z.N., Hu X.W., Yu J.Y. Metall. Mater. Trans. B. 2014. Vol. 45. No. 3. P. 1150-1156.
- Yang Y.J., Gao B.L., Wang Z.W., Shi Z.N., Hu X.W. JOM. 2015. Vol. 67. No. 5. P. 973-983.
- Yang Y.J., Gao B.L., Wang Z.W., Shi Z.N., Hu X.W. JOM. 2015. Vol. 67. No. 9. P. 2170-2180.
- Zhao Z.B., Wang Z.W., Gao B.L., Feng Y.Q., Shi Z.N., Hu X.W. Metall. Mater. Trans. B. 2016. Vol. 47. No. 3. P. 1962-1975.
- Zhao Z.B., Gao B.L., Feng Y.Q., Huang P., Wang Z.W., Shi Z.N., Hu X.W. JOM. 2016. Vol. 69. No. 2. P. 281-291.
- Yang Y.J., Gao B.L., Wang Z.W., Shi Z.N., Hu X.W. Metall. Mater. Trans. B. 2016. Vol. 47. No. 1. P. 621-629.
- Gao B.L., Yang Y.J., Wang Z.W., Shi Z.N., Hu X.W. The IX International Congress "Non-ferrous metals and minerals-2017".
- Haupin W.E., McGrew W.C. Aluminium. 1975. Vol. 51. P. 273.
- Skybakmoen E., Solheim A., Sterten Å. Metall. Mater. Trans. B. 1997. Vol. 28. No. 1. P. 81-86.
- Whittington B., Ilievski D. Chem. Eng. J. 2004. Vol. 98. No. 1. P. 89-97.
- Chartrand P., Pelton A.D. Light Metals. TMS. Warrendale. PA. 2002. P. 245-252.
- Less L. Light Metals. TMS. New York. NY. 1976. Vol. 1. P. 315-331.
- Johnson A.R. Light Metals. TMS. Warrendale. PA. 1981. P. 373-387.
