The analysis of the level of the development of the Russian regions on the base of «human development index»

Автор: Tolcheev V.O.
Журнал: Arctic and North @arctic-and-north
Рубрика: Regionology of the Arctic and North: Management, Economy, Sozium, Culture
Статья в выпуске: 14, 2014 года.
Бесплатный доступ
A description of the human development index (HDI) in relation to the Russian Arctic. A comparison of regional HDI using data mining techniques.
Human development index, index of education, index of longevity, index of gross national product, comparison of Russian regions, methods of Data Mining and Knowledge Discovery
Короткий адрес: https://sciup.org/148319867
IDR: 148319867 | УДК: 021.8+025.1
Текст научной статьи The analysis of the level of the development of the Russian regions on the base of «human development index»
In the last decade for the comparative analysis of innovation, socio--‐economic, scientific and technological development of different countries widespread specialized ratings, which are calculated on the basis of available statistical information and expertise. These ratings were ranked states on such indicators as innovation economy, investment attractiveness, availability of highly qualified personnel, the efficiency of the system of vocational training. Many of the most comprehensive ratings are based on the simultaneous assessment of the socio--‐economic and sci--‐ entific--‐technical aspects as well as the development of human capital and raising the welfare of citizens.
Analytical work on the comparison of the level of the development of different countries, identify trends, "best practices" (benchmarking) is an important activity of leading international organizations, forming the "agenda" of economic, innovation, scientific and technological devel--‐ opment of the world community. These include the United Nations, the World Bank, the Organiza--‐ tion for Economic Cooperation and Development, the World Economic Forum, etc. The credibility of rating depends on the image of the organization, which developed it, and methodology. It is a problem of quality of the rating, in particular, ways to harmonize processing and expert opinions, choosing the right weights and benchmarks (criteria), obtaining comparable statistical information is in the center of ongoing discussions among experts and often subjected to fair criticism. Unfor--‐ tunately, neformalization of techniques used in some cases leads to obtaining biased results that can be used in the interests of various groups of influence. Some ratings of the data support the decision making process are transformed into an instrument of the political pressure and the for--‐ mation of the society a certain point of view. Using rankings in lobbying to seriously undermines the credibility of the obtained estimates and recommendations.
Specialized methods of data mining (IBP, Data and Text Mining) can effectively detect and visualize latent unobservable patterns from large amounts of heterogeneous information.
Human development index
This article examines one of the most widely known ratings --‐ the human development in--‐ dex (ИРЧП,)3, which is used to compare the level of "creative environment and favorable condi--‐ tions for life" in different countries (or regions) to identify significant between socio--‐economic dif--‐ ferences. [1] HDI is based on the achieved performance in education (literacy rate and the propor--‐ tion of students aged 7 to 24 years), health (life expectancy at birth), the economy (gross national income per capita in U.S. dollars at purchasing power parity). In this article, these figures will also be called the index of education, longevity index and the index of income. Developers HDI follow--‐ ing explanation for the choice of these characteristics: "Human development is a process of ex--‐ panding the range of choices. The most important elements of choice --‐ to live a long and healthy life, get an education and have a decent standard of living. Additional selections include political freedom, guaranteed human rights and self--‐respect" [1].
In calculating the index is mainly used statistical information that allows us to consider it sufficiently objective and verifiable. However, the collection of baseline data, a number of chal--‐ lenges: the difficulty of obtaining comparable statistics for all countries and deliberate misrepre--‐ sentation provided statistics (eg, bias). HDI calculation is performed as follows: for each of the in--‐ dexes set minimum and maximum calculated values : life expectancy at birth of 25 and 85 years, the adult literacy rate: 0--‐100 % total enrollment among children and youth 0--‐100% real gross na--‐ tional income (GNI) per capita: 100 and $ 40,000. On the basis of the limit values and actual per--‐ formance recalculation of data so that the HDI ranges from 0 to 1 (formulas and methods of calcu--‐ lating the composite index are given in) [2, p. 144].
Depending on the value of the HDI countries are grouped into four groups: those with a very high value of the HDI (0.8--‐1), a high value of (this group includes the Russian Federation with the index equal to 0.788, 55 out of 187 countries, the index of 2013) medium and low HDI value. For Russia, characterized by a significant imbalance between the two variables being analyzed --‐ at sufficiently high values of the index of education there is a very low value of the index of longevity. Over the previous decade, most of which in the Russian Federation celebrated economic growth, human development index in the country has grown significantly, but the above imbalance re--‐ mained virtually unchanged [1, 2]. Another negative feature of the Russian HDI is a strong de--‐ pendence on the factor of inequality. Thus, the HDI adjusted for inequality, for Russia a few points below the previously specified (0,788) and is equal to 0.689 [1, 2].
Presented rating very versatile, but it gives a "smoothed" value actually measuring the "av--‐ erage temperature in the hospital". In this regard, the recent attention of the specialists switched to a more narrowly focused and specialized modification of the original rating, allowing detail to evaluate the processes occurring in the regions (or social groups), to take into account their speci--‐ ficity, to analyze the differences. Most often, the loss of the universality and diversity rating is ac--‐ companied by increase its accuracy, reliability and usefulness .
Assessment of the uneven development of the regions within a country, the identification of the socio--‐economic stratification and unequal conditions for the human development is im--‐ portant information for decision--‐makers. These estimates are needed to stimulate competition between regions for investment and human capital, identifying leaders and learn best practices, leveling the socio--‐economic development, poverty alleviation, improving demographics, analysis of migration flows.
Application of data mining techniques of the Integrated Assesment HDI Russian Regions
In the context of Article important are two questions: Is it possible to obtain new infor--‐ mation (interconnection, interdependence, patterns ) on the level of the development of Russian regions, using data mining techniques (IBP, Data and Text Mining), and whether you want to use these methods? The answer to the second question is obvious enough --‐ if 80 observations, each of which contains three features, it is difficult to conduct an expert assessment because of the limita--‐ tions of human capabilities for processing large numbers of multi--‐dimensional data. In this situa--‐ tion means IBP able to act as "intelligent" assistant and researcher amplifier capabilities, greatly simplifying the analysis process.
The answer to the first question is more complicated and requires a study of the available sample, consisting of regional index values using methods IBP and the following tasks: 1) identify the relationships among the variables being analyzed (the problem of correlation analysis), 2) de--‐ termine the degree of homogeneity of the Russian regions analyzed indicators (problem of cluster analysis and data visualization), and 3) analysis of the situations that occur with equal HDI regions that in particular, the study of the issue: whether to close values of HDI identity indices of income, longevity and education (the problem of cluster analysis ); 4) the interpretation of the partitions into groups (clusters) in terms of the available expert information (if the results do not contradict common sense and logic ).
The paper used for IBP program «STATISTICA» (developer of the American company StatSoft). Baseline data are shown in Table 1 (only a fragment of the overall table containing the index values for the 80 subjects of the Russian Federation, for more details see [2, p. 142--‐143] Fur--‐ ther, we analyze the HDI for 2009).
Table 1
|
Subject of Federation |
Income Index |
Index Longevity |
Index of Educa--‐ tion |
HDI |
|
6. Belgorod region |
0,881 |
0,768 |
0,909 |
0,852 |
|
7. Tomskaya region |
0,876 |
0,718 |
0,955 |
0,85 |
|
8. Republic Sakha (Yakutia) |
0,894 |
0,691 |
0,922 |
0,836 |
|
9. Krasnoyarsk region |
0,891 |
0,711 |
0,9 |
0,834 |
|
10. Omskaya region |
0,849 |
0,729 |
0,923 |
0,834 |
|
11. Republic Komi |
0,903 |
0,692 |
0,9 |
0,832 |
|
12. Orenbursk region |
0,88 |
0,714 |
0,9 |
0,831 |
|
13. Lipezkiy region |
0,866 |
0,724 |
0,898 |
0,829 |
|
14. Arkhanhelsk region |
0,878 |
0,71 |
0,896 |
0,828 |
|
15. Sverdlovskiy region |
0,845 |
0,723 |
0,916 |
0,828 |
|
16. Krasnodarskiy region |
0,824 |
0,761 |
0,9 |
0,828 |
|
17. Novosibirsk region |
0,817 |
0,732 |
0,935 |
0,828 |
|
18. Bashkorstan Republic |
0,845 |
0,734 |
0,902 |
0,827 |
|
19. Chelyabinsk region |
0,837 |
0,721 |
0,92 |
0,826 |
|
20. Samara region |
0,831 |
0,72 |
0,925 |
0,825 |
Carry out the research of the source data using the «STATISTICA».
Analysis of the relationship and interaction between characters(indices)
To identify the forces linear relationship between the three investigated indices construct the correlation matrix (see Table 2).
Table 2
|
Name of the Index |
Income Index |
Index Longevity |
Index of Education |
|
Income Index |
1,000000 |
--‐0,264693 |
0,456741 |
|
Index longevity |
--‐0,264693 |
1,000000 |
0,032954 |
|
Index of Education |
0,456741 |
0,032954 |
1,000000 |
Calculations show that 1) a moderate correlation between the index and the index of in--‐ come formation, and 2) the almost complete lack of communication between the index and the index of longevity education, and 3) a weak negative correlation between the index of income and longevity index (negative correlation means that there is a linear negative relationship, ie . in--‐ crease in the value of the first variable in most cases corresponds to a decrease in the value of the second variable). If the first finding is consistent with logic and preliminary expectations, the other two results do not correspond to what is observed in the analysis, for example, regions within the European industrialized countries. It has been established that a high level of education has a posi--‐ tive effect on life expectancy. People who have received a good education, much more concerned about their health and try to lead a healthy lifestyle, limiting the consumption of alcohol, tobacco, paying extra attention to your diet and physical activity.Of particular concern is the presence of a (weak) negative correlation between the index and the index of income longevity. This means that the growth of per capita GNI is not converted properly in providing quality health care, environ--‐ mental protection and the promotion of healthy lifestyles. Indirectly, this indicates a significant stratification of society in which there are like two parallel worlds "rich", provided with special elite medical care, and "poor " health and life expectancy is on the background of some improve--‐ ment in financial and economic conditions in the region decreases (due to the closure of health facilities in rural areas, the lack of qualified specialists in the field of health, unemployment, hous--‐ ing problems , high mortality as a consequence of alcoholism and hereditary diseases).
Evaluation of Homogenity of the Russian regions
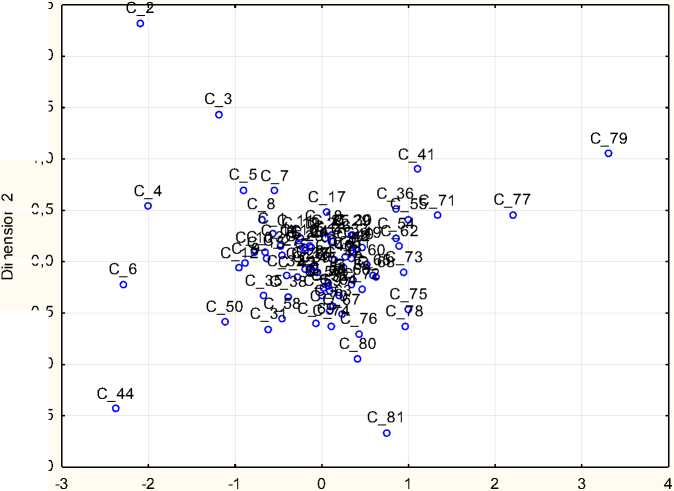
Test the hypothesis, the assumption that among Russian regions there are significant dif--‐ ferences in the three analyzed parameters (there are irregularities). Alternative hypothesis --‐ all regions are homogeneous, the differences between them are insignificant . Using visualization tools (to build a three--‐dimensional scatterplot (Fig. 1) and conduct multidimensional scaling (Fig. 2)) leads to the conclusion of a group of strongly differing regions (some of these regions among the leaders, and the other part --‐ to outsiders).
3D Scatterplot: Индекс образования vs. Индекс долголетия vs. Индес дохода (Casewise deletion of missing data)
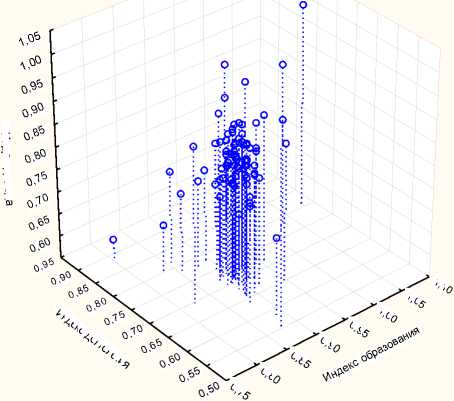
Pic. 1. Three dimensional Scatterplot
To determine the position of subjects of the Russian Arctic greatest interest is the analysis of the "typical" regions, which is located in Fig. 1 and 2 in the cluster a large number of points.
Scatterplot 2D
Final Configuration, dimension 1 vs. dimension 2
2,5
2,0
1,5
1,0
0,5
0,0
-0,5
-1,0
-1,5
-2,0
Dimension 1
Pic. 2. Location of regions in the plane, obtained by the method of multidimensional scaling (metric --‐ the Euclidean distance)
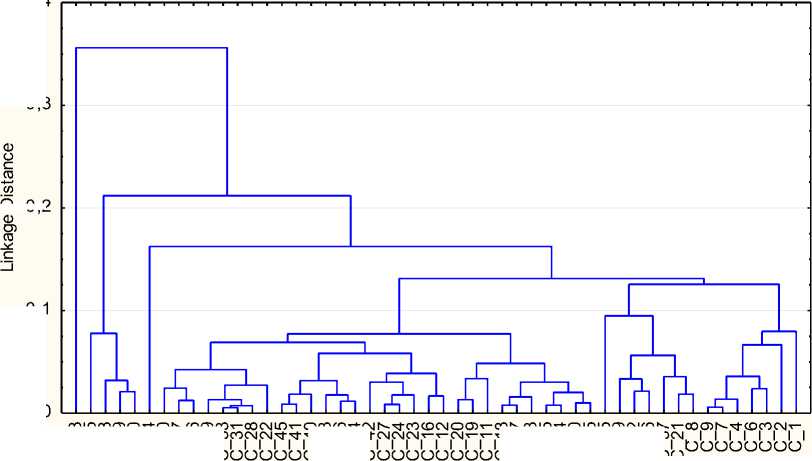
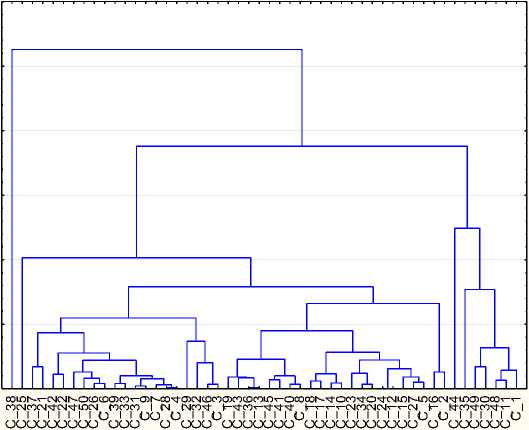
For more detailed analysis excluded from consideration "highly evolved" HDI regions with more than 0.85 (these five regions) and less than 0.8 (25 regions). Further, the analysis involved 50 regions with medium--‐high values of the HDI. Held their visualization and clustering using hierar--‐ chical cluster analysis (metric --‐ the Euclidean distance method for combining clusters --‐ usually far--‐ thest neighbor).
On the resulting dendrogram Arkhangelsk region (in the analyzed file has the number 9 and Figure 3 is referred to as S_9) enters the far--‐right group (cluster) in kotoroysoderzhitsya also 6 more regions (S_1 --‐ Belgorod region, C_2 --‐ Tomsk region, S_3 --‐ Republic of Sakha (Yakutia), S_4 --‐ Krasnoyarsk Territory, S_6 --‐ Komi Republic S_7 --‐ Orenburg region). The highest affinity is observed between the Arkhangelsk region and Orenburg region. This is due to the proximity of the values of most of the indices. Another nearest neighbor rated --‐ Lipetsk region is absent in the cluster (as well as the Omsk region, which in Table 1 on the HDI value is close to the Arkhangelsk region). This is due to low compared with the mean value in the group index income.
Tree Diagram for 50 Cases
0,4
0,3
Complete Linkage
Euclidean distances
0,2
0,1
0,0
00 Ю 00 CD О ON CD CD CO о co co ЧЧСОСОЧ
CONCOLD4"OUjLOO)C\|CDN
T-’t-’t-’t-’t-T- f\l CM CO CM CO
Pic. 3. Hierarchical cluster analysis results obtained for 50 of the most "typical" regions
Such a situation is typical for multidimensional document processing tasks --‐ there are sev--‐ eral observations from almost the same value of the target (in this case HDI), but a more detailed study of the means IBP reveals the existence of sufficiently strong heterogeneity between obser--‐ vations on individual factors analyzed and assign them to different groups. Thus, the application of IBP clarifies composite index, "highlights" non--‐obvious at first glance, the differences.
Figure 4 (Tukey diagram) shows the median value, the minimum and maximum values of the indices for the regions included in the total with Arkhangelsk cluster shows signs of variability. In this cluster leader in the income index is the Komi Republic (0.903) and on this indicator is ob--‐ served highest affinity between regions. In cluster formed horrible three regions included in the
Arctic zone of the Russian Federation: C_3 --‐ Republic of Sakha (Yakutia), C_4 --‐ Krasnoyarsk Territo--‐ ry and C_9 --‐ Arkhangelsk region. Table 1 shows the general indexes calculated for the Arkhangelsk Region and Nenets Autonomous District. [2] Another two Arctic Murmansk region and Chukotka
Autonomous Okrug in Figure 3 are labeled accordingly C_37 and C_38. In this part of the Mur--‐ mansk region adjacent cluster regions with sufficiently close values of the analyzed parameters
(compared to a cluster, including the Arkhangelsk region). Chukotka Autonomous Okrug occupies an isolated position in Figure 3 and is not included in any group ( of the considered subjects of the
Russian Federation there are no regions with similar characteristics). This explains the "peak" val--‐ ue of the income index (0.997, the second value after Moscow), the lowest value of the index of longevity (0.554) and low value of education index (0.877).
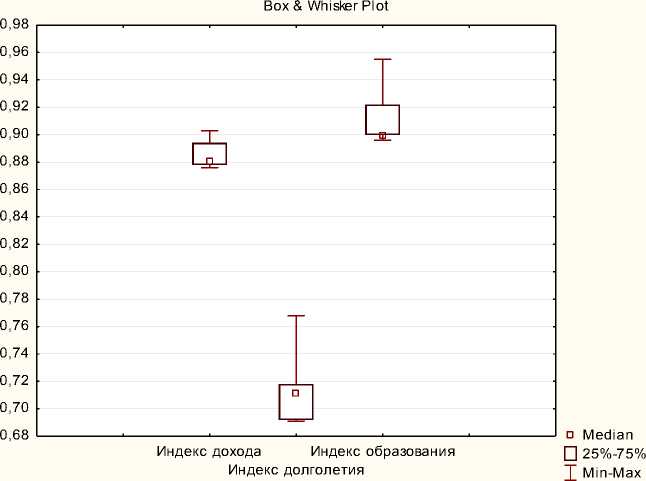
Pic. 4. Diagram Tukey analyzed indices in the cluster
Significant is the question: how does the income index for the division of regions into clus--‐ ters. Figure 5 shows a dendrogram constructed only by the values of the index of longevity and education index.
Obviously, the resultant decomposition varies considerably . Virtually all of the clusters formed anew. Of the regions that are included in a single cluster with the Arkhangelsk region (C_9) in the previous stage of the research, only two remain unchanged: the Orenburg region (C_7) and Krasnoyarsk Krai (C_4).This indicates a significant impact on the resulting income index HDI and distribution groups. The newly obtained partition allows you to get clusters of regions with similar index values of longevity and education.
Tree Diagram for 50 Cases
Complete Linkage
Euclidean distances
Pic. 5. The results of hierarchical cluster analysis obtained by using only two indices --‐ the index of longevity and education index
Further elaboration of the research results carried out for the first 15 regions (out of 50 previously selected) having not less than the HDI of 0.825. Figure 6 shows a three--‐dimensional graph showing the distribution in space of the analyzed areas. In the diagram stands steady group of three regions: Arkhangelsk Region (C_9), Orenburg region (C_7) and Krasnoyarsk Krai (C_4), which thanks to the proximity parameters analyzed using various imaging methods and clustering to form a "core" group.
3D Scatterplot: Var4 vs. Var3 vs. Var2
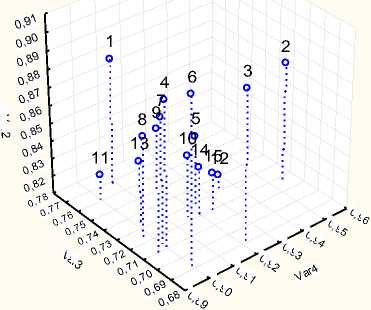
Pic. 6. Three dimensional diagramme, which was constructes for 15 regions
Interpretation of the results
The above analysis is of value only if its findings can be interpreted and logically explained.
Do "disturbing moments" in the results? Probably, yes. Indeed, in most publications that address the socio--‐economic, scientific--‐technical and educational level of the Arkhangelsk region, there is a huge number of serious problems [3, p. 141--‐142, 145, 197, 199, 248; 4]: annual decline in popula--‐ tion due to mortality and outflow of the most active citizens (and, as a consequence, the lack of skilled manpower for the shipbuilding, engineering and other industries); queues in kindergartens, the presence of a large percentage of old and dilapidated housing; uneven development within the region; low fertility, poor health care, low life expectancy, inadequate transport infrastructure, etc.
However, the above described rating confidently puts the Arkhangelsk region in 15th place (out of 80). Moreover, since 2005 the region has risen from 35 seats to as many as 20 positions. There is a dilemma: either the situation in the Arkhangelsk region, including the NAO, compared to what happens in other regions, relatively good or very insensitive rating and not Merit.
The benefit of the first statement can cause the following arguments::
-
1) With the start of oil and gas production in the Nenets Autonomous District, the Arkhangelsk region actually joins an elite group of Russian regions with resource extraction industry and metallurgical industry. This explains the increase in the income index from 0.7 in 2005 to 0,879 in 2009.
-
2) A number of the industrial regions with uncompetitive manufacturing industry because of the crisis in 2008 "kickbacks" from the top of the rankings, having failed to secure the index values at the level of the resource areas.
-
3) In the last decade in the Arkhangelsk region not conducted a large--‐scale modernization of the industry, the reform of education and health. However, such a situation is typical for almost all other regions, with the possible exception of the leaders (Moscow and St. Petersburg) and partly the Republic of Tatarstan, Tomsk Oblast, Krasnodar Krai.
-
4) Noted a general increase in the HDI for all Russian regions. So, in 2005, in regions with high HDI (more than 0,800) lived 17% of the population, in 2009 already 85%. Currently, Russia is left regions with low HDI (less than 0.700), although in 2005 they lived 19% of the population.
Thus, the high place of the Arkhangelsk region, including the NAO, the rating can be at--‐ tributed to the result of two main factors: the extraction of resources and the lack of the regional competitors, actively developing at the expense of industrial upgrading, development and innova--‐ tion.
We now consider the second part of the dilemma (whether Merit Rating?). As the study shows other sources of information and expert opinions, it is possible that the results obtained by analyzing the HDI does not fully reflect the real socio--‐economic situation in the region and give some "offset" ratings. It should be noted that any rating somehow distorts the holistic picture, showing only some fragments. The researcher's task is to analyze not only what rating shows, but also to try to explain that it does not show or shows is not entirely correct in view of the re--‐ striction.
Consider the main reasons for the possible distortion of the results of the HDI
First, the index is based on the regional average. It allows you to hide the asymmetry dis--‐ tribution estimated characteristics (for example, in the Arkhangelsk Region and Nenets Autono--‐ mous District) and smooths the differences. In particular, we can assume that if the Arkhangelsk Region and Nenets Autonomous considered separately, the results may significantly transformed. Arkhangelsk region is likely to move to another group of regions with lower rates (primarily an in--‐ dex value of income) and the Nenets Autonomous District is likely to come in the group of territo--‐ ries that have previously been classified as Chukotka Autonomous Okrug .
Secondly, the index operates very generalized aggregated indicators which does not de--‐ tail by taking into account the additional features that can more accurately assess the situation in the region (for example, unemployment rates, average wages, power mobility, state crime).
Third, the HDI is calculated and published with a considerable delay (about 2 years), ex--‐ plains the process of collecting and analyzing statistical information. This situation is typical for the majority of ratings, based on statistical data. However, the index is certainly not characterize the situation that has developed in the region, and one that was some time ago. The accuracy of these rankings is sharply reduced in the event of the political and socio--‐economic tensions and turbu--‐ lence. Also, due to some changes in the methodology for calculating the 2011 HDI inability to properly retrospective comparison of index values obtained in the regions in different years.
Conclusion
In general, the use of the methods IBP applied to the analysis of Russian regions based on the HDI values allows for more informative information about regional differences and analyze in more detail the problems.
Unfortunately, the index does not capture many important trends, giving estimates in a "blind" without "sighted" and in--‐depth analysis of positive--‐negative changes. Using the statistical data provided by the regional authorities, who are often interested in inflating the figures require additional verification. In foreign countries to check ratings, assessing their accuracy and reliability of specialized population surveys are conducted. In particular, we study how the region exhibited in assessment, such as for the quality of education or health care (10--‐point scale) corresponds to the value calculated indices. The reasons overstatement (understatement) analyzed characteris--‐ tics [2]. In Russia, this practice is virtually absent and the survey results are predictable in advance. Unconfirmed results ranking our own feelings is one of the main reasons for the skeptical attitude of Russians to such rankings.
Based on the analysis, we can conclude that, unfortunately, there is no simple and unam--‐ biguous connection between the situation in the field of education, health and the economy. As well as have a strong influence of high rates of economic growth on human development. How--‐ ever, we can not agree with the conclusions of the report's authors [2], claiming that "the greater the degree of security of human potential, the greater the ability of the national (and regional) economy to growth," the greater the hope that the revenue generated will be sent to his immedi--‐ ate purpose and closes logical circle: human potential provides state income and state develops and enhances human potential.
Список литературы The analysis of the level of the development of the Russian regions on the base of «human development index»
- Доклад о человеческом развитии 2013. Программа развития Организации Объединенных наций. Copyright by the United Nations Development Programme UN Plaza, New York, 2013. URL: http://hdr.undp.org/en/media/HDR_2013_RU.pdf (дата обращения: 12.07.2013).
- Доклад о развитии человеческого потенциала в Российской Федерации за 2011 г. Под редакцией А. А. Аузана и С. Н. Бобылева. М.: «Дизайн-проект «Самолет», 2011. 146 с.
- Российская Арктика: история, современность, перспективы. Материалы XV международного Соловецкого форума. Архангельск — Соловецкие острова, 2012. URL: http://narfu.ru/aan/SF/ (дата обращения: 12.07.2013).
- Социальный атлас регионов. URL: http://www.socpol.ru/atlas/overviews/social_sphere/ index.shtml (дата обращения: 12.07.2013).
