The assessment of the impact of the economy's development on air pollution

Author: Druzhinin Pavel V., Shkiperova Galina T., Potasheva Olga V., Zimin Dmitriy A.
Journal: Economic and Social Changes: Facts, Trends, Forecast @volnc-esc-en
Section: Environmental economics
Article in issue: 2 т.13, 2020.
Free access
The economic growth has a negative impact on the environment, that is why the development of models, which would reveal the influence of different factors on the change of the environment, is necessary. In order to study environmental and economic processes, a new approach was proposed, and special models, which allow assessing the impact of the investment policy and environmental activities, were created. It gives an opportunity to link the change of the environment with approved management decisions. The purpose of the article is to identify reasons that cause transformations of the interconnection between economic and environmental indicators, to study the impact of the change of environmental legislation and other external shocks on environmental and economic processes in the Russian Federation and the European Union on the example of air environment. The relevance and significance of this work is determined by changes of environmental legislation in the Russian Federation, which is currently based on the best available technologies (BAT), and the need to build models that would allow predicting the development of environmental and economic processes in changing interconnections of indicators within the emerging practice of applying new legislation. The novelty of the research is the development of models, which allow analyzing the impact of external shocks on environmental and economic processes, on the basis of the proposed approach. Empirical analysis of data was carried out, and models of environmental and economic processes were constructed. It turned out that the change of EU legislation did not lead to a sharp transformation of existing interconnections between economic and environmental indicators, which were associated with economic crises. Crises may contribute to the emergence of a new trend or just bring the system out of balance for a few years, but later its development will again be described by equations similar to pre-crisis ones. The study also allowed us to explain the improvement of environmental indicators with the growth of Russian and EU economies. Its results may be used in the development of strategic documents for the development of regions and countries. Further studies are related to the assessment of various scenarios for the development of regions of the European North of the Russian Federation.
Economic development, environmental protection investments, modernization, structural shifts, model, emissions of pollutants into the atmosphere, greenhouse gases
Short address: https://sciup.org/147225445
IDR: 147225445 | UDC: 330.15:502.335 | DOI: 10.15838/esc.2020.2.68.8
Text of the scientific article The assessment of the impact of the economy's development on air pollution
The development of the economy affects the state of the environment, but this influence may vary. The expansion of existing production facilities and the creation of new ones increase the impact on the environment, contributing to the deterioration of atmospheric air and water and the increase of the amount of generated waste. At the same time, structural shifts, associated with the emergence of new enterprises instead of closed ones with outdated technologies, modernization, re-profiling of organizations, and the transition to new technologies may reduce the negative impact on the environment.
Attention to the state of the environment contributed to the increase of interest to the development of models for the identification of factors that affect environmental processes and assess their impact on the environment. Initially, the IPAT identity approach was used, which allowed us to approximately estimate the impact of population dynamics, levels of the country’s development and its technological level [1; 2]. Later, T. Dietz, E. Rosa proposed stochastic STIRPAT model, which helps reveal and assess the impact of different factors more precisely [3; 4; 5]:
E i (t ) = A x p “ ( t) x Y' ( t ) x T’ ( t), (1) where E(t) — studied environmental indicator; Y(t) — indicator describing the degree of the economic development;
P(t) — population size;
T(t) — technological level;
i — country (region);
t — year;
-
а, в, Y - constants.
The technological level was usually determined through the amount of specific emissions. The degree of the economic development was characterized by a value of gross domestic product (GDP) per capita.
The proposed approach was developed, the theoretical justification of the model was clarified, and new countries and regions were analyzed. Equation (1) allowed increasing the number of factors and introducing other conditions that may have a noticeable impact on the environmental situation. First of all, the impact of the urbanization and changes of the economy’s structure – the share of industry, agriculture, services, and other industries – were studied.
The problem was the selection of an indicator that reflects scientific and technological progress. Various options were considered, for example, the energy intensity of industry and the share of the consumption of energy obtained from alternative sources [6]. Based on EU countries’ data, it was shown that innovation activities affect the level of carbon dioxide (СО2) emissions [7].
According to numerous foreign studies, the dependence of environmental pollution on GDP may have different forms, and it is mainly determined by the level of technological progress and the activity of structural changes in the economy. The influence of external shocks and different levels of fuel and energy prices were considered significant factors in some studies [8; 9].
In addition to the equation (1), other approaches were used. In the framework of the research of the Kuznets environmental curve (KEC), it was shown that the growth of urbanization may reduce the level of СО2 emissions with a high level of GDP per capita and a large share of service industries in GDP [10]. Close theoretical results were acquired by M. Mazzanti, A. Montini during the study of regional data in Italy [11]. However, the most noticeable contribution to the decrease of СО 2 emissions, as shown by G. Muller-Furstenberger and M. Wagner on the basis of special analytical model [12], is provided by the scientific and technical progress (transition to new technologies).
While studying KEC, S.N. Bobylev noted the connection between the level of income and the sustainable development [13]. In accordance with KEC hypothesis, it is assumed that the increase of output growth is accompanied by the growth of negative impact on the environment only until a certain threshold value (during an early period), then the level of pollution begins to decrease, despite continuing economic growth. Calculations, based on Russian data, showed that the interconnection between the gross regional product (GRP) and emissions of pollutants into the atmosphere is described by KEC only for, approximately, twenty regions of the Russian Federation. Main factors, contributing to the reduction of the environmental burden, were the active modernization of production facilities and structural changes of these regions’ economy [14].
To a large extent, the decrease of the environmental burden in Russian regions in the 2000s was caused by the rapid growth of the service sector and the reduction of the share of industry, which was the main polluter [15]. I.A. Zabelina, while studying regions bordering fast-growing China, identified the presence of the decoupling effect in the negative impact on atmospheric air in most regions [16].
Due to climate changes occurring in recent decades, the attention is focused on greenhouse gas emissions, primarily СО2. Dynamics of atmospheric air and water pollution by other substances is analyzed less often. It should be noted that the results for various pollutants significantly differ.
Most studies of greenhouse gases are conducted on the basis of panel data from countries with different development levels; only a part of them covers countries situated on one continent or macroregion. Studies for 214 countries showed that the degree of the factors’ impact depends on the level of GDP per capita, and the signing of the Kyoto protocol is important for countries with high incomes, except the number of population, the share of industry in GDP, and energy efficiency of the economy [17]. In 45 African countries, the economy of which is related to extractive sector, besides GDP per capita, energy intensity and, in some cases, the level of industrialization, the level of urbanization, and the number of ablebodied population are important [18].
In many studies, the impact of the population growth turned out to be significant. 1% population growth leads to the increase of emissions by more than 1% [5; 19; 20; 21]. At the same time, it should be noted that parameter values, obtained by different authors, vary; it depends on the selection of studied indicators. For example, B. Liddle [6] notes that maximum values were obtained, when demographic indicators were used as additional indicators. While using the share of industry or the energy intensity of the economy as characte-ristics of the technological level, the significance of the population was significantly less.
There are other differences: for developed countries, the share of able-bodied population negatively affects overall CO2 emissions, and, at the same time, this impact is positive for other countries [22]. The influence of urbanization is also controversial. In P. Sadorsky’s review, it is noted that, in developing countries, its growth causes the increase of emissions, and such impact is statistically important [23].
There are significantly fewer studies on regional data, and most studies analyzed Chinese regions [24; 25; 26]. It was shown that the most important factor for reducing СО2 emissions was the change of the technological level and the industry’s structure [27]. In some studies, regions were divided into groups depending on their characteristics, such as the level of GRP per capita. In the group with the highest GRP per capita, the energy-related factor became the determining one, in the middle group – factors of urbanization, industrial structure, and external trade, in the third group – the dynamics of the population and GRP per capita [28].
Slightly different results were obtained in the work of V. Lantz, Q. Feng [9] while assessing data across Canadian regions. Here, there is no dependence of greenhouse gas emissions on GRP; the largest impact is caused by the number of population, the technological level, the share of exports and imports, the share of industry in the structure of the region’s economy, and the price of crude oil. The situation varies in countries and regions even in terms of gas only.
There are fewer studies on the dynamics of other gases’ emissions into the atmosphere. They show that research and development expenditures and other indicators, related to the technological progress, significantly affect the emissions of sulfur and nitrogen compounds [10; 29]. J. Kramer established the dependence of the dynamics of SO2, nitrogen compounds, and solid substances emissions on the population in California [30].
G. Marin and M. Mazzanti [31], using panel data, showed that, in different spheres of Italian economy, the interconnection between the anthropogenic impact and the economic growth differs, decoupling effects and increased emissions into the atmosphere with increased production volumes are possible. Scientists confirmed the hypothesis on the growth of the environmental burden as the volume of manufacturing production increases. They identified the most problematic sectors of the economy according to the level of this burden.
There are not enough studies exploring the impact of the economic development on the environment according to time series of a single country or a region. For example, in Chinese regions Guangdong and Minhang, the most significant factors were the urbanization level and technological level associated with energy consumption per GRP unit, as well as the level of industrialization, the share of services in GRP, the number of population and GRP per capita [25; 26].
Even fewer works touch upon the effectiveness of the environmental policy. Greek researchers G. Halkos and E. Paizanos used panel data of 77 countries for 1980–2000 to show the direct and indirect impact of government expenditures on the environmental protection, and the efficiency of expenditures for different types of pollution differ greatly [32].
Among all factors, the impact of the investment policy and environment protective activities is less studied. Only some works examine the connection between investments in environmental protection and pollution [33; 34; 35]. During the construction of dependencies, it was usually assumed that they do not change over time, and they do not have external shocks – global economic crises, changes in legislation, and others. In some countries, scientists begin to review the impact of changes in legislation on environmental and economic processes (for example, R. Almgren in Sweden), but there is no work on its assessment on the basis of models [36].
To study environmental and economic processes in the Russian Federation and its regions, an approach was proposed in which three groups of factors are identified for the analysis of changes in dependencies over time: those that affect the environment negatively, positively, and factors which may have a positive and negative impact. Special models were constructed: it allowed to link the structure and dynamics of investments with dynamics of various types of pollution according to the data of the Russian Federation and its regions, revealing the influence of economic policy and economic crises on changes in environmental and economic interdependencies [37; 38]. The novelty of the proposed approach is related to the fact that the study of time series on the basis of these models makes it possible to assess the impact of various external shocks on changes of existing trends and interconnections.
The purpose of the article is to identify reasons that cause transformations of the interconnection between economic and environmental indicators, to study how changes of the environmental legislation and other external shocks are related to environmental and economic processes in the Russian Federation and the European Union on the example of air environment. The following objectives were solved: the collection of information on environmental and economic processes in the RF and the EU, including changes in the legislation; the development of models for accounting the impact of external shocks, including changes in the legislation and economic crises; the assessment on the basis of models of external shocks’ impact on the relationship between economic and environmental indicators.
The relevance and significance of the conducted research are determined by the change of environmental legislation in the Russian Federation, which is based, at the moment, on best available techniques (BAT), the need to build models that would predict the development of ecological and economic processes in transforming interconnections of indicators within the implementation of the new legislation. The proposed approach helps to analyze possible environmental consequences of the economic development, to build scenario conditions based on special models and to compare the impact of various economic policy options on the environment, to make more reasonable forecasts during the development of strategic documents, and to analyze various options for the investment policy and regional development.
Methodology and data
In addition to existing models (1), pollution functions were proposed. They allow us to explore different investment distribution options, to assess the impact of changes in the structure of the economy, and to take into account the impact of the environmental policy, considering the dynamics of investments and costs associated with the environmental protection. We used specific indicators of Russian statistical reports that allow analyzing in detail the impact of the investment structure on environmental and economic processes with the adaptation for international report.
Various functions were used for time series calculations. Sometimes they were quite complex, but more often simple two-factor or three-factor multiplicative functions, which allow considering the possibility of compensating one factor for another, were used:
E(t) = A(t) x X*0) x X^^ (t) , (2)
E ( t ) = A ( t ) x X 1 A ( t ) x X 2 -n ( t ) x X 3 ( t ) , (3)
where E(t) — studied environmental indicator (emissions of pollutants into the atmosphere, concentration of pollutants, ratio of atmospheric emissions to GDP, and other indicators);
-
X 1 (t) — a factor that reflects economic growth and, as a rule, negatively affects the environment (investments in a new construction, GDP, GRP, fixed assets, and other indicators);
X , (t) — a factor that reflects environmental protection activities and has a positive impact on the environment (investments in air protection, current costs of air protection, its amount, and other indicators);
X 3 (t) — a factor that reflects the development of the economy, which can have a positive or negative impact on the environment, depending on the environmental and economic policy (investments in the economic modernization, the index of structural shifts in the economy, and other indicators);
A(t) — neutral environmental progress, usually an exponent with parameter p (the reduction of pollution levels at the expense of factors which were not taken into account in the equation, structural shifts first of all);
-
m, h, v — constant parameters (factor elasticity); t — year.
Calculations were based on standard packages using the method of least squares.
The introduction of a neutral environmental progress A(t) is required for better accounting of structural shifts and sectoral modernization in the absence of detailed information on sectors. If it is available, it is easy to estimate the rate of neutral environmental progress p , highlighting the impact of the modernization in sectors and structural shifts according to previously derived formulas [37; 38].
The difference between collected statistical information in the Russian Federation and the EU led to the necessity to develop a separate methodology for constructing pollution functions for the EU. There are indicators in Russian statistics that reflect investments in the modernization of enterprises, but they are not available in the EU. Therefore, the approach, based on changes of the investment structure and dynamics of investments into machinery and equipment, was used to assess the impact of the economic modernization. The technological level was linked to the dynamics of labor productivity and other indicators of sectors that contributed the most to the total volume of pollution. To assess the impact of structural shifts, the approach based on changes of the ratio of sectors with the highest and lowest environmental impact or the share of the sector with the highest level of pollution was proposed.
The choice of the type of dependency was determined by a preliminary data analysis and the construction of graphics, which allowed us to identify existing connections between indicators or their characteristics, such as growth rates. We analyzed the presence of lagging changes of indicators and studied smoothed data. The choice of factors also depended on the availability of data and the opportunity to get quite long time series. Cumulative investments over the last 3–6 years were used for calculations, which facilitated the usage of pollution functions for forecasting.
Constructed functions allow investigating changes of environmental indicators under different economic policies in the process of evaluating the dynamics of the production output, based on production functions under different scenarios. It also possible to assess the impact of changes of the environmental policy by setting different dynamics of environmental investments and environmental expenditures on nature protection activities. Based on the experience of countries with existing BATbased laws, the dynamics of environmental expenditures and investments in the production modernization may be linked to changes of environmental legislation in the Russian Federation. For this purpose, data for the EU and Finland were studied.
The analysis of environmental and economic processes showed that current trends sometimes change rapidly under the influence of external shocks, the connection of pollution with some indicators remains stable, and it changes significantly with others. In this case, it is advisable to use a spline function that is a continuous one, but it has a gap of the first derivative.
Two approaches were used. The first one underlined the year of the change of environmental legislation and analyzed the graphs of indicators and their inter-connections. If there was the fracture of existing trends or the transformation of the interconnection between indicators within a few years after the change of legislation, two periods were distinguished, and the spline function was calculated. The second approach was used to construct graphs of interconnections between indicators and the dynamics of their ratios. The analysis revealed the year when current trends changed, two periods were identified, and calculations of the spline function were performed. If parameters obtained over different periods differed slightly, then the function (3) was constructed instead of the spline function (4).
For calculations, studied indicators were divided into two rows (in the first period, values of the second row are equal to one, in the second one – values of the first row are equal to one). While selecting two periods, each of them can have its own parameters, and, instead of function (3), calculations were performed using the following function:
E( t) = A x A2 x Xn ^ (t) x X 12 ^ (t) x. ,(4)
-
V Y -П — П 2 V 1 V 2 X
^x -^x 21 ( t) x. .^x 22 ( t) x. .^x 3i (t) ^^ -^ x 32 (t)X- -^ x 4 ( t)
where A1, X 11 (t), X 21 (t), X 31 (t) are equal to one in the second period;
A 2 , , X |2 (t), X 22 (t), X 3 2 (t) are equal to one in the first period;
X 4 (t) — indicator showing structural shifts.
Some calculations were performed using an incomplete formula. For example, the indicator A2 was always equal to one, or obtained parameters for one of indicators were close, and, for it, not two rows were reviewed, but one common, and, accordingly, only one parameter was obtained.
For calculations, we collected data for the Russian Federation, its regions, the EU, and Finland for 1990–2017, which allowed building and analyzing graphs of indicators and identifying their dependencies. To analyze changes of the environment’s state, we used data for the following key indicators: greenhouse gas emissions, general and substances’ individual emissions of pollutants into the atmosphere, the number of population, the level of urbanization, the share of industry in GDP (GRP), the share of services in GDP (GRP), the level of electricity consumption, the volume of exports, the dynamics of main economic sectors, investments in machinery and equipment, etc.
Calculations’ data for the Russian Federation and its regions were taken from the FSSS1 website and statistical reference books2, data for EU calculations – from the official website of the Eurostat3, and for Finland – from the Statistics Finland website4.
Since collected indicators vary in countries, environmental indicators, available in international statistics, were chosen for comparison whenever possible. It should be noted that methodologies change, and comparable series of some data are not given in reference books. In this case, they were recalculated using the information available on websites.
We collected information about changes of environmental legislation in the Russian Federation, the EU, Finland and analyzed information on environmental activities. On its basis, periods, in which the parameters of functions (2) – (4) should have been stable, were distinguished, and the influence of economic crises was reviewed. As a result, spline functions were built in order to consider the role of external shocks.
Results of the research and its analysis
Environmental legislation of European countries was constantly improved and tightened. In the EU, in 1975–1984, there was the introduction of directives to fight air and water pollution, to management wastes. Later, it was clarified and supplemented. In 1996, the UE Council Directive 96/61/EC, concerning integrated pollution prevention and control, was adopted5. Unlike the first directives, aimed at controlling pollution, it was introduced to prevent pollution, and it regulated the usage of BAT. The Directive was supplemented in 2000 and 2004. It was replaced with a new Directive in 2010 – Directive 2010/75/EU of the European Parliament and of the Council “On industrial emissions”6, which was also supplemented and clarified in 2012. The EU members’ legislation changed in accordance with directives, but with some lags.
The first Environmental action program was adopted in the EU in 1973. It focused on protecting and reducing atmospheric pollution. For the first time, the need to apply environmental taxes was stated. Since 1993, the fifth program, aimed at achieving the sustainable development goals, was active, the
Figure 1. Dynamics of the ratio of СО2 emissions to EU countries’ GDP, million tons / billion euros
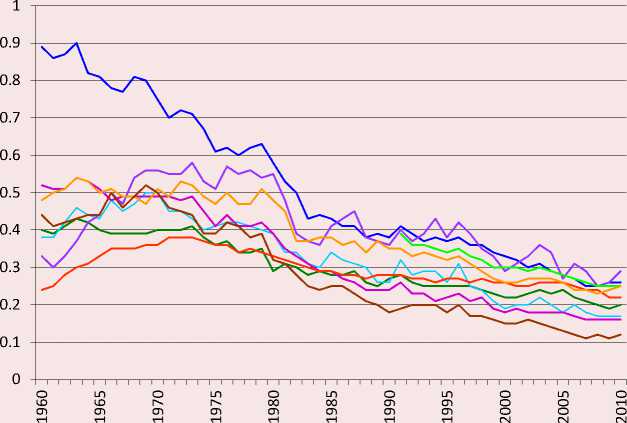
Austria
Belgium
Denmark
Finland
France
Germany
Italy
Netherlands
Sweden sixth one was adopted in 2002, and the seventh program has been in operation since 2013. Each of them set new environmental goals, defined strategic approaches to its solution, and new legislative initiatives.
In the middle of the 1990s, the share of environmental taxes in the EU GDP exceeded 2%, and, in the Nordic countries, it was significantly higher: in Finland – 2.5%, Sweden – 3.2%, Norway – 4.9%. In recent years, environmental taxes in the EU accounted for 2.5% of GDP, these are primarily energy taxes. In some countries, taxes are reducing at the expense of using renewable energy sources.
If we look at the period until 1990, most EU countries’ emissions of pollutants had been increasing until the mid-1970s – even faster than the growth of their economies. Later, the growth began to slow down, and, since the 1980s, for certain types of pollution, the volume of emissions began to decrease with the growth of the economy (Fig. 1). The implementation of the first program in the 1970s led to significant changes in the EU environmental policy: foundations of a real policy were formed, goals, principles, priorities, and measures, which needed to be implemented, were defined. In fact, the period of 1960–1990 is described by the KEC for some countries. The tightening of the environmental policy led to the change of technologies and contributed to the intensification of structural shifts in the economy.
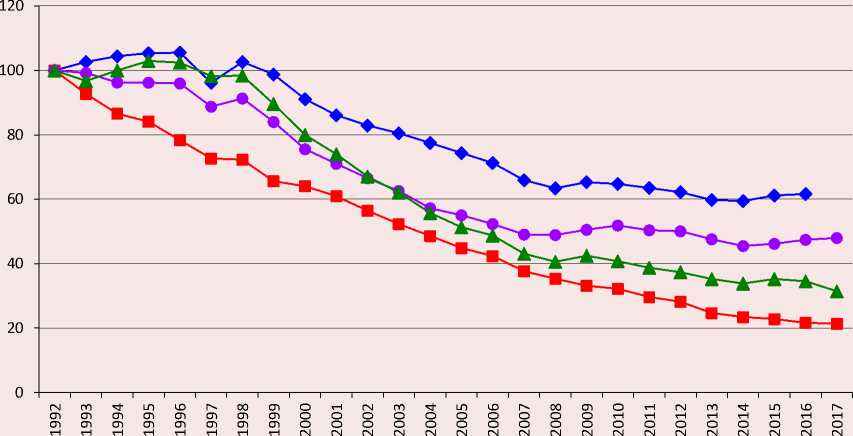
The detailed analysis of data since 1990 shows that almost all types of emissions have positive trends. In other words, if the economy grows, the amount of pollutants’ emissions decreased ( Fig. 2 ). After the adoption of the 1996 defining directive, the dependence of emissions on the dynamics of GDP did not exactly change. Trends continued until 2007. Only greenhouse gas emissions decreased a little bit, but later they achieved previous levels. In 2008, the economic crisis began. It broke existing trends, and the productions decreased, approximately, by 5%; emissions decreased too. In 2014, GDP of the EU exceeded 2007–2008 levels, and the level of pollution was noticeably higher. The production in crisis times was “greener”. It needs to be mentioned that, since
Figure 2. Dependence of pollutants’ emissions into atmosphere (1990 – 100%) on the dynamics of the EU GDP (1990 – 100%)
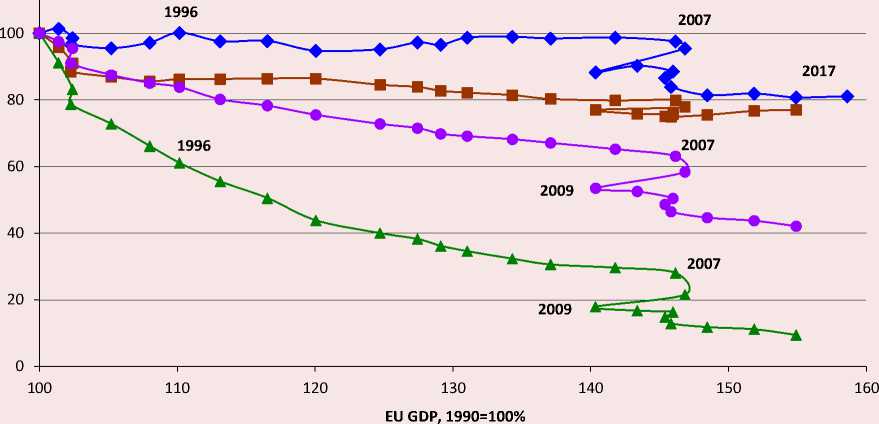
— ♦ — Greenhouse gases — ■ — Ammonia —с— Nitrogen oxide —*— Sulfur oxide
2010, 1990–2007 trends basically continued, but the level of pollution was lower. Once again, greenhouse gases are exceptions: since 2010, their emissions noticeably decreased. It means that it is possible to construct spline functions using two A parameters for different periods without changing other indicators.
If we review the dynamics of the ratio between the pollution volume and the EU GDP, it is noticeable that, after the adoption of the 1996 Directive, rates of its decrease did not accelerate. Instead, since 2000, the slowdown of positive trends has been going on ( Fig. 3 ). The 2008–2009 economic crisis led to insignificant changes in the existing situation. We may note certain decrease of greenhouse gases’ emissions after the adoption of 1996 and 2010 Directives. The analysis with the usage of spline functions did not reveal significant changes of parameters in 1996–2007.
According to the EU data, dependences of emissions on aforementioned factors were constructed using models (3) and (4). Fairly good statistical characteristics were obtained for all three approaches – general calculations for 1993–2016, calculations of spline functions with the allocation of different A indicators for two periods, and calculations of spline functions, shown in table 1, with the allocation of two periods for all indicators. All equations are significant, p is less than 0.000001. It can be used to predict environmental and economic processes, but more reliable results are obtained when the ratio of emissions to GDP is used as a dependent variable.
For sulfur and nitrogen oxides, cumulative investments in the economy in the second period reflected the negative impact of the economic growth, cumulative investments in machinery and equipment reduced emissions in both periods, and overall environmental protection expenditures had a significant positive impact in the second period. The difference for greenhouse gases is that
Figure 3. Dynamics of the relation of polluting substances’ emissions to the EU GDP (1990 – 100%)
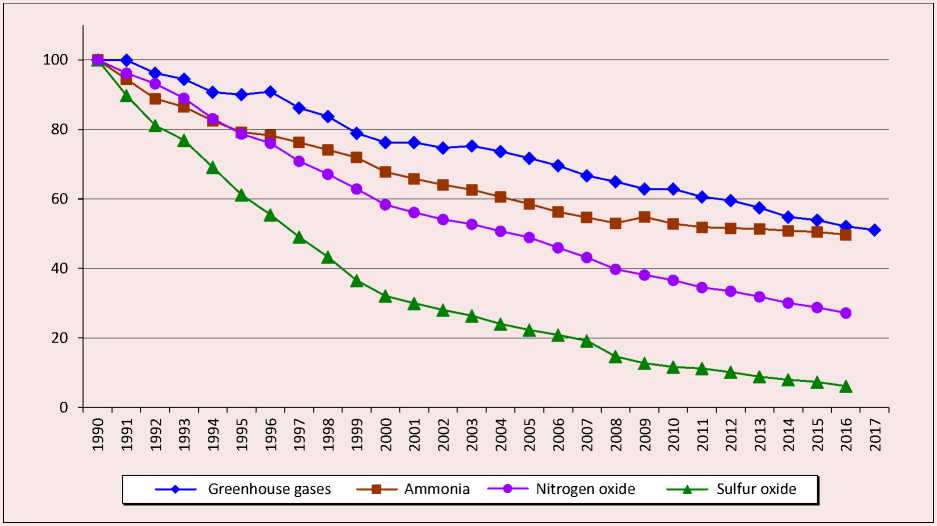
Table 1. Results of calculations of parameters of functions (4) for emissions of pollutants in the EU
|
Pollutant |
m 1 |
m 2 |
h 1 |
h 2 |
ν 1 |
ν 2 |
λ |
lnA |
R2 |
|
Greenhouse gases |
1.28* |
2.78* |
0 |
0.86* |
-0.93* |
-2.12* |
0.89* |
2.96 |
0.988 |
|
Ammonia |
0.19* |
0.44* |
0 |
0 |
0 |
0.51** |
4.1 |
0.957 |
|
|
Nitrogen oxides |
0 |
13.8* |
0 |
4.34* |
-1.69* |
-11.1* |
0 |
11.17 |
0.994 |
|
Sulfur oxide |
0 |
5.43* |
0 |
1.85* |
-0.57* |
-4.13* |
0 |
6.83 |
0.990 |
|
* p<0.01, ** p<0.05 |
|||||||||
cumulative investments in the economy had a significant impact in the first period. Structural shifts, which were reflected by the share of industry in GDP, were also important. For ammonia emissions, cumulative investments in the economy, total expenditures on environmental protection in the first period, and the share of industry in GDP were significant. Calculations showed that there were no other changes in current trends, except for 2008, when the economic crisis began.
In Finland, after joining the EU in 1996, the Law on nature protection was adopted, which entered into force on 1 January 1997, and it is still active today. Based on the EU Directive of 1996, Finland amended its current legislation in 2000. In 2014, the legislation was amended in accordance with the 2008 and 2010 EU Directives. Finland joined the EU in 1995, when the fifth environmental action program “Towards sustainability” was implemented in the EU, and the EU adopted the concept of the sustainable development. Finland has consistently tightened environmental requirements in accordance with the EU decisions [39].
When Finland recovered from the 1991– 1993 crisis, caused by the loss of the “eastern” market due to the collapse of the USSR, emissions of pollutants slowly decreased with the growth of GDP. The ratio of emissions to GDP continuously decreased, except for the early 2000s ( Fig. 4 ). Only the amount of
Figure 4. Dynamics of the ratio of air pollutants to Finland’s GDP (1990 – 100%)
— ♦ — Greenhouse gases ■ CO —С)— Nitrogen oxide —*— Sulphur dioxide
greenhouse gas emissions noticeably fluctuated due to unexplained spikes of CO2 emissions in, for example, 2005. In 2004 and 2006, its levels were almost equal. It should be noted that the period since 1994 is well described by the exponential function for most types of pollution.
In dynamics, relations of pollutants’ emissions to GDP and legislative changes had a weak impact. Noticeable increase was not shown, only its decrease in 2001–2003 might be noticed. At the same time, despite 2008– 2009 economic crisis, the improvement of the environmental situation continued, the ratio of emissions and GDP decreased and continued existing trends.
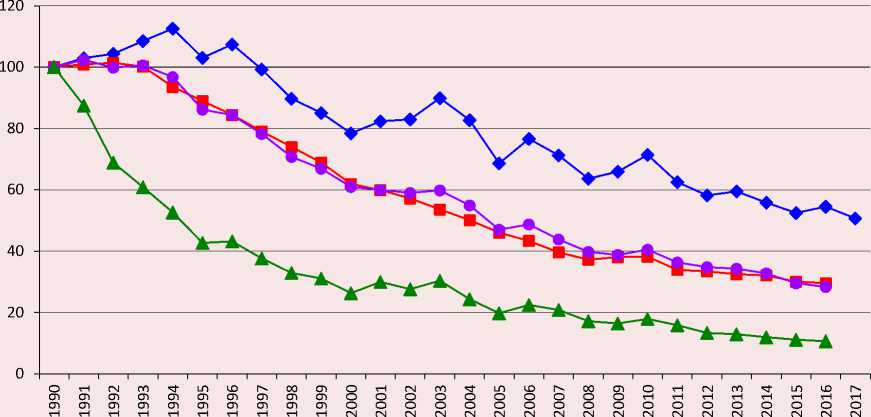
The dependence of polluting emissions on GDP is much more complicated due to the 2008 economic crisis (Fig. 5). Since 1994, emissions have been slightly decreasing with the GDP growth, but, in 2001–2003, the economic growth slowed, and most types of emissions increased slightly. There may have been problems with the transition to BAT in accordance with the EU Directive of 1996. The 2008 crisis led to a long-term stagnation of the Finnish economy; the pre-crisis level of GDP was exceeded only in 2018. At the same time, structural shifts and investments in the economy have contributed to the continued reduction of polluting emissions. In fact, there are two periods – 1994–2008 and 2008–2017 – with distinctly different dependencies.
Calculations were made for emissions of major pollutants (general for 1994–2017 and spline functions) and for the ratio of emissions to GDP. All obtained equations are significant, p is less than 0.000001. Table 2 shows calculations’ results for spline functions (4). Calculations according to spline functions significantly improve statistical characteristics of functions (3). It should be noted that, if a part of function parameters did not change in two periods for the EU and Russia, for Finland, the difference was significant, the impact of environmental investments in the first period
Figure 5. Dependence of atmospheric emissions of pollutants (1990 – 100%) on Finland’s GDP (1990 – 100%)
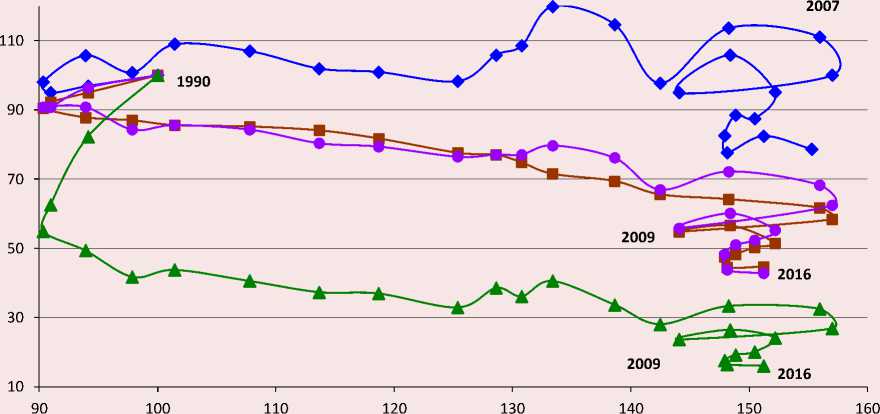
Finland GDP
—•— Greenhouse gases — ■ — CO —•— Nitrogen oxide — ▲ — Sulphur dioxide
Table 2. Results of calculations of parameters of functions (4) for emissions of pollutants in Finland
|
Pollutant |
m 1 |
m 2 |
h 1 |
h 2 |
ν 1 |
ν 2 |
lnA 1 |
lnA 2 |
R2 |
|
Greenhouse gases |
0.124** |
0.456* |
0 |
0.463* |
0 |
0 |
4.07 |
0.80 |
|
|
СО |
1.518* |
0.666* |
0 |
0.481* |
-0.810* |
0 |
2.96 |
0.97 |
|
|
Sulfur oxide |
1.894* |
0 |
0 |
1.342* |
0 |
0 |
-2.64 |
9.18 |
0.93 |
|
Nitrogen oxide |
0.979* |
0.801* |
0 |
0.536* |
-0.185* |
0 |
1.93 |
0.96 |
|
|
* p<0.01. ** p<0.1 |
|||||||||
turned out to be insignificant, and, in the second, it significantly influenced the reduction of all emissions.
For greenhouse gases, in the first period, only the impact of GDP was significant, and, in the second – industry and environmental investments’ impact. For carbon monoxide, sulfur oxides, and nitrogen, in the first period, the impact of changes in the share of industry in GDP was significant, for carbon monoxide and nitrogen oxides, the growth of investments in machinery and equipment had a positive impact, and, in the second period, the dynamics of pollution was determined by changes of industrial production and environmental investments.
The law “On Nature Protection in the RSFSR” was adopted in 1960, the current legislation was formed in 1988–1991, and it was clarified in the future. In 1994, 1996, 1997, and 2000, Presidential Decrees on certain areas of environmental policy were issued. In 1999, the law “On the Protection of the Atmospheric Air” was adopted, and, in 2002, the law “On Environmental Protection”, which had a clarifying nature, was also adopted.
In the 1990s, there was a state program for environmental safety and almost 30 programs for solving certain environmental problems. In 1998, The National Environmental Action Plan for the Russian Federation was adopted; in 2002, “Ecological Doctrine of the Russian
Federation” was approved, and the federal target program “Ecology and Natural Resources of Russia for 2002–2010” began to operate. Now, the state program “Environmental Protection” for 2012–2020 is relevant.
The most noticeable changes occurred in 2014, when the law “On Amendments to the Federal Law “On Environmental Protection” and Certain Legislative Acts of the Russian Federation” was adopted, which determined the transition to the introduction of a system of economic incentives for the implementation of BAT. It may significantly affect environmental and economic processes in the future, and, in the meantime, starting in 2019, 300 enterprises, which are main pollutants, will report according to BAT criteria.
The analysis of graphs shows that, after the recession in the 1990s, with the growth of the economy after 1999, emissions of most pollutants began to grow, but the process was slower than GDP growth ( Fig. 6 ). We may distinguish three periods: before 1999, from
1999 to 2008, when the ratio of pollution to GDP of the Russian Federation was rapidly declining, and from 2009. They are separated by economic crises of 1998 and 2008–2009. There was no positive impact of new laws and other documents, adopted in 2002 and 2006.
The dependence of emissions on the dynamics of Russian GDP is more complex. It should also be noted that the second and third periods do not differ much ( Fig. 7 ).
For the Russian Federation, there is an additional information on investments into the modernization. The first period was not reviewed; calculations were made for the second (1998– 2007) and third (2008–2017) periods and for 1998–2017 in general. Calculations for spline functions (4) significantly improve statistical characteristics in relation to functions (3); all obtained equations are significant; p is less than 0.000001 ( Tab. 3 ). For the Russian Federation, changes of the economic policy were significant. It was associated with the beginning of the economic growth in 1999 and the 2008–2009 crisis.
Figure 6. Dynamics of the ratio of polluting substances’ emissions to GDP of the Russian Federation (1992 – 100%)
— ♦ — Greenhouse gases ■ Solid substances —•— Nitrogen oxide ▲ Sulphur dioxide
Figure 7. The dependence of atmospheric emissions of pollutants (1992 – 100%) on GDP of the Russian Federation (1992 – 100%)
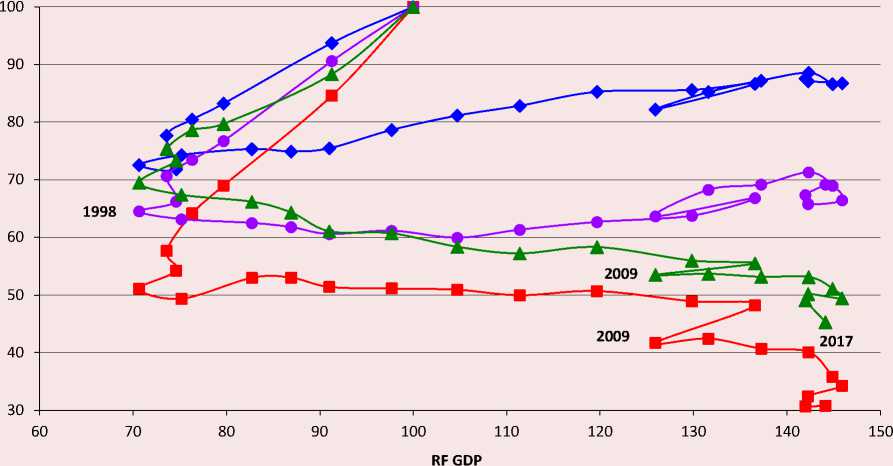
— ♦ — Greenhouse gases ■ Solid substances • Nitrogen oxide —*— Sulphur dioxide
Table 3. Results of calculations of parameters of functions (5) for emissions of pollutants in the Russian Federation
|
Pollutant |
m 2 |
m 3 |
h 2 |
h 3 |
ν 2 |
ν 3 |
lnA 2 |
lnA 3 |
R2 |
|
Greenhouse gases |
0.857* |
0.162*** |
0 |
-0.239* |
-0.108* |
0.61 |
1.89 |
0.910 |
|
|
Solid particles |
0.177*** |
0 |
0 |
0.869* |
-0.172*** |
0 |
4.77 |
8.13 |
0.905 |
|
Sulphur dioxide |
0 |
1.004* |
0 |
0.51* |
-0.144* |
0 |
5.30 |
2.28 |
0.945 |
|
Nitrogen oxide |
0.412* |
0.524* |
0.198* |
-0.214** |
0 |
5.03 |
2.89 |
0.911 |
|
|
* p<0.01. ** p<0.05. *** p<0.1 |
|||||||||
For greenhouse gas emissions in the second period, the growth of cumulative investments in air modernization and protection partially offset the impact of GDP growth, and, in the third period, the impact of investments in air protection became insignificant. For solid particles atmospheric emissions in the second period, the impact of investments in modernization was the most significant (its growth stabilized emissions by three times), and, in the third period, the growth of investments in air protection contributed to a sharp decrease of emissions. For sulfur dioxide, the decrease of emissions in the second period is associated with the increase of investments in the machinery and equipment, and, in the third – investments in air protection with a significant negative impact of investments in new constructions. In the second period, the decrease of nitrogen oxide emissions gradually turns into the growth, which is associated with the increase of investments in new constructions and fluctuations of investments in air protection. In the third period, the increase of emissions continued for some time. It was going on until investments in air protection began to grow with the small GDP increase.
Since the end of the 1990s, investments in the Russian economy and the share of investments in economic modernization have increased rapidly. New enterprises were built on the basis of modern technologies, the structure of the economy shifted towards the service sector, which helped to reduce the impact on the environment.
Calculations showed that the interconnection between economic and environmental indicators changed significantly during economic crises. It indicates that obtained dependencies may only be used for short-term forecasts. Better results were obtained when the ratio of emissions to GDP was used as a dependent variable. Calculations, based on data from Karelia and other regions, also showed that changes in the interconnection between economic and environmental indicators occurred during economic crises.
Conclusions
The conducted research allowed explaining reasons of worsening environmental indicators with the economic growth, revealing factors that lead to the improvement of the environment, and quantitatively assessing their influence. The most important were investments in modernization of the Russian Federation and the growth of investments in the machinery and equipment of the EU countries, which is also associated with active economic modernization. In the Russian Federation, structural shifts had a great impact, because the development of the Russian economy in the 21st century was carried out on a new technological basis, and the share of new sectors of the economy increased. As the result, the rapid growth of the economy in the 2000s occurred with a slight decrease of environmental pollution, and the economic downturn after 2010 was accompanied by an even greater decrease of certain types of pollution – carbon monoxide and solid substances in particular.
It should also be noted that the dynamics of environmental indicators in the Russian Federation, the EU, and Finland are similar, although the level of pollution per GDP unit is quite different. Factors that determine the dynamics of pollution are the same in most cases, but the degree of their influence is different.
Since global warming is considered to be the most important issue for the EU, the changes in EU legislation were primarily aimed at reducing greenhouse gas emissions. Even though greenhouse gas emissions decreased less than emissions of other substances, it was possible to avoid its growth.
The analysis of data for the Russian Federation showed that most air pollutants were mainly affected by changes of economic policy. Environmental legislation in the Russian Federation has not transformed much, and the implementation of decisions that could significantly affect activities of enterprises was postponed.
Studies show that changes of legislation in the EU did not lead to a sharp change of existing interconnections between economic and environmental indicators, and this influ-ence is not instantaneous, it stretches over several years. After the analysis, we can say that the transition to new legislation in the Russian Federation will be gradual, standards will slowly tighten, and trends of the inter-crisis period will retain. It is possible to predict the interconnection between economic and environmental indicators on the basis of proposed models.
Sharp and rapid changes of existing trends are associated with economic crises, which may lead to the emergence of a new trend or to put the system out of balance for a few years, and then its development will again be described by equations similar to pre-crisis ones.
References The assessment of the impact of the economy's development on air pollution
- Ehrlich, P.R., Holdren, J. Impact of population growth. Science, 1971, no. 171, рр. 1212–1217.
- Commoner, B., Corr, M., Stamler, P.J. The causes of pollution. Environment: Science and Policy for Sustainable Development, 1971, no. 13 (3), рр. 2–19.
- Dietz T., Rosa E.A. Rethinking the environmental impacts of population, affluence, and technology. Human Ecology Review, 1994, vol. 1, pp. 277–300.
- Dietz T., Rosa E.A. Effects of population and affluence on CO2 emissions. Proceedings of the National Academy of Sciences USA, 1997, vol. 94 (1), pp. 175–179.
- York R., Rosa E.A., Dietz T. STIRPAT, IPAT and ImPACT: analytic tools for unpacking the driving forces of environmental impacts. Ecological Economics, 2003, vol. 46 (3), рр. 351–365.
- Liddle B. What are the carbon emissions elasticities for income and population? Bridging STIRPAT and EKC via robust heterogeneous panel estimates. Global Environmental Change, 2015, vol. 31, рр. 62–73.
- Gilli M., Mancinelli S., Mazzanti M. Innovation complementarity and productivity effects: Reality or delusion? Evidence from the EC. Ecological Economics, 2014, vol. 103, рр. 56–67.
- Fried B., Getzner M. Determinants of CO2 emissions in a small open economy. Ecological Economics, 2003, vol. 45, рр. 133–148.
- Lantz V., Feng Q. Assessing income, population, and technology impacts on CO2 emissions in Canada: where’s the EKC? Ecological Economics, 2006, vol. 57, рр. 229–238.
- Chikaraishi M, Fujiwara A., Shinji Kaneko S., Poumanyvong P., Komatsu S., Kalugin A. The moderating effects of urbanization on carbon dioxide emissions: A latent class modeling approach. Technological Forecasting and Social Change, 2015, vol. 90, рр. 302–317.
- Mazzanti M., Montini A. Embedding the drivers of emission efficiency at regional level - Analyses of NAMEA data. Ecological Economics, 2010, vol. 69, рр. 2457–2467.
- Müller-Fürstenberger G., Wagner M. Exploring the environmental Kuznets hypothesis: Theoretical and econometric problems. Ecological Economics, 2007, vol. 62, рр. 648–660.
- Bobylev S.N. The relationship between welfare and sustainable development. Kuznets curve. Sotsial’noekonomicheskii potentsial ustoichivogo razvitiya [Socio-Economic Potential of Sustainable Development]. Sumy: Universitetskaya kniga, 2007. Pp. 134–159.
- Postnikov V.P. The analysis of atmospheric air pollution: national and regional aspects. Vestnik Volgogradskogo gosudarstvennogo universiteta. Seriya 3: Ekonomika. Ekologiya=Science Journal of VolSU. Global Economic System, 2014, no. 1, pp. 117–124. (in Russian)
- Glazyrina I.P. Studying the quality of economic growth in the context of Sustainable Development Concept. Ekonomika prirodopol’zovaniya=Environmental Economics, 2006, no. 4, pp. 21–31. (in Russian)
- Zabelina I.A. Decoupling in environmental and economic development of regions-participants of cross-border cooperation. Ekonomicheskie i sotsial’nye peremeny: fakty, tendentsii, prognoz=Economic and Social Changes: Facts, Trends, Forecast, 2019, vol. 12, no. 1, pp. 241–255. DOI: 10.15838/esc.2019.1.61.15 (in Russian)
- Bargaoui S., Liouane N., Nouri F. Environmental impact determinants: An empirical analysis based on the STIRPAT model. Procedia – Social and Behavioral Sciences, 2014, vol. 109, рр. 449–458.
- Asane-Otoo E. Carbon footprint and emission determinants in Africa. Energy, 2015, vol. 82, рр. 426–435.
- Rosa E.A., York R., Dietz T. Tracking the anthropogenic drivers of ecological impacts. AMBIO: A Journal of the Human Environment, 2004, vol. 33, рр. 509–512. Available at: http://res.ku.edu/~crgc/NSFWorkshop/Readings/ TrackingTheAnthropogenic%20Drivers.pdf (accessed: 03.11.2017).
- York R. De-carbonization in former Soviet republics, 1992–2000: The ecological consequences of de-modernization. Social Problems, 2008, vol. 55, is. 3, рр. 370–390.
- Cole M.A., Neumayer E. Examining the impact of demographic factors on air pollution. Population and Development Review, 2004, vol. 26 (1), рр. 5–21.
- Fan Y., Liu L., Wu G., Wei Y. Analyzing impact factors of CO2 emissions using the STIRPAT model. Environmental Impact Assessment Review, 2006, vol. 26, рр. 377–395.
- Sadorsky P. The effect of urbanization on CO2 emissions in emerging economies. Energy Economics, 2014, vol. 41, рр. 147–153.
- Feng K., Hubacek K., Guan D. Lifestyles, technology and CO2 emissions in China: A regional comparative analysis. Ecological Economics, vol. 69, рр. 145–154.
- Wang M., Che Y., Yang K., Wang M., Xiong L., Huang Y. A local-scale low-carbon plan based on the STIRPAT model and the scenario method: The case of Minhang District, Shanghai, China. Energy Policy, 2011, vol. 39, рр. 6981–6990.
- Wang P., Wua W., Zhu B., Wei Y. Examining the impact factors of energy-related CO2 emissions using the STIRPAT model in Guangdong Province, China. Energy Policy, 2013, vol.106, рр. 65–71.
- Li H., Mu H., Zhang M., Li N. Analysis on influence factors of China’s CO2 emissions based on Path–STIRPAT model. Energy Policy, 2011, vol. 39, рр. 6906–6911.
- Wang Y., Zhao T. Impacts of energy-related CO2 emissions: Evidence from under developed, developing and highly developed regions in China. Ecological Indicators, 2015, vol. 50, рр. 186–195.
- He J. What is the role of openness for China’s aggregate industrial SO2 emission?: A structural analysis based on the Divisia decomposition method. Ecological Economics, 2010, vol. 69, рр. 868–886.
- Cramer J.C. Population growth and air quality in California. Demography, 1998, vol. 35, рр. 45–56.
- Marin G., Mazzanti M. The evolution of environmental and labor productivity dynamics. Journal of Evolutionary Economics, 2010, vol. 23 (2), рр. 357–399.
- Halkos G.E., Paizanos E.Α. The effect of government expenditure on the environment: An empirical investigation. Ecological Economics, 2013, vol. 91, рр. 48–56.
- Ryumina E.V., Anikina A.M. Analyzing the impact of the natural resources factor on the level of economic development of Russian regions. Problemy prognozirovaniya=Studies on Russian Economic Development, 2007, no. 5, pp. 106–125. (in Russian)
- Zabelina I.A., Klevakina E.A., Nechushkina E.V. Impact of economic activity on the environment in border regions. Regional’nye problemy=Regional Problems, 2015, no. 4, pp. 98–105. (in Russian)
- Yashalova N.N., Ruban D.A. Nature protection investment as part of greening of national economy. Finansovaya analitika: problemy i resheniya=Financial Analytics: Science and Experience, 2016, no. 35, pp. 2–12. (in Russian)
- Research in Support of Air Pollution Policies. Results from the first phase of the Swedish Clean Air and Climate Research programme. Stockholm, 2017. 60 p.
- Druzhinin P.V., Shkiperova G.T Assessment of mutual influence of economic and ecological processes. Ekonomicheskie i sotsial’nye peremeny: fakty, tendentsii, prognoz=Economic and Social Changes: Facts, Trends, Forecast, 2014, no. 2, pp. 213–224. (in Russian)
- Druzhinin P.V., Shkiperova G.T., Potasheva O.V. Assessment of influence of the economic development on the state of the environment and emissions of greenhouse gases. Drukerovskii vestnik=Drukerovskij vestnik, 2018, no. 2, pp. 203–215. (in Russian)
- Sofronova A.A. National environmental policy in Russia and Finland as a form of state management. Uchenye zapiski Petrozavodskogo gosudarstvennogo universiteta=Proceedings of Petrozavodsk State University, 2015, no. 3, pp. 115–119. (in Russian)
