The Brazilian soil spectral library data opening

Author: Novais J.J.M., Rosin N.A., Rosas J.T.F., Poppiel R.R., Dotto A.C., Paiva A.F.S., Bellinaso H., Albarracn H.S.R., Amorim M.T.A., Bartsch B.D.A., Vogel L.G., Memello D.C., Francelino M.R., Alves M.R., Falcioni R., Dematt J.A.M.
Journal: Бюллетень Почвенного института им. В.В. Докучаева @byulleten-esoil
Section: Статьи
Article in issue: 119, 2024.
Free access
Among the various repositories of soil spectral data, the Brazilian Soil Spectral Library (BSSL, https://bibliotecaespectral.wixsite.com/english), created and maintained by the GeoCiS research group, is representative of the pedodiversity of the region, since it combines soil spectra from agricultural and environmental research. The BSSL database contains 16,084 observations with soil-harmonized surface layer physicochemical and spectral data in the visible, near-infrared, short-wave infrared (Vis-NIR-SWIR, 350-2,500 nm) and mid-infrared (MIR, 4,000-600 cm-¹) ranges from all 26 Brazilian states and the Federal District. The idea of creating the BSSL was born in 1995, completed in 2019 and opened to users in 2023. This database is currently available online at https://zenodo.org/records/8361419. During oppening process, data filtering was performed to ensure reliable and valuable information provided to society. Then consistency and quality assessments were executed using Pearson's correlation and the Cubist algorithm in the R environment. Modeling analysis revealed the robust predictive power of the spectral database, facilitating the modeling of key soil attributes. An open-access BSSL will help researchers validate their results by comparing measured data with predicted data, enabling the development of new models or the improvement of existing ones. The BSSL is a globally significant spectral library due to its broad coverage and representation of different tropical soil classes. Soil spectral data can help governments and corporations by providing information to decision-makers regarding the conservation or exploitation of natural resources to monitor soil health.
Soil spectroscopy, soil database, pedometry, hybrid laboratory, soil attributes analysis
Short address: https://sciup.org/143183304
IDR: 143183304 | DOI: 10.19047/0136-1694-2024-119-261-305
Открытая библиотека спектральных почвенных данных Бразилии
Среди различных репозиториев Бразильская библиотека спектральных почвенных данных (BSSL, https://bibliotecaespectral.wixsite.com/english), созданная и поддерживаемая исследовательской группой GeoCiS, отражает в полной мере педоразнообразие указанного региона, так как она сочетает в себе почвенные спектры, полученные в результате как сельскохозяйственных, так и экологических исследований. База данных BSSL содержит 16 084 наблюдения, включающих сведения о физико-химических свойствах поверхностного слоя почвы, гармонизированные со спектрами в видимом, ближнем инфракрасном, коротковолновом инфракрасном (Vis-NIR-SWIR, 350-2 500 нм) и среднем инфракрасном (MIR, 4 000-600 см-¹) диапазонах, для 26 бразильских штатов и 1 федерального округа. В настоящий момент эта база данных находится в открытом доступе - https://zenodo.org/records/8361419. Идея создания BSSL возникла в 1995 г. Работа была закончена в 2019 г., и была открыта для пользователей в 2023 году. В процессе создания осуществлялась фильтрация данных, что обеспечило достоверность и ценность предоставляемой информации. Была проведена оценка согласованности и качества с использованием корреляции Пирсона и алгоритма Cubist в среде R. Анализ моделей показал надежную прогностическую способность спектральной базы данных, облегчающую моделирование ключевых почвенных свойств. Открытый доступ к Бразильской библиотеке почвенных спектральных данных (BSSL) поможет исследователям подтвердить свои результаты путем сравнения данных прямых измерений с прогнозируемыми значениями, что будет способствовать разработке новых моделей или улучшению уже существующих. BSSL представляет собой спектральную библиотеку глобального уровня благодаря широкому охвату и отображению различных типов тропических почв. Спектральные данные о почве могут помочь правительствам и корпорациям, предоставляя информацию, необходимую для принятия решений, касающихся сохранения или эксплуатации природных ресурсов, а также для мониторинга состояния почв.
Text of the scientific article The Brazilian soil spectral library data opening
11 Av. Pádua Dias, Piracicaba/SP 13418-900, Brazil, *, e-mail: , **, e-mail: , ***, e-mail: , ****, e-mail: , *****, e-mail: , ******, e-mail: , *******, e-mail: , ********, e-mail: , *********, e-mail: , **********, e-mail: , ***********, e-mail:
2State of São Paulo, Department of Agriculture and Supply, 2340, Av. Brasil, Campinas/SP 13070-178, Brazil, * 0000-0002-0521-8864 , e-mail:
3Federal University of Viçosa, Department of Soil Science, Av. P.H. Rolfs, Viçosa/MG, 36571-900, Brazil, *, e-mail: **, e-mail:
4Western Sao Paulo University, 700, st. José Bongiovani, Presidente Prudente/SP 19050-920, Brazil, *, e-mail:
5State University of Maringá, Department of Agronomy, 5790, Av. Colombo, Maringá/PR 87020-900, Brazil, *, e-mail:
Abstract: Среди различных репозиториев Бразильская библиотека спектральных почвенных данных (BSSL, , созданная и поддерживаемая исследовательской группой GeoCiS, отражает в полной мере педоразнообразие указанного региона, так как она сочетает в себе почвенные спектры, полученные в результате как сельскохозяйственных, так и экологических исследований. База данных BSSL содержит 16 084 наблюдения, включающих сведения о физико-химических свойствах поверхностного слоя почвы, гармонизированные со спектрами в видимом, ближнем инфракрасном, коротковолновом инфракрасном (Vis-NIR-SWIR, 350–2 500 нм) и среднем инфракрасном (MIR, 4 000–600 см-¹) диапазонах, для 26 бразильских штатов и 1 федерального округа. В настоящий момент эта база данных находится в открытом доступе – Идея создания BSSL возникла в 1995 г. Работа была закончена в 2019 г., и была открыта для пользователей в 2023 году. В процессе создания осуществлялась фильтрация данных, что обеспечило достоверность и ценность предоставляемой информации. Была проведена оценка согласованности и качества с использованием корреляции Пирсона и алгоритма Cubist в среде R. Анализ моделей показал надежную прогностическую способность спектральной базы данных, облегчающую моделирование ключевых почвенных свойств.
Since the mid-twentieth century, researchers have recognized and discussed the importance of observing the electromagnetic energy behavior when it reaches a target such as the soil, aiming to investigate the physicochemical compounds of this material (e.g., Obukhov, Orlov, 1964; Bowers, Hanks, 1965; Stoner, Baumgardner, 1981). Since then, reflectance spectral signatures of different soil classes and attributes have remained a topic of discussion. According to Stenberg et al. (2010), spectral intervals from Visible (Vis) to InfraRed (IR) can predict the soils' properties through electromagnetic reflectance analysis both quantitatively (Viscarra Rossel et al., 2014) and qualitatively (Demattê et al., 2014). The spectral signature is, by analogy, a “DNA” of the soil sample, from which several properties can be inferred, such as clay, sand, soil organic matter (SOM), soil hydrogen ion potential (pH), cation exchange capacity (CEC), and mineralogy (Nocita et al., 2014).
Various types of soil data are produced and stored in a decentralized manner, restricted to the researchers' purposes only, making the data out of reach for other researchers. Therefore, the BSSL data opening initiative makes this information accessible to advance research on soils and other natural resources. However, such initiatives need to be curated to improve their quality and applicability. Open data policies require information to be readily accessible in a user-friendly and editable format, preferably downloadable via the Internet to enable remote access from the data server (Harris, Baumann, 2015). In addition, data must be provided under conditions that ensure reuse and redistribution, including combination with other datasets.
Many researchers agree that scientific data must be available to society observing intellectual property protection policies. It is emphasized that everyone should be able to use, reuse, and redistribute without distinction between areas of action by or against individuals or groups (Demattê et al., 2022). Open-access data has the potential for different systems and organizations to work together, achieving interoperability (Poppiel et al., 2022). Therefore, this work aimed to discuss the trajectory of BSSL from conceptualization to openly and freely available data to the scientific community, demonstrating its us- ability and insights. Making it public, we intend to release the widespread dissemination of a refined version of the BSSL database, ensuring its accessibility to a broader audience. It is noteworthy that the number of self-citations is high since this work shows the history of this project, its benefits for society, and its perspectives.
MATERIAL AND METHODS
History of the BSSL
After Stoner and Baumgardner (1981) in the United States, Brazil was the second country to construct an SSL, considering the State of São Paulo through a report published by Epiphanio et al. (1992), followed by Formaggio et al. (1996). The BSSL project began with Demattê (1995), by sampling and soil analysis in the Department of Soil Science from the Luiz de Queiroz College of Agriculture (Esalq) of the University of São Paulo (USP). Since then, there has been a huge divulgation for the Brazilian community about the importance of SSL construction as a legacy for the future of the Pedology discipline. Demattê (1999) continued drawing attention to the necessity of the discipline of Pedology to advance to a new level by encompassing geotechnologies.
In this research line, Demattê and Garcia (1999) pioneered the study of soil spectra in Brazil when related the soil reflectance patterns with weathering in the state of Parana. Following this tendency, Demattê et al. (2004) produced the first digital soil map using spectral data. Subsequently, Bellinaso et al. (2010) performed an SSL covering 8 Brazilian states. The amount of these and other subsequent studies generated a vast database scattered across laboratories and research institutes, resulting in the first approximation of the BSSL performed by Sato (2015).
Based on these studies, Terra et al. (2015), created the term “spectral pedology”, which tried to highlight the relevance of pedologists in the assessment process to use these tools and go after the science between energy and matter for results interpretation. The primary idea was to involve as many Brazilian researchers as possible, covering all regions. In this sense, the Geotechnologies in Soil Sciences research group (GeoCiS, , accessed in September 2023) led the challenge to create an extensive database con- taining soil spectra from different parts of Brazil, later called the BSSL (Demattê et al., 2019). Thus, from conception to implementation, the BSSL has lasted about 27 years, of which, 18 have been taken only for its dissemination throughout Brazil.
After many lectures, meetings, workshops, conferences, interviews, and contacts to convince the scientific community of the relevance of an SSL for Brazil, finally, GeoCiS achieved the primary goal regarding this initiative through the publication of the article “The Brazilian Soil Spectral Library (BSSL): a general overview” (Demattê et al., 2019), together with the Portuguese and English website launching , accessed in September 2023). The dynamic of BSSL compilation was as follows: once the researchers agreed to the proposal, we set up a reception protocol at Esalq/USP, where each collaborator sent soil samples for spectral measurements and standardized registration in the database. As feedback, the spectra were returned to the users since they did not have the equipment. This dynamic was crucial for the success of the initiative because it served as a reward for the adoption and creation of new research groups throughout Brazil.
Covering, impact, and usefulness of BSSL for society
As an impact in the Academy, it created the discipline “Remote Sensing Applied to Soils” for full professors, raising the geotechnologies to outstanding levels in Pedology. During this period, a staff was formed to train and disseminate spectroscopy knowledge using the BSSL by the GeoCiS . Another result, for the scientific community, was the formation of a network of collaborators from all over Brazil, with sufficient data and empirical knowledge to compile the BSSL as a representative spectral database, including the pedodiversity of the entire Brazilian territory with about 8.5 million km2 (IBGE, 2021).
The BSSL started with the Vis-NIR-SWIR spectral range, but looking to the future, it created a new task on which the region of the Middle InfraRed (MIR) had to be measured as well. This spectral region has fundamental spectral bands and is rich in information about the soil properties due to more detailed spectra. Therefore, the GeoCiS group also created and published the Brazilian MIR Spectral Library (Mendes et al., 2022b). Both spectral ranges are part of the archive of the BSSL establishing an even larger SSL (Figures 1a and 1b).
The validity of the BSSL data has already been demonstrated even before its release. Several studies have applied the spectral data to model soil classes, attributes, and digital soil mapping (e.g., Gallo et al., 2018; Novais et al., 2021; Poppiel et al., 2019; Rizzo et al., 2016; Rosin et al., 2023) and for equipment calibration (Romero et al., 2018). In addition, it served as part of a project to understand the remote sensing dataset (Demattê et al., 2020, 2018), both studies were aimed to produce a Synthetic Soil Image, called SySI, processed by the Geospatial Soil Sensing System (GEOS3) technique developed by GeoCiS. Table 1 lists the main research, on local, regional, and global scales, based on BSSL data.
The BSSL has also contributed to transfer soil techniques, such as those performed by Tziolas et al. (2020), and is becoming part of the World Soils Initiative. Nevertheless, the applied BSSL generates the Brazilian Soil Spectral Service (BraSpecS, (Demattê et al., 2022). This web platform was the first initiative in which the user could determine their soil attributes by uploading the soil spectrum. In the BraSpecS, models are applied to deliver the predicted soil attribute values. It is the first online system for soil analysis modeling available to all users.
Figure 2 illustrates the step-by-step construction of this project, e. g., conceptualization, construction, dissemination, teaching, data opening, and the services’ impact on society (green arrow). This scheme demonstrates that there was a reverse move in terms of retaking the initial concepts, driving it to the next goal of the BSSL implementation which was to create a hybrid wet soil analysis laboratory protocol, as stated by Demattê et al. (2022). Indeed, Poppiel et al. (2022) discussed the relationship between soil spectroscopy and traditional laboratory analyses for future soil analyses.
After the BSSL launching, a second step was initiated: teaching courses to the leading scientists and commercial users in soil spectroscopy for soil analyses under the Brazilian Program on Soil Spectral Analysis, ProBASE (Paiva et al., 2022) .
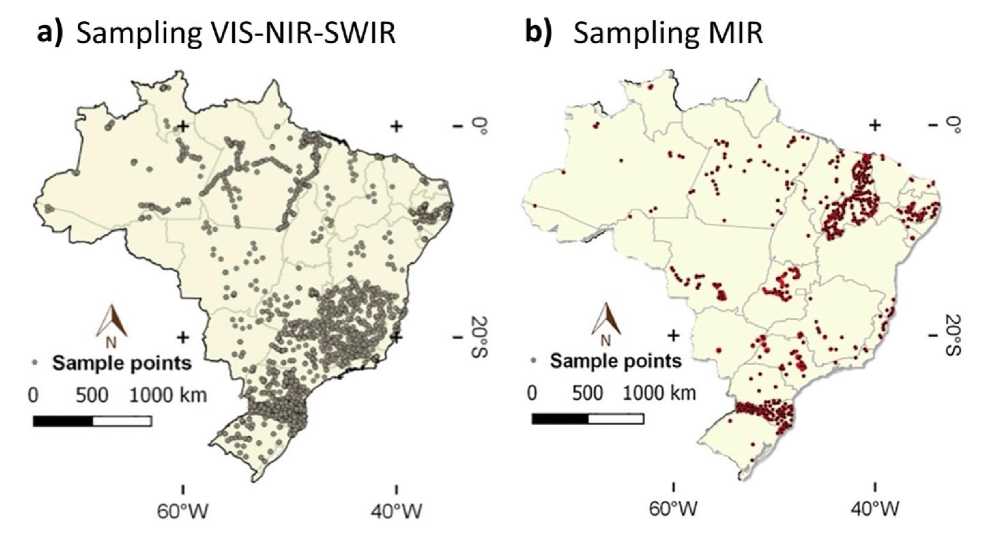
Fig. 1. Sampling locations of the Brazilian Soil Spectral Library: a) samples analyzed in Vis-NIR-SWIR range and b) samples analyzed in MIR spectral ranges data. Source: adapted from: a) Demattê et al. (2019) and b) Mendes et al. (2022).
Table 1. List of research that utilized the BSSL as a database
|
Authors |
Title |
Study area |
|
Demattê et al. (1998) |
Comportamento espectral de materiais de solos e de estruturas biogênicas associadas |
Piracicaba City, State of São Paulo, Brazil |
|
Demattê and Garcia (1999) |
Alteration of Soil Properties through a Weathering Sequence as Evaluated by Spectral Reflectance |
State of Paraná, Brazil |
|
Demattê et al. (2004) |
Visible–NIR reflectance: a new approach on soil evaluation |
State of São Paulo, Brazil |
|
Campos and Demattê (2004) |
Cor do solo: uma abordagem da forma convencional de obtenção em oposição à automatização do método para fins de classificação de solos |
State of São Paulo, Brazil |
|
Demattê et al. (2007) |
Spectral reflectance for the mineralogical evaluation of Brazilian low clay activity soils |
State of São Paulo, Brazil |
|
Dematte et al. (2010) |
Soil density evaluated by spectral reflectance as evidence of compaction effects |
State of São Paulo, Brazil |
|
Nanni et al. (2011) |
Optimum size in grid soil sampling for variable rate application in site-specific management |
State of São Paulo, Brazil |
|
Demattê and Terra (2014) |
Spectral pedology: A new perspective on evaluation of soils along pedogenetic alterations |
Piracicaba, state of São Paulo, Brazil |
Table 1 continued
|
Authors |
Title |
Study area |
|
Araújo et al. (2014) |
Soil contaminated with chromium by tannery sludge and identified by vis-NIR-mid spectroscopy techniques |
State of São Paulo, Brazil |
|
Ackerson et al. (2015) |
Predicting clay content on field-moist intact tropical soils using a dried, ground VisNIR library with external parameter orthogonalization |
State of São Paulo, Brazil |
|
Gallo et al. (2018) |
Multi-Temporal Satellite Images on Topsoil Attribute Quantification and the Relationship with Soil Classes and Geology |
State of São Paulo, Brazil |
|
Demattê et al. (2018) |
Geospatial Soil Sensing System (GEOS3): A powerful data mining procedure to retrieve soil spectral reflectance from satellite images |
State of São Paulo, Brazil |
|
Novais et al. (2021) |
Digital soil mapping by multispectral modeling using cloud-computed landsat time series |
Federal District, Brazil |
|
Mendes et al. (2022a) |
A remote sensing framework to map potential toxic elements in agricultural soils in the humid tropics |
State of São Paulo, Brazil |
|
Bellinaso et al. (2010) |
Soil spectral library and its use in soil Classification |
States of São Paulo, Goiás, Minas Gerais and Mato Grosso do Sul |
Table 1 continued
|
Viscarra Rossel et al. (2016) |
A global spectral library to characterize the world's soil |
World |
|
Demattê et al. (2016) |
Spectral regionalization of tropical soils in the estimation of soil attributes |
São Paulo, Minas Gerais, Goiás, Amapá and Mato Grosso do Sul |
|
Demattê et al. (2017) |
Genesis and properties of wetland soils by Vis-NIR-SWIR as a technique for environmental monitoring |
States of Mato Grosso, and Minas Gerais, Brazil |
|
(Poppiel et al. (2019) |
Mapping at 30 m Resolution of Soil Attributes at Multiple Depths in Midwest Brazil |
Midwest Brazil |
|
Santos et al. (2020) |
Predicting carbon and nitrogen by visible near-infrared (Vis-NIR) and mid-infrared (MIR) spectroscopy in soils of Northeast Brazil |
Northeast Brazil |
|
Souza et al. (2020) |
Ratio of Clay Spectroscopic Indices and its approach on soil morphometry |
Southeastern and Midwest, Brazil |
|
Safanelli et al. (2020) |
Multispectral Models from Bare Soil Composites for Mapping Topsoil Properties over Europe |
Europe |
|
Demattê et al. (2020) |
Bare Earth’s Surface Spectra as a Proxy for Soil Resource Monitoring |
World |
Table 1 continued
|
Authors |
Title |
Study area |
|
Carnieletto Dotto et al. (2020) |
Soil environment grouping system based on spectral, climate, and terrain data: a quantitative branch of soil series |
Regions of Brazil |
|
Mello et al. (2023) |
Remote sensing imagery detects hydromorphic soils hidden under agriculture system |
Regions of Brazil |
Note. Source: the authors.
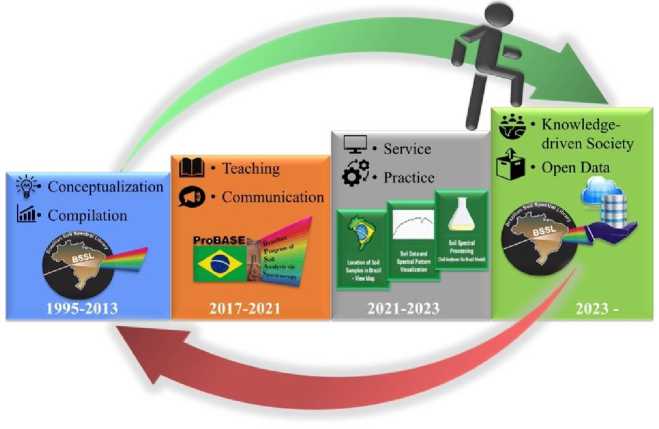
Fig. 2 . The step-by-step sequence of the BSSL project from conceptualization in 1995 to opening data to society in 2023.
This program aimed to convince commercial laboratories of this issue’s importance and the future of soil analyses. So, Poppiel et al. (2022) detailed the systematic of ProBASE diffusing techniques from collecting soil samples by contributors up to teaching courses for data processing.
Subsequently, the GeoCiS group considered society mature enough to take the next step. Thus, Demattê et al. (2022) launched the Brazilian Soil Spectral Service (BraSpecS). The system allows users to upload their spectra in the cloud, where a model will run and deliver, by email, the soil analysis values. This concept shows the power of soil sensing as a friendly idea for normal users. It is no more a matter of science only; any user can make it happen. On the one hand, the BSSL is exclusive to scientists, and they have generated many papers. On the other hand, this did not reach the community. However, BraSpecS brought the concept of society-oriented service through more information given to scientists, a spin-off. In the next section, we describe the methods utilized to improve the database quality, filtering discrepant or incomplete data and, so, making it available to the public. As soon the collaborators sent their soil samples to Esalq/USP, they were submitted to spectral readings and stored in the GeoCiS’ internal database together with their respective soil attributes analysis results. These data are made available now, with suitable data consistency analyses for availability.
Methodology
The collaborative network, consisting of 81 researchers representing 69 institutions in the 26 Brazilian states and the Federal District, resulted in the extensive database of BSSL. Figure 3a illustrates the basic framework of the BSSL compilation, starting with data sampling in the field in which, voluntarily and with a mutual commitment, the collaborators collected soil samples according to Schoeneberger et al. (2012) and Teixeira et al. (2017) and sent them to Esalq/USP. Afterward, spectral analyses and processed data were returned to the collaborators, who transformed them into products for society, such as thematic maps and predictive models of soil attributes. Figure 3b shows the workflow to data opening sequence to the public.
Thus, we registered and organized the samples at Esalq/USP Soil Laboratory. The data analyzed included granulometry (Sand and Clay), SOM, soil pH in water, and CEC, representing the calcium (Ca), magnesium (Mg), and sodium (Na) content. For some samples that do not have any analysis data, we followed the recommendations of Teixeira et al. (2017) to achieve the attributes missed. Regarding reflectance spectroscopy, Poppiel et al. (2019) provided detailed methods for sampling, preparation, and soil analyses.
In summary, the steps for Vis-NIR-SWIR readings were: a) the soil samples were passed by a preliminary treatment, drying in an oven at 45 °C for 48 hours, grinding and sieving through a 2 mm mesh; b) they placed in Petri dishes with a diameter of 9 cm and height of 1.5 cm; c) the surface of the samples was homogenized and flatted, reducing the shades caused by other bigger particles or foreign bodies, becoming ready for spectral readings; d) the spectral analyses occurred in a darkened room, avoiding natural light interference,
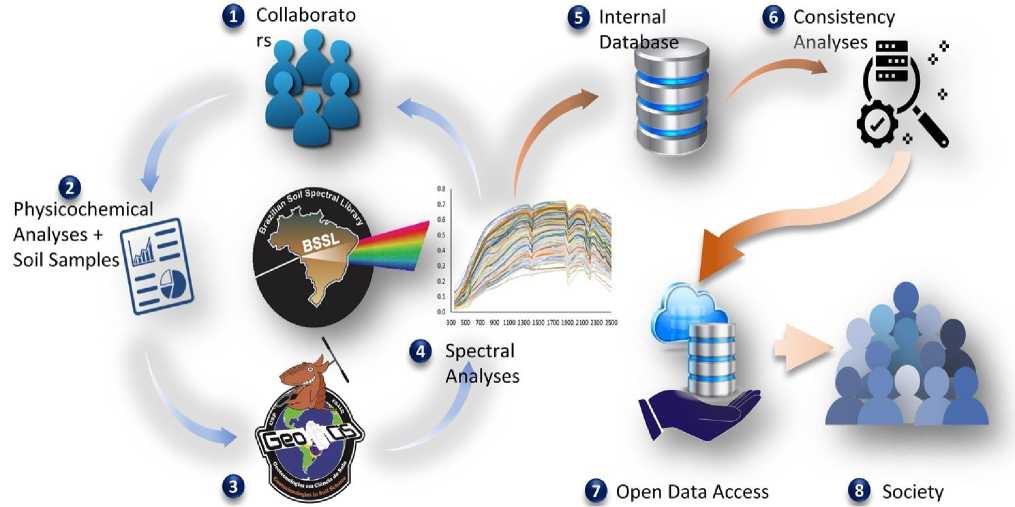
Fig. 3 . Framework of BSSL. a) starting with collaborators sending the results of analysis and soil samples to Esalq/USP where the spectral readings performed return to the researchers as they were indexed in the database, b) storage in an internal database with analyses of consistency for data opening to society. Source: adapted from Demattê et al. (2019).
in which a computer registers the electromagnetic pulses throughout an optical fiber connected to the sensor obtaining the spectral response of the soil sample; e) reflectance data in the Vis-NIR-SWIR range were obtained with a FieldSpec 3 spectroradiometer (Analytical Spectral Devices, ASD, Boulder, CO), which operates in the spectral range from 350 to 2 500 nm; f) the spectral resolution of the sensor has of 3 nm – from 350–700, and 10 nm – from 700–2 500 nm, automatically interpolated to 1 nm spectral resolution in the output data, resulting in 2 151 channels (or bands); g) two 50W halogen lamps (power source) were positioned at 90° to each other and 35 cm away from the sample with 30° of zenith angle. It is noteworthy that for every sample, three readings were taken at different positions, rotating the Petri dish by 90°. So, every reading results from the mean of 100 scans made by the sensor.
For the analysis in the MIR spectral range, we followed Mendes et al. (2022b). The soil fraction smaller than 2 mm was milled, sieved to 0.149 mm, and scanned using a Fourier Transform InfraRed (FT-IR) alpha spectroradiometer (Bruker Optics Corporation, Billerica, MA 01821, USA) equipped with a DRIFT accessory. Alpha Sample Compartment RT-DLaTGS ZnSe sensor (Bruker Optik GmbH) with the Drift accessory read the samples installed in the Geotechnology laboratory of the Department of Soil Science at Esalq/USP. This device measures the diffuse reflectance, in which it is applied the Fourier transform on the spectral range from 4 000 cm-1 to 600 cm-1, with a resolution of 2 cm-1. A mean of 32 successive readings has derived one soil spectrum. Sensor calibration took place before each reading of the sample set, standardizing the measurements based on the maximum reflectance of a gold plate as the usage protocol recommends.
Since the soil samples were spectrally measured, we indexed the results in the sheets in .xlsx format and made them available to the researchers, who provided the respective samples. After performing database harmonization and consistency tests, we compiled the refined BSSL in a repository prompt to download via Zenodo data repository in the link (Demattê et al., 2023). Following the initiative dynamic, we consulted all the collaborators regarding their contentment to make the database available to the public. In summary, we went from the BSSL to ProBASE and BraSpecS to reach all communities.
We compiled all traditional and spectral analyses in specific sheets generating a database available for discussion and review. The descriptive statistics of the dataset demonstrated the main soil attribute distribution through boxplots, as well as the spectral Vis-NIR-SWIR and MIR spectral ranges by scatterplots revealing the spectral patterns of datasets. Afterward, we filtered the dataset by samples from 0 to 20 cm depth to verify the consistency of the following soil attributes data: Sand, Clay, SOM, pH in water, CEC at pH 7, as well as Vis-NIR-SWIR and MIR spectral data. The filtering occurred by boxplot and backscattering observation, aiming to verify unjustified outliers. Thus, Descriptive statistics by boxplots helped us to observe the parameters of datasets. Afterward, we modeled the soil attributes using the Vis-NIR-SWIR spectral ranges as predictor covariates by the Cubist method in the R studio software (R Core Team, 2019).
The Cubist model is a machine learning algorithm for rule-based regression and classification that combines decision trees and linear models to make predictions. This function is an adaptation of Quinlan’s aka M5 model (Quinlan, 1992) with additional corrections based on nearest neighbors in the training set, as described in Kuhn and Johnson (2013). The cubist method was developed for handling complex datasets with multiple predictors (features) and interactions between them. It employs a technique called “cubist decomposition”, which breaks down the problem into smaller subproblems and builds a set of rules for each subproblem. Kuhn and Quinlan (2018) updated the cubist model through a package in the R programming language by the Caret library.
During the modeling in R, we generated charts with the twenty most important Vis-NIR-SWIR bands covariates for dataset prediction based on the dataset to be modeled. The algorithm resampled the BSSL Vis-NIR-SWIR data frame (Demattê et al., 2023) for every 20 columns remaining 510 spectral covariates in view to provide efficiency to processing. Afterward, we divided the resulting data frame into two datasets: training and validation with 70 and 30% of the data, respectively. So, we established 150 repetitions of soil attributes prediction to take the mean avoiding underrated or overrated models.
The metrics used to validate the modeling used the Coefficient of Determination (R2). However, it’s important to note that a high R² value by itself does not guarantee model adequacy. Sometimes, a high R² can be misleading if the model is overfitting the data and fails to generalize well to new data. Therefore, it is crucial to assess R² alongside other metrics, considering the specific context of the problem when interpreting its results. These metrics are available and were employed to assess the performance of regression models, with Root Mean Square Error (RMSE), gauging the overall quality of predictions and Ratio of Performance to Inter-Quartile range (RPIQ), providing a relative comparison against a reference model. In general, models with lower RMSE and higher RPIQ are deemed superior in terms of prediction. Thus, we compared our results with other studies, aiming to sustain the discussion about the pillars of data open source and insights regarding applications of BSSL for society.
RESULTS AND DISCUSSION
During the contact with collaborators, there was broad acceptance and encouragement regarding BSSL database availability to the public. However, not all collaborators of the BSSL initiative agreed with the purpose, justifying it for several reasons such as copyright and conflict of interest. In the supplementary material, there is a table identifying only those who have authorized their data for open use. In this chart, we show the collaborators’ names according to their position in their respective institutions, contact email and the number of samples that they have contributed to this publication.
Data description
The collection, available in Demattê et al. (2023), contains environmental, physicochemical, and spectral data of soil surface layer from 16,084 sites throughout the Brazilian territory, covering all regions of Brazil, including 26 states and the Federal District, where about 95% of soil samples were sampled in agricultural and pasture areas and 5% others on natural vegetation lands. The table is in a .xlsx format, has a 300 Mb size, and is structured through five sheets with 16,084 rows and columns representing various soil attributes in the surface layer, from 0 to 20 cm depth.
The first sheet contains 20 columns including environmental observations such as location, land use and land cover, biome, geology, and physicochemical attributes. Following, there is a sheet named Vis-NIR-SWIR with 2 151 columns related to Fieldspec Pro spectral bands, which covers all IDs of the key soils sheet (16,084 rows). Withal, the MIR’s sheet has 681 columns from device channels with 1 783 rows (Demattê et al., 2023). It is noteworthy that not all cells are filled in turn contributors did not provide homogeneous data (Table 2). Nevertheless, we make them available because they have important observations. Moreover, several geographic coordinates are missing, but they can be requested directly from the data owner.
Statistical parameters
Regarding the statistical analyses, Figure 4a demonstrates suitable values for the soil attributes excluding outliers’ values and showing only from the first to fourth quartiles, corroborating with the primary pedological studies (cf. Demattê et al., 2019; Mello et al., 2023; Novais et al., 2021; Poppiel et al., 2019; Rosin et al., 2023). The soil dataset presented a sandy-clayey texture and a typical lower CEC, despite fertilization practices and maintenance of SOM up to a depth of 20 cm, commonly adopted in Brazilian agriculture.
Table 2. Amount and percentage of soil data available
|
л "О |
-в л |
л и |
о |
и а |
и |
и и |
0 |
н |
||
|
св о |
|
о <п |
40 |
о> |
40 |
40 04 |
«п ОО 40 |
о ч© |
||
|
% |
94.04 |
93.93 |
82.98 |
21.66 |
77.69 |
77.71 |
4.11 |
77.69 |
42.64 |
100 |
Note. Source: the authors.
The means for key attributes were: 541.7 g kg-1 of sand content and clay content with 311.5 g kg-1, acidic pH (mean of 4.6), and CEC levels with mean of 53 mmol kg-1), characteristics mainly inherited from the parent material. Most of the Brazilian soils have mineralogy with a predominance of kaolinite and Fe and Al oxides, which indicates highly evolved soils (Schaefer et al., 2008; Tiessen et al., 1994). The natural fertility values are below that recommended for most commercial crops, which can be circumvented by soil management (Buol, 2009). Due to these properties, SOM plays a fundamental role in the increase of CEC (Ramos et al., 2018).
Figure 4a also shows the SOM mean (21.1 g kg-1), representing Brazilian lands’ carbon content. The sampling comes from areas under natural vegetation or within no-tillage agricultural systems, where straws cover the soil surface during specific periods, increasing the SOM contents, as related by Nocita et al. (2014). Furthermore, Novais et al. (2021) stated that Brazilian soils have a typical dystrophic character with low natural fertility and are highly weathered, while the higher exchangeable base contents are consequences of no-tillage soil management.
The graphs shown in Figures 4b and 4c display the relationship between the reflectance factor and the wavelength (nm) (wavenumber in cm-1 for MIR data) with superior limits, 3rd quartile, 2nd quartile (median), 1st quartile, and mean values (Figure 4b and 4c). Such relationships demonstrate the spectral curve patterns in both databases. The spectral curves statistics showed the Vis-NIR-SWIR-MIR reflectance patterns of Brazilian soils as cited by literature (e.g., Mello et al., 2023; Mendes et al., 2022; Poppiel et al., 2019).
Regarding the pattern of the spectral curves, we observed an ascending form from 350 to 1 400 nm; flattened between 1 400 and 1 800 nm, and descending from 1 800 to 2 500 nm, with peaks of mean albedo around 3.2 of reflectance factor. The spectral behavior also indicates the obliterating action of organic matter, added to the clayey texture, which is responsible for the low albedo of the curves. Regarding the main features, we observed absorption peaks related to oxides, typical of weathered soils which predominate in the database. We also noted the specific features of kaolinite at 1 400 nm and 2 205 nm; water and hydroxyl groups at 1 400 nm and 1 900 nm; as well as gibbsite at 2 265 nm. These absorption peaks are another characteristic of highly weathered soils (Novais et al., 2023).
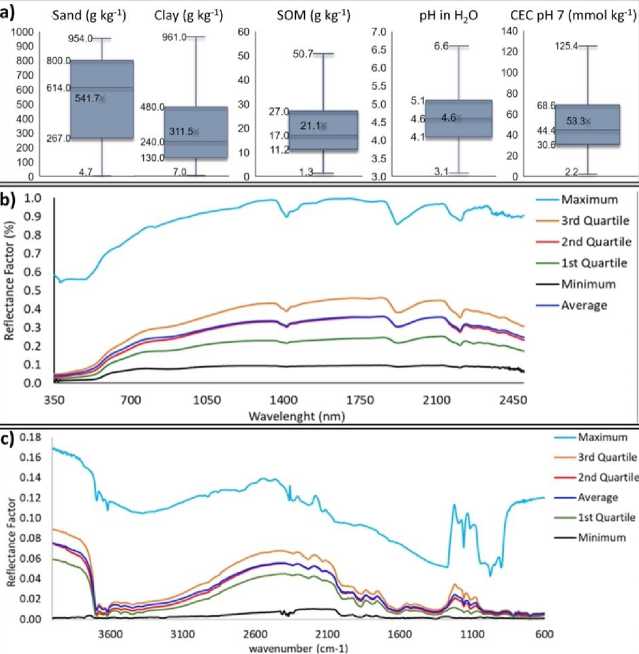
Fig. 4. BSSL database statistics. a) key soil attributes; b) spectral patterns of the Visible, Near-Infrared, and Short-Wave Infrared range; and c) spectral patterns of the Middle InfraRed range. CEC – cation exchange capacity; SOM – soil organic matter. Source: the authors.
Data consistency analysis
Regarding the suitability of the dataset, Figure 5 shows Pearson's Correlation (r) with soil attributes and mean reflectance through in the Vis-NIR-SWIR wavelengths. The first correlogram (Figure 5a) exhibits the correlation between the main soil attributes. This representation demonstrated the validity of the dataset because they fitted the trend- lines expected for the soil attributes presenting r values, in which -1 represents directly proportional; 0 is not related; and 1 is inversely proportional covariates.
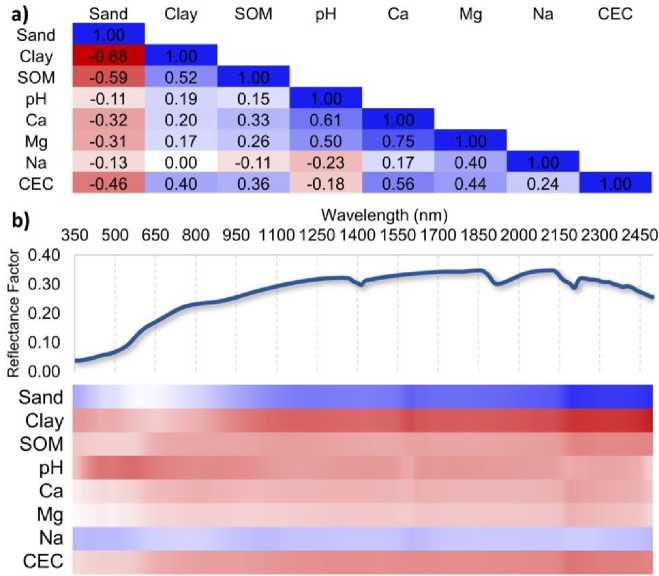
Fig. 5. Pearson’s Correlation graphs: a) between key soil attributes and b) Vis-NIR-SWIR mean spectra. SOM – soil organic matter; pH – soil hydrogen ion potential; Ca – calcium; Mg – magnesium; Na – sodium and CEC – cation exchange capacity.
For example, sand content was negatively correlated with all other key soil attributes. This illustrates that the higher the sand content in the soil, the lower the values of other attributes, mainly Clay (-0.88), SOM (-0.59), and CEC (-0.46). On the other hand, clay content demon- strated a direct relation with the SOM (0.52) and CEC (0.40) levels, typical characteristics of Brazilian soils (Terra et al., 2015). This behavior occurs because the cations are directly associated with the minor particles of soil (Novais et al., 2021). We also observed the CEC and pHH2O reached an r of -0.18, demonstrating that the more acidic the soil is, the lower the availability of exchangeable cations reflecting the lower natural soil fertility.
Figure 5b also exhibits the spectral ranges, represented by a mean dataset curve, correlating with the main soil attributes. Values tending toward red indicate an inverse relationship; white values represent no relationship between the variables, and values tending toward blue indicate a direct connection between the attributes and the vertically aligned spectral range. Similar results were obtained by Novais et al. (2023) when they characterized soils in the Brazilian Federal District highlighting the relationship between Vis-NIR-SWIR spectra and the key soil attributes. For example, Figure 5a exhibits that sand content had a positive correlation along all spectra, showing that as one increases the other also increases. The higher the sand content, the higher the albedo by quartz. This occurs since bigger-sized soil particles shadow the sample on the surface of samples less than smaller ones. However, clay presented the opposite behavior (Novais et al., 2023). SOM is a soil attribute characterized by absorbing the light due to its composition, so increasing SOM, the reflectance falls in the spectral curve, evidenced by the negative correlation demonstrated.
Modeling performance assessment
The models behaved satisfactorily for all attributes, returning predicted values from the collection of both data sets. The metrics, shown in Table 3, demonstrated that the training dataset reached better performance than validation, as expected. According to Kuhn and Johnson (2013), it is common for the training dataset to exhibit seemingly better performance than the validation dataset due to several factors. However, the primary goal is to assess how well the model generalizes to new data, which is why performance on the validation set is more important for measuring the model's real predictive capability.
Table 3. Metrics of cubist modeling on key soil attributes
|
Train |
||||||||||
|
Key Soils |
Unit |
R2 |
conc |
MSE |
RMSE |
bias |
MSEc |
RMSEc |
RPD |
RPIQ |
|
Sand |
g kg-1 |
0.88 |
0.93 |
10 019.84 |
100.10 |
4.86 |
9 996.21 |
99.98 |
2.82 |
3.47 |
|
Clay |
g kg-1 |
0.87 |
0.93 |
6 248.77 |
79.05 |
-6.04 |
6 212.34 |
78.82 |
2.73 |
1.39 |
|
SOM |
g kg-1 |
0.88 |
0.92 |
36.78 |
6.06 |
-0.06 |
36.78 |
6.06 |
2.68 |
0.97 |
|
pH |
0.57 |
0.70 |
0.16 |
0.40 |
-0.01 |
0.16 |
0.40 |
1.52 |
1.26 |
|
|
CEC |
mmol c kg-1 |
0.65 |
0.73 |
732.81 |
27.07 |
-3.05 |
723.50 |
26.90 |
1.61 |
0.51 |
|
Validation |
||||||||||
|
Sand |
g kg-1 |
0.80 |
0.89 |
16 155.43 |
127.10 |
4.38 |
16 136.26 |
127.03 |
2.23 |
2.73 |
|
Clay |
g kg-1 |
0.82 |
0.90 |
8 751.51 |
93.55 |
-6.85 |
8 704.53 |
93.30 |
2.32 |
1.18 |
|
SOM |
g kg-1 |
0.65 |
0.74 |
97.58 |
9.88 |
-1.11 |
96.36 |
9.82 |
1.63 |
0.60 |
|
pH |
0.45 |
0.62 |
0.20 |
0.45 |
-0.01 |
0.20 |
0.45 |
1.35 |
1.11 |
|
|
CEC |
mmol c kg-1 |
0.49 |
0.63 |
1 055.17 |
32.48 |
-3.17 |
1 045.10 |
32.33 |
1.38 |
0.43 |
Note. Metrics: R2 – determination coefficient; conc. – concordance; MSEc – mean square error calibration; RMSEc – root mean square error calibration; RPD – relative percent difference; RPQI – ratio of performance to inter-quartile.
If there is a significant disparity in performance between the two sets, it may be indicative of overfitting, requiring investigation and potential model adjustments.
The R² values varied from 0.45 (for pH) to 0.82 (for clay content) in the validation dataset, indicating that the results were consistent (Kuhn, Quinlan, 2018). Observing the other metrics, the data validation reached low values for RMSE and RPQI compared to studies that modeled soil attributes using machine learning algorithm to predict soil attributes (e.g., Demattê et al., 2022, 2019; Mendes et al., 2022a; Novais et al., 2021; Poppiel et al., 2022). They achieved similar values for SOM content using other algorithms to model soil attributes via spectroscopic data reinforcing the validity of the results.
Figure 6a-e demonstrates a comprehensive data consistency analysis through a covariate importance ranking and R2, using graphical representations, to assess the relationship between the observed and the predicted soil attribute, considering a depth of 0-20 cm. This analysis was performed separately for both the training and validation datasets. Specifically, we examined the (Figure 6a) sand content, (Figure 6b) clay content, (Figure 6c) SOM, (Figure 6d) pH, and (Figure 6e) CEC as key variables in this assessment.
Sand, clay, and SOM contents listed visible wavelengths as the most important covariates to model them, as also found (Novais et al., 2021). However, the near-infrared and short-wave infrared bands were among the best ranges for predicting pH and CEC. These results demonstrate the potential of soil reflectance spectroscopy for modeling soil attributes and classes (Demattê et al., 2022). The typical range for NIR is from about 700 to 2 500 nm. The most common modeled attributes in the NIR range are SOM, water, clay, sand, and silt content, soil pH, nutrient content (e.g., nitrogen, phosphorus, potassium), and other physicochemical soil parameters (Paiva et al., 2022).
Based on the results, we could demonstrate the usability of the BSSL, which has disseminated knowledge for many disciplines as scientists and commercial parts, from laboratory to remote sensing techniques (Poppiel et al., 2022). Going further, before this initiative, Brazil had only two soil research centers with spectroscopy equipment.
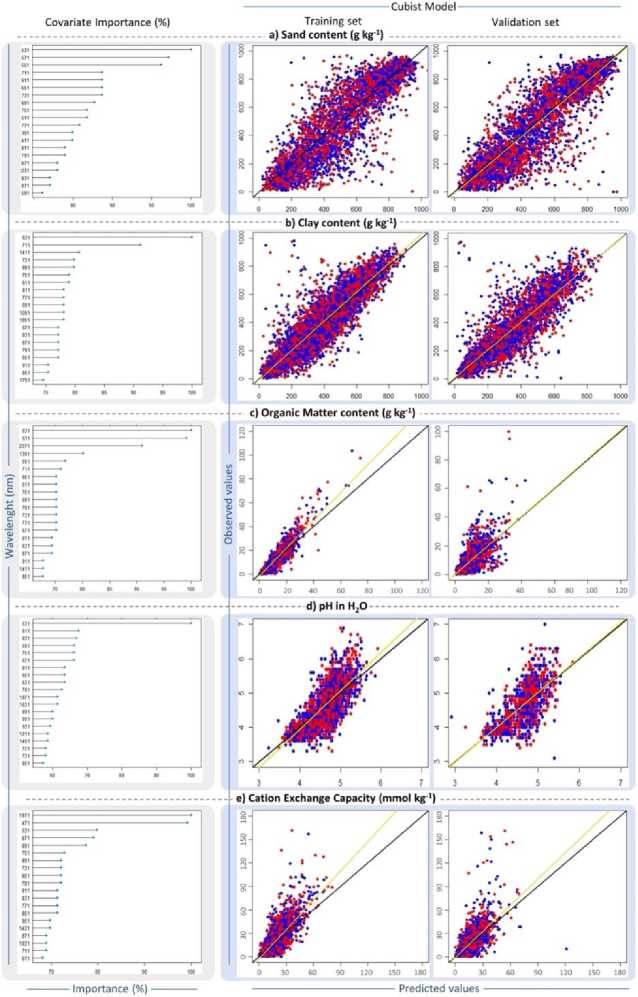
Fig. 6. Data consistency analysis by assessment in graphs: column (I) covariate importance ranking and coefficient of determination between observed and predicted soil attributes for training (II) and validation (III) datasets; a) sand content; b) clay content; c) soil organic matter content; d) soil hydrogen ion potential and e) cation exchange capacity metrics of cubist model for clay content at 0–20 cm depth.
From the beginning to the end of the BSSL project, a total of 20 other research centers acquired the spectroscopy equipment disseminating the technique throughout the country. The adoption of the spectroscopy technique has grown, showing the potential and importance of this analysis for soil, agriculture, and environmental monitoring.
Ten insights from the BSSL for society
The BSSL is national, however, it has a continental-scale soil spectral library (SSL) and is comprised of spectral data collected from diverse geographic regions across a vast area, which can provide a range of valuable insights into various fields of study. Here are some examples of insights (in alphabetic order, not by importance) that can be derived from a spectral library of this magnitude:
-
1. Agriculture, Land Use, and Land Cover: Spectral data can map crops suited for certain soils such as sugarcane ( Saccharum of-ficinarum , indicated to fertile soils) or cassava ( Manihot escu-lenta , suitable for sandy soils). They also serve to monitor plant health, estimate agricultural productivity, and optimize agricultural management zone practices from a global to local scale (Chabrillat et al., 2019).
-
2. Climate Change Monitoring: The use of an SSL can be applied to study climate change by identifying changes in soil organic matter, vegetation, temperature, and climatic conditions across various continental regions (Dotto et al., 2020).
-
3. Environmental Monitoring: A spectral library can be used to monitor environmental changes over time. For example, it can demonstrate patterns of vegetation cover, changes, and available water, as well as deforestation and exposure effects on soil (Novais, Lacerda, 2021).
-
4. Geological Studies: In geology, SSL data can be used to identi-
fy geological formations, minerals, and geological structures on a large scale, supporting mineral exploration and plate tectonics by and even continental drift research (Rosin et al., 2023).
-
5. Management of Water Resource: The SSL can support to assessment of water quality, identifying sources of pollution, monitoring river and lake water levels, and aiming for sustainable water resource management (Mendes et al., 2022a).
-
6. Natural Resources: We can help identify the distribution of natural resources through the SSL such as mineral deposits, oil and gas, groundwater, and ecologically valuable areas or under risk from an environmental view (Demattê et al., 2020).
-
7. Soil Degradation Identifying: The BSSL can be used to assess the land conditions detecting soils susceptible to erosion or floods for example (Mello et al., 2023).
-
8. Soil Fertility Assessment: A continental-scale spectral library can be utilized to assess soil fertility by analyzing spectral signatures related to nutrient content, organic matter, and pH levels. This information is invaluable for optimizing agricultural practices and increasing crop yields on a large geographical scale, as performed by Greschuk et al. (2023).
-
9. Soil Health: Spectral data can be used to map the pedoenviron-mental condition, maintaining or intervening them to make the ecosystem healthy (Lehmann et al., 2020).
-
10. Teaching and Technical-scientific Research: Researchers from various disciplines can utilize this library for a wide range of studies, from climate research to ecology, geology, agriculture, and more (Poppiel et al., 2022).
In summary, the BSSL is a powerful tool that can be applied to a variety of research, environmental monitoring, natural resource management, and planning applications (Poppiel et al., 2022). It provides valuable insights into the Earth’s surface at local, regional, national, or continental scales, representing a significant contribution to the understanding and management of large-scale terrestrial systems. In addition, it helps educate across various disciplines, such as physics, fertility, precision agriculture, and environmental sciences in all society sectors, government, corporations, and non-governmental organizations aiming the sustainability.
What has BSSL provided?
The impact on society gradually unfolded from the conceptualization of BSSL, during which researchers from various parts of Brazil came to Esalq/USP to learn how spectroscopy worked. As they gained understanding, this technique was implemented in their institutions, spreading throughout the country. In the 1990s, there were only two labs in Brazil using this technology, but today it boasts several research centers. As a result, it has been widely adopted by the scientific community, uniting numerous soil spectroscopy researchers, who produced numerous high-impact scientific papers, as cited in this manuscript.
After years of communication, the private sector, specifically wet soil analysis laboratories, became interested. Due to concerns about the environment and the waste of contaminant products, coupled with the increased use of soil analysis in agriculture, labs started incorporating this technology. For example, many labs began establishing hybrid laboratories that combine spectroscopy with traditional analyses.
Initially, many pedologists had reservations regarding this subject and its significance in soil science. However, papers and practical results have demonstrated to the technical and scientific community that this is a technology meant to assist, not replace, human decisionmaking. Consequently, pedologists began adapting their knowledge to incorporate spectroscopy, a trend that has been seen in several other disciplines as well. Researchers may be apprehensive at first, but once they comprehend the technique, they readily embrace it.
In terms of public policies, there have also been significant advances related to the BSSL concept. A prime example is the PronaSolos (Programa Nacional de Levantamento e Interpretação de Solos do Brasil), the Brazilian National Soil Survey and Interpretation Program. This multi-institutional and governmental initiative aims to map the entire territory (8.5 million km2) by 2048, with scales ranging from 1 : 25,000 to 1 : 100,000 (Polidoro et al., 2016). This program now includes the use of spectroscopy for soil analysis and other applications, a concept that would have been considered unconventional in the 2000s. Two decades later, this has become a reality, with BSSL playing a pivotal role in introducing this technology, revitalizing observation techniques, and challenging conventional beliefs.
CONCLUSIONS
The Brazilian Soil Spectral Library (BSSL) database is now readily accessible and freely available to the scientific community and soil enthusiasts across society. In addition, to soil attribute analysis, we have unlocked two significant spectral ranges, namely the Vis-NIR-SWIR and MIR, which cover a significant portion of the Brazilian territory and make possible the modeling of various soil components, including texture, SOM, and CEC. Moreover, these spectral ranges facilitate the generation of thematic maps such as soil health assessment, utilizing these data with other covariates.
This substantial contribution is expected to benefit users across diverse fields, including environmental sciences, microbiology, geology, pedology, soil conservation and pollution, mineralogy, geochemistry, physics, fertility, genesis, pedometry, and beyond. The BSSL database will serve scientists, students, professors, consultants, commercial soil laboratories, agricultural systems, and various stakeholders in addressing crucial issues such as precision agriculture, soil management zones, soil health assessment, environmental monitoring, public policy, and other essential decision-making processes.
By making this comprehensive spectral database available, we expect to provide users with valuable information and tools to meet the pressing demands of their respective domains, fostering advancements in research, sustainable practices, and informed decision-making. Furthermore, the availability of the BSSL database also offers significant support to the implementation of nature-based solutions, as it provides valuable insights into soil properties and composition, enabling the development and implementation of effective strategies for land restoration, ecosystem management, and sustainable land use planning.
References The Brazilian soil spectral library data opening
- Ackerson J.P., Demattê J.A.M., Morgan C.L.S., Predicting clay content on field-moist intact tropical soils using a dried, ground VisNIR library with external parameter orthogonalization, Geoderma, 2015, pp. 259-260, https://doi.org/10.1016/j.geoderma.2015.06.002.
- Araújo S.R., Demattê J.A.M., Vicente S., Soil contaminated with chromium by tannery sludge and identified by vis-NIR-mid spectroscopy techniques, Int. J. Remote Sens., 2014, p. 35, https://doi.org/10.1080/01431161.2014.907940.
- Bellinaso H., Demattê J.A.M., Romeiro S.A., Soil spectral library and its use in soil classification, Rev. Bras. Ciência do Solo, 2010, Vol. 34, pp. 861-870, https://doi.org/10.1590/S0100-06832010000300027.
- Bowers S.A., Hanks R.J., Reflection of radiant energy from soils, Soil Sci., 1965, p. 100, https://doi.org/10.1097/00010694-196508000-00009.
- Buol S.W., Solos e agricultura no centro oeste e norte do Brasil, Sci. Agric., 2009, Vol. 66, No. 5, pp. 697-707, https://doi.org/10.1590/S0103-90162009000500016.
- Campos R.C., Demattê J.A.M., Cor do solo: uma abordagem da forma convencional de obtenção em oposição à automatização do método para fins de classificação de solos, Rev. Bras. Ciência do Solo, 2004, Vol. 28, pp. 853-863, https://doi.org/: 10.1590/s0100-06832004000500008.
- Carnieletto Dotto A., Demattê J.A.M., Viscarra Rossel R.A., Rizzo R., Soil environment grouping system based on spectral, climate, and terrain data: A quantitative branch of soil series, SOIL 6, 2020, Vol. 6, pp. 163-177, https://doi.org/10.5194/soil-6-163-2020.
- Chabrillat S., Ben-Dor E., Cierniewski J., Gomez C., Schmid T., van Wesemael B., Imaging Spectroscopy for Soil Mapping and Monitoring, Surv. Geophys., 2019, Vol. 40, pp. 361-399, https://doi.org/10.1007/s10712-019-09524-0.
- Demattê J.A.M., Reflectância espectral de solos. Tese (Livre Docência) - Escola Superior de Agricultura Luiz de Queiroz, Piracicaba, 1999, 452 p.
- Demattê J.A.M., Relações entre dados espectrais e características físicas, químicas e mineralógicas de solos desenvolvidos de rochas eruptivas. Tese (Doutorado) - Escola Superior de Agricultura Luiz de Queiroz, Piracicaba, 1995, 265 p.
- Demattê J.A.M., Bellinaso H., Araújo S.R., Rizzo R., Souza A.B., Spectral regionalization of tropical soils in the estimation of soil attributes, Rev. Cienc. Agron., 2016, Vol. 47, n. 4, pp. 589-598, https://doi.org/10.5935/1806-6690.20160071.
- Demattê J.A.M., Bellinaso H., Romero D.J., Fongaro C.T., Morphological Interpretation of Reflectance Spectrum (MIRS) using libraries looking towards soil classification, Sci. Agric., 2014, Vol. 71, pp. 509-520, https://doi.org/10.1590/0103-9016-2013-0365.
- Demattê J.A.M., Campos R.C., Alves M.C., Fiorio P.R., Nanni M.R., Visible-NIR reflectance: A new approach on soil evaluation, Geoderma, 2004, Vol. 121, pp. 95-112, https://doi.org/10.1016/j.geoderma.2003.09.012.
- Demattê J.A.M., da Silva Terra F., Spectral pedology: A new perspective on the evaluation of soils along pedogenetic alterations, Geoderma, 2014, Vol. 217, pp. 190-200, https://doi.org/10.1016/j.geoderma.2013.11.012.
- Demattê J.A.M., Dotto A.C., Paiva A.F.S., Sato M.V., Dalmolin R.S.D., de Araújo M. do S.B., da Silva E.B., Nanni M.R., ten Caten A., Noronha N.C., Lacerda M.P.C., de Araújo Filho J.C., Rizzo R., Bellinaso H., Francelino M.R., Schaefer C.E.G.R., Vicente L.E., dos Santos U.J., de Sá Barretto Sampaio E.V., Menezes R.S.C., de Souza J.J.L.L., Abrahão W.A.P., Coelho R.M., Grego C.R., Lani J.L., Fernandes A.R., Gonçalves D.A.M., Silva S.H.G., de Menezes M.D., Curi N., Couto E.G., dos Anjos L.H.C., Ceddia M.B., Pinheiro É.F.M., Grunwald S., Vasques G.M., Marques Júnior J., da Silva A.J., Barreto M.C. d. V., Nóbrega G.N., da Silva M.Z., de Souza S.F., Valladares G.S., Viana J.H.M., da Silva Terra F., Horák-Terra I., Fiorio P.R., da Silva R.C., Frade Júnior E.F., Lima R.H.C., Alba J.M.F., de Souza Junior V.S., Brefin M.D.L.M.S., Ruivo M.D.L.P., Ferreira T.O., Brait M.A., Caetano N.R., Bringhenti I., de Sousa Mendes W., Safanelli J.L., Guimarães C.C.B., Poppiel R.R., e Souza A.B., Quesada C.A., do Couto H.T.Z., The Brazilian Soil Spectral Library (BSSL): A general view, application and challenges, Geoderma, 2019, Vol. 354, pp. 113793, https://doi.org/10.1016/j.geoderma.2019.05.043.
- Demattê J.A.M., Fongaro C.T., Rizzo R., Safanelli J.L., Geospatial Soil Sensing System (GEOS3): A powerful data mining procedure to retrieve soil spectral reflectance from satellite images, Remote Sens. Environ., 2018, Vol. 212, pp. 161-175, https://doi.org/10.1016/j.rse.2018.04.047.
- Demattê J.A.M., Garcia G.J., Alteration of Soil Properties through a Weathering Sequence as Evaluated by Spectral Reflectance, Soil Sci. Soc. Am. J., 1999, Vol. 63, pp. 327-342, https://doi.org/10.2136/sssaj1999.03615995006300020010x.
- Demattê J.A.M., Horák-Terra I., Beirigo R.M., Terra F. da S., Marques K.P.P., Fongaro C.T., Silva A.C., Vidal-Torrado P., Genesis and properties of wetland soils by VIS-NIR-SWIR as a technique for environmental monitoring, J. Environ. Manage., 2017, Vol. 197, pp. 50-62, https://doi.org/10.1016/j.jenvman.2017.03.014.
- Demattê J.A.M., Mafra A.L., Bernardes F.F., Comportamento espectral de materiais de solos e de estruturas biogênicas associadas, Rev. Bras. Ciência do Solo, 1998, Vol. 22, pp. 621-630, https://doi.org/10.1590/s0100-06831998000400007.
- Dematte J.A.M., Nanni M.R., da Silva A.P., de Melo Filho J.F., Dos Santos W.C., Campos R.C., Soil density evaluated by spectral reflectance as an evidence of compaction effects, Int. J. Remote Sens., 2010, Vol. 31, pp. 403-422, https://doi.org/10.1080/01431160902893469.
- Demattê J.A.M., Nanni M.R., Formaggio A.R., Epiphanio J.C.N., Spectral reflectance for the mineralogical evaluation of Brazilian low clay activity soils, Int. J. Remote Sens., 2007, Vol. 28, pp. 4537-4559, https://doi.org/10.1080/01431160701250408.
- Demattê J.A.M., Novais J.J., Rosin N.A., Rosas J.T.F., Poppiel R.R., Dotto A.C., Paiva A.F.S., The Brazilian Soil Spectral Library (VIS-NIR-SWIR-MIR) Database: Open Access. Zenodo 2, 2023, https://doi.org/10.5281/zenodo.8092773.
- Demattê José A.M., Paiva A.F. da S., Poppiel R.R., Rosin N.A., Ruiz L.F.C., Mello F.A. de O., Minasny B., Grunwald S., Ge Y., Ben Dor E., Gholizadeh A., Gomez C., Chabrillat S., Francos N., Ayoubi S., Fiantis D., Biney J.K.M., Wang C., Belal A., Naimi S., Hafshejani N.A., Bellinaso H., Moura-Bueno J.M., Silvero N.E.Q., The Brazilian Soil Spectral Service (BraSpecS): A User-Friendly System for Global Soil Spectra Communication, Remote Sens., 2022, Vol. 14, n. 740, pp. 1-27, https://doi.org/10.3390/rs14030740.
- Demattê José A.M., Paiva A.F. da S., Poppiel R.R., Rosin N.A., Ruiz L.F.C., Mello F.A. de O., Minasny B., Grunwald S., Ge Y., Dor E. Ben, Gholizadeh A., Gomez C., Chabrillat S., Francos N., Ayoubi S., Fiantis D., Biney J.K.M., Wang C., Belal A., Naimi S., Hafshejani N.A., Bellinaso H., Moura-Bueno J.M., Silvero N.E.Q., Correction to: Demattê et al. The Brazilian Soil Spectral Service (BraSpecS): A User-Friendly System for Global Soil Spectra Communication, Remote Sens., 2022, Vol. 14, 740, pp. 1459, https://doi.org/10.3390/rs14061459.
- Demattê J.A.M., Safanelli J.L., Poppiel R.R., Rizzo R., Silvero N.E.Q., Mendes W. de S., Bonfatti B.R., Dotto A.C., Salazar D.F.U., Mello F.A. de O., Paiva A.F. da S., Souza A.B., Santos N.V. dos, Maria Nascimento C., Mello D.C. de, Bellinaso H., Gonzaga Neto L., Amorim M.T.A., Resende M.E.B. de, Vieira J. da S., Queiroz L.G. de, Gallo B.C., Sayão V.M., Lisboa C.J. da S., Bare Earth’s Surface Spectra as a Proxy for Soil Resource Monitoring, Sci. Rep., 2020, Vol. 10, n. 4461, pp. 1-11, https://doi.org/10.1038/s41598-020-61408-1.
- Epiphanio J.C.N., Formaggio A.R., Valeriano M.M., Comportamento espectral de solos do Estado de São Paulo, Inpe, 1992. 143 p.
- Formaggio A., Epiphanio J., Valeriano M., Oliveira J., Comportamento espectral (450-2.450 nm) de solos Tropicals de Sao Paulo, Rev. Bras. Cienc. Do Solo, 1996, Vol. 20, pp. 467-474,
- Gallo B.C., Demattê J.A.M., Rizzo R., Safanelli J.L., Mendes W. de S., Lepsch I.F., Sato M. V., Romero D.J., Lacerda M.P.C., Multi-temporal satellite images on topsoil attribute quantification and the relationship with soil classes and geology, Remote Sens., 2018, Vol. 10, No. 1571, https://doi.org/10.3390/rs10101571.
- Greschuk L.T., Demattê J.A.M., Silvero N.E.Q., Rosin N.A., A soil productivity system reveals most Brazilian agricultural lands are below their maximum potential, Sci. Rep., 2023, Vol. 13, 14103, https://doi.org/10.1038/s41598-023-39981-y.
- Harris R., Baumann I., Open data policies and satellite Earth observation, Space Policy 32, 2015, https://doi.org/10.1016/j.spacepol.2015.01.001.
- Instituto Brasileiro de Geografia e Estatística, IBGE, Brasil em Síntese, Inst. Bras. Geogr. e Estatística, 2017. https://brasilemsintese.ibge.gov.br
- Novais J., Lacerda M.P.C., Sentinel-2 imagery usage on environmental monitoring of land use and occupation in a microwatershed in Central Brazil, Gaia Sci., 2021, Vol. 15, pp. 76-92, https://doi.org/10.22478/ufpb.1981-1268.2021v15n1.54515.
- Kuhn M., Johnson K., Applied predictive modeling, Applied Predictive Modeling, 2013, pp 329-367, https://doi.org/10.1007/978-1-4614-6849-3.
- Kuhn M., Quinlan R., Cubist: rule- and instance-based regression modeling, 2018, 14 p.
- Lehmann J., Bossio D.A., Kögel-Knabner I., Rillig M.C., The concept and future prospects of soil health, Nat. Rev. Earth Environ., 2020, Vol. 1, pp. 544-553, https://doi.org/10.1038/s43017-020-0080-8.
- Mello F.A.O., Demattê J.A.M., Bellinaso H., Poppiel R.R., Rizzo R., de Mello D.C., Rosin N.A., Rosas J.T.F., Silvero N.E.Q., Rodríguez-Albarracín H.S., Remote sensing imagery detects hydromorphic soils hidden under agriculture system, Sci. Rep., 2023, Vol. 13, No. 10897, https://doi.org/10.1038/s41598-023-36219-9.
- Mendes W. de S., Demattê J.A.M., de Resende M.E.B., Chimelo Ruiz L.F., César de Mello D., Fim Rosas J.T., Quiñonez Silvero N.E., Ferracciú Alleoni L.R., Colzato M., Rosin N.A., Campos L.R., A remote sensing framework to map potential toxic elements in agricultural soils in the humid tropics, Environ. Pollut., 2022a, Vol. 292, No. 118397, https://doi.org/10.1016/j.envpol.2021.118397.
- Mendes W. de S., Demattê J.A.M., Rosin N.A., Terra F. da S., Poppiel R.R., Urbina-Salazar D.F., Boechat C.L., Silva E.B., Curi N., Silva S.H.G., José dos Santos U., Souza Valladares G., The Brazilian soil Mid-infrared Spectral Library: The Power of the Fundamental Range, Geoderma, 2022b, Vol. 415, No. 115776, https://doi.org/10.1016/j.geoderma.2022.115776.
- Nanni M.R., Povh F.P., Demattê J.A.M., Oliveira R.B. de, Chicati M.L., Cezar E., Optimum size in grid soil sampling for variable rate application in site-specific management, Sci. Agric., 2011, Vol. 68, No. 3, pp. 386-392, https://doi.org/10.1590/s0103-90162011000300017.
- Nocita M., Stevens A., Toth G., Panagos P., van Wesemael B., Montanarella L., Prediction of soil organic carbon content by diffuse reflectance spectroscopy using a local partial least square regression approach, Soil Biol. Biochem., 2014, Vol. 68, pp. 337-347, https://doi.org/10.1016/j.soilbio.2013.10.022.
- Novais J.J., Lacerda M.P.C., Sano E.E., Demattê J.A.M., Oliveira M.P., Digital Soil Mapping by Multispectral Modeling Using Cloud-Computed Landsat Time Series, Remote Sens., 2021, Vol. 13, pp. 1-18, https://doi.org/10.3390/rs13061181.
- Novais J.J., Poppiel R.R., Lacerda M.P.C., Demattê J.A.M., VNIR-SWIR Spectroscopy, XRD and Traditional Analyses for Pedomorphogeological Assessment in a Tropical Toposequence, AgriEngineering, 2023, Vol. 5, pp. 1581-1598, https://doi.org/10.3390/agriengineering5030098.
- Obukhov A.I., Orlov D.S., Spectral reflectivity of the major soils group and possibility of using diffuse reflection in soil investigation, Sov. Soil Sci., 1964, Vol. 1, pp. 174-184.
- Paiva A.F. da S., Poppiel R.R., Rosin N.A., Greschuk L.T., Rosas J.T.F., Demattê J.A.M., The Brazilian Program of soil analysis via spectroscopy (ProBASE): Combining spectroscopy and wet laboratories to understand new technologies, Geoderma, 2022, Vol. 421, https://doi.org/10.1016/j.geoderma.2022.115905.
- Poppiel R.R., Lacerda M.P.C., Safanelli J.L., Rizzo R., Oliveira M.P., Novais J.J., Demattê J.A.M., Mapping at 30 m resolution of soil attributes at multiple depths in midwest Brazil, Remote Sens., 2019, Vol. 11, https://doi.org/10.3390/rs11242905.
- Poppiel R.R., Lacerda M.P.C., Safanelli J.L., Rizzo R., Oliveira M.P., Novais J.J., Demattê J.A.M., Mapping at 30 m resolution of soil attributes at multiple depths in midwest Brazil, Remote Sens., 2019, Vol. 11, No. 24, https://doi.org/10.3390/rs11242905.
- Poppiel R.R., Paiva A.F. da S., Demattê J.A.M., Bridging the gap between soil spectroscopy and traditional laboratory: Insights for routine implementation, Geoderma, 2022, Vol. 425, https://doi.org/10.1016/j.geoderma.2022.116029.
- Quinlan J.R., C4.5 Programs for Machine Learning, Morgan Kaufmann Publishers, Inc., San Mateo, CA, 1992. pp. 301.
- R Core Team, R: A language and environment for statistical computing, R Found. Stat. Comput., 2019.
- Ramos F.T., Dores E.F. de C., Weber O.L. do. S., Beber D.C., Campelo J.H., Maia J.C. d. S., Soil organic matter doubles the cation exchange capacity of tropical soil under no-till farming in Brazil, J. Sci. Food Agric., 2018, Vol. 98, pp. 3595-3602, https://doi.org/10.1002/jsfa.8881.
- Rizzo R., Demattê J.A.M., Lepsch I.F., Gallo B.C., Fongaro C.T., Digital soil mapping at local scale using a multi-depth Vis-NIR spectral library and terrain attributes, Geoderma, 2016, Vol. 27, pp. 18-27, https://doi.org/10.1016/j.geoderma.2016.03.019.
- Romero D.J., Ben-Dor E., Demattê J.A.M., Souza A.B. e., Vicente L.E., Tavares T.R., Martello M., Strabeli T.F., da Silva Barros P.P., Fiorio P.R., Gallo B.C., Sato M.V., Eitelwein M.T., Internal soil standard method for the Brazilian soil spectral library: Performance and proximate analysis, Geoderma, 2018, Vol. 312, pp. 95-103, https://doi.org/10.1016/j.geoderma.2017.09.014.
- Rosin N.A., Demattê J.A.M., Poppiel R.R., Silvero N.E.Q., Rodriguez-Albarracin H.S., Rosas J.T.F., Greschuk L.T., Bellinaso H., Minasny B., Gomez C., Marques Júnior J., Fernandes K., Mapping Brazilian soil mineralogy using proximal and remote sensing data, Geoderma, 2023, 432, https://doi.org/10.1016/j.geoderma.2023.116413.
- Safanelli J.L., Chabrillat S., Ben-Dor E., Demattê J.A.M., Multispectral models from bare soil composites for mapping topsoil properties over Europe, Remote Sens., 2020, Vol. 12, https://doi.org/10.3390/RS12091369.
- Santos U.J. dos, Demattê J.A. de M., Menezes R.S.C., Dotto A.C., Guimarães C.C.B., Alves B.J.R., Primo D.C., Sampaio E.V. de S.B., Predicting carbon and nitrogen by visible near-infrared (Vis-NIR) and mid-infrared (MIR) spectroscopy in soils of Northeast Brazil, Geoderma, 2020, Vol. 23, https://doi.org/10.1016/j.geodrs.2020.e00333.
- Sato M.V., Primeira aproximação da biblioteca espectral de solos do Brasil: caracterização de espectros de solos e quantificação de atributos: Dissertação de Mestrado, Escola Superior de Agricultura Luiz de Queiroz, Universidade de São Paulo, Piracicaba, 2015, pp. 103, https://doi.org/10.11606/D.11.2015.tde-15102015-152045.
- Schaefer C.E.G.R., Fabris J.D., Ker J.C., Minerals in the clay fraction of Brazilian Latosols (Oxisols): a review, Clay Miner, 2008, Vol. 43, pp. 137-154, https://doi.org/10.1180/claymin.2008.043.1.11.
- Schoeneberger P.J., Wysocki D.A., Benham E.C., Soil Survey Staff, Field Book for Describing and Sampling Soils, Version 3.0, Natural Resources Conservation Service, National Soil Survey Center, Lincoln, NE. Natl. Soil Surv. Ctr., Lincoln, NE, 2012.
- Souza A.B., Demattê J.A.M., Mello F.A.O., Salazar D.F.U., Mendes W.S., Safanelli J.L., Ratio of Clay Spectroscopic Indices and its approach on soil morphometry, Geoderma, 2020, Vol. 357, https://doi.org/10.1016/j.geoderma.2019.113963.
- Stenberg B., Viscarra Rossel R.A., Mouazen A.M., Wetterlind J., Visible and Near Infrared Spectroscopy in Soil Science, Advances in Agronomy, 2010, Vol. 107, pp. 163-215, https://doi.org/10.1016/S0065-2113(10)07005-7.
- Stoner E.R., Baumgardner M.F., Characteristic Variations in Reflectance of Surface Soils, Soil Sci. Soc. Am. J., 1981, Vol. 45, pp. 1161-1165, https://doi.org/10.2136/sssaj1981.03615995004500060031x.
- Teixeira P.C., Donagemma G.K., Fontana A., Teixeira W.G., Manual de métodos de análise de solo, Embrapa, 2017.
- Terra F.S., Demattê J.A.M., Viscarra Rossel R.A., Spectral libraries for quantitative analyses of tropical Brazilian soils: Comparing vis-NIR and mid-IR reflectance data, Geoderma, 2015, Vol. 255-256, pp. 81-93, https://doi.org/10.1016/j.geoderma.2015.04.017.
- Tiessen H., Cuevas E., Chacon P., The role of soil organic matter in sustaining soil fertility, Nature, 1994, Vol. 371, pp. 783-785, https://doi.org/10.1038/371783a0.
- Tziolas N., Tsakiridis N., Ogen Y., Kalopesa E., Ben-Dor E., Theocharis J., Zalidis G., An integrated methodology using open soil spectral libraries and Earth Observation data for soil organic carbon estimations in support of soil-related SDGs, Remote Sens. Environ., 2020, Vol. 244, https://doi.org/10.1016/j.rse.2020.111793.
- Viscarra Rossel R.A., Behrens T., Ben-Dor E., Brown D.J., Demattê J.A.M., Shepherd K.D., Shi Z., Stenberg B., Stevens A., Adamchuk V., Aïchi H., Barthès B.G., Bartholomeus H.M., Bayer A.D., Bernoux M., Böttcher K., Brodský L., Du C.W., Chappell A., Fouad Y., Genot V., Gomez C., Grunwald S., Gubler A., Guerrero C., Hedley C.B., Knadel M., Morrás H.J.M., Nocita M., Ramirez-Lopez L., Roudier P., Campos E.M.R., Sanborn P., Sellitto V.M., Sudduth K.A., Rawlins B.G., Walter C., Winowiecki L.A., Hong S.Y., Ji W., A global spectral library to characterize the world’s soil, Earth-Science Rev., 2016, Vol. 155, pp. 198-230, https://doi.org/10.1016/j.earscirev.2016.01.012.
- Viscarra Rossel R.A., Webster R., Bui E.N., Baldock J.A., Baseline map of organic carbon in Australian soil to support national carbon accounting and monitoring under climate change, Glob. Chang. Biol., 2014, Vol. 20, pp. 2953-2970, https://doi.org/10.1111/gcb.12569.
