The determinants of the informal economy: an empirical study from Uzbekistan

Author: Ergashev R.R.
Journal: Экономика и социум @ekonomika-socium
Section: Основной раздел
Article in issue: 2-2 (93), 2022.
Free access
Shadow economy, tax compliance, tax burden, ict, electronic invoices
Short address: https://sciup.org/140292647
IDR: 140292647
Text of the article The determinants of the informal economy: an empirical study from Uzbekistan
Today, taxes are not only a source of financing public spending, but also a fiscal instrument that can be used as an effective, flexible and prudent forecasting tool to improve the process of social protection and accelerate economic development. Moreover, tax mechanisms are also widely used in global operations as an effective tool in combating the informal economy. This is because those who work in the informal economy conceal the tax base or do not fully account for the turnover, which has a direct impact on state budget revenues.
It should be noted that the regulation of the economy through tax mechanisms has both financial and legal implications, and a well-thought-out tax policy can serve not only to reduce the tax burden, but also to ensure the stability of the country's economy.
The efficiency of tax policy in reducing the size of the shadow economy depends on overall capability of tax administration to evaluate each taxpayers behavior and establish mechanisms to prevent possible negative situations relating thereof.
This, in turn, necessitates the development of tax policy, taking into account the values of the population, living standards and the specifics of business entities operating in it. In view of the above, the improved tax mechanisms allow for the timely and maximum collection of all taxes and other mandatory payments established by law, while maintaining confidence in the tax system and its administration.
Literature review
Studies on the reduction of the shadow economy and the experience of developed countries in this regard show that the core of reforms should be the issue of improving tax compliance [1].
Tax compliance is one of the most widely discussed issues in scientific and political circles in recent years, one of the main reasons for which is the collapse of the tax base due to the low level of compliance in most developing economies [2].
Tax compliance is a broad and complex concept. As for Martiga [3] it basically involves the voluntary, complete and timely fulfillment of all tax obligations established by law.
In this case, the following are the main issues:
-
• submission of tax reports in a timely manner;
-
• provide accurate information on income and deductions;
-
• timely and full payment of taxes and other mandatory payments.
Palil and Mustafa [4] describes high tax compliance as a combination of taxpayers willingness to comply with tax legislation, provide accurate information about their income, correctly calculate and claim deductions and benefits, and pay all taxes on time and in full.
According to Heider`s, compliance depends on individual behavior, which in turn emphasizes that an individual's behavior is formed as a result of internal or external influences. In this case, the actions that occur as a result of internal influences are under the personal control of the individual. Conversely, behaviors that occur as a result of external influences reflect an individual’s behavior toward a situation or environmental factor, i.e., their response [5, 6].
Based on the above, we can define tax compliance as the voluntary, timely and complete fulfillment of tax obligations by taxpayers.
Since the concept of trust plays a central role in improving tax compliance, the most important factor influencing it is related to tax policy, and research shows that a number of principles need to be taken into account when developing it. In particular, Niyazmetov [7] in his research on the basic principles of tax policy and their role:
-
1. The efficiency of the tax system.
-
2. Fairness of taxation.
-
3. Simplicity of the taxation system.
-
4. Adequacy of taxation.
-
5. Flexibility of taxation.
-
6. Transparency of the tax system.
-
7. Sustainability of tax policy.
The tax policy developed (improved) taking into account the above principles, the mechanisms and tools for its implementation will have a two-way effect in improving the level of tax compliance [8].
First, a tax policy developed in accordance with the socio-economic situation of the population and the goals of business entities ensures the voluntary fulfillment of taxpayers' obligations.
Second, businesses that intend to start or operate with the goal of tax evasion or evasion will be forced to change their decisions, recognizing that tax evasion is unlikely under carefully designed tax legislation and administration.
The low level of tax compliance is also directly related to the tax culture, which is also recognized as an important basic principle of tax policy. In addition to taxpayers' knowledge of taxation, tax culture reflects the state of tax policy developers, scholars, experts in the field, government fiscal agencies, and the relationship between taxpayers [9].
According to Niyazmetov [7], the tax culture depends primarily on the state of the tax legislation in force in the country, and its high or low level, in turn, depends in many respects on the developers of tax policy. In addition, the culture of taxpayers also depends on the behavior of taxpayers, their attitude towards taxpayers.
In addition to the tax factors listed above, tax compliance also depends on a number of institutional, socio-economic and demographic factors, and their impact should be taken into account when developing (or improving) tax policy in line with reducing the size of the shadow economy.
However, research shows that in most cases the impact of these factors in developing countries is not analyzed in detail, and tax policy is projected only as a source of funding for state budget revenues. This, in turn, leads to a decrease in the level of tax compliance in the country, resulting in the creation of a large amount of value added outside the tax coverage, ie in the informal economy [10].
In particular, the share of the shadow economy in developed countries is 920% of GDP, in developing countries - 25-65%, in Eastern Europe and Central Asia - an average of 38.5% [11]. These figures indicate that countries have reserves of additional tax sources at the same percentage, but even higher.
This means that the informal economy in any country operates in parallel with the formal economy. But its level varies in states depending on the perfection of the legislation, the fairness of taxation, the mentality of the people and a number of other tax compliance factors [12].
The study of the level of impact of these factors and the analysis of the effectiveness of measures taken in our country and abroad to eliminate them will allow to determine the direction of reforms needed to reduce the size of the informal economy in Uzbekistan.
Methodology
In order to determine the factors that contribute to the large gap between the informal economy in developed and developing countries, their impact and the effectiveness of reforms to prevent it, from 2004 to 2015 from 44 countries (34 OECD countries and 10 OECD countries) Econometric analysis was carried out on the basis of the indicators obtained from the Commonwealth of Independent States (CIS).
The share of the informal economy for use in econometric analysis and the factors influencing it were classified by the following indicators.
Dependent variable
The size of the informal economy is obtained as a dependent variable, and the data are based on indicators calculated by Medina and Schneider [13] based on the MIMIC (Multiple Indicator and Multiple Cause) model. The size of the informal economy for Uzbekistan is based on indicators calculated by the United Nations Development Program (UNDP) on the basis of the MIMIC model [14]. This approach allows the size of the shadow economy to be reflected as a share of GDP. The average share of informality in the economies of the 44 countries covered by the study is 20%, which is 7.8% lower than the world average. In the OECD and CIS countries, this figure is 14.5 and 38.5 percent, respectively, while in Uzbekistan it is 45.3 percent (see Figure 2).
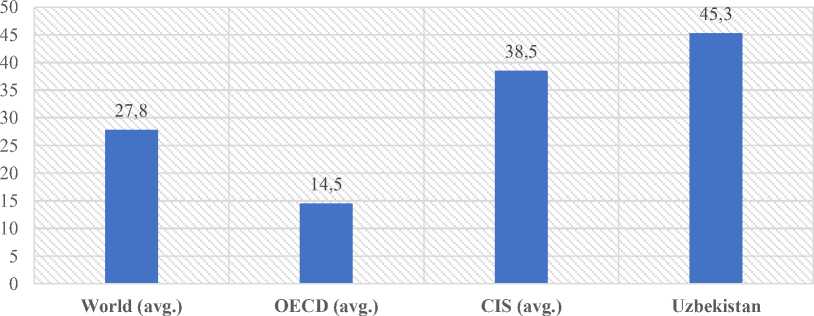
Figure 2. Country groups and the share of informal economy in GDP in Uzbekistan (2015) 1
Independent variable
Research conducted by foreign and national economists shows that the factors regulated by the tax policy and administration of the informal economy are mainly related to the tax complex, and the experience of countries in improving it shows that work has been done in two directions. In particular,
-
- Incentives for industries and activities affected by the tax burden through various tax mechanisms; and
-
- Improving tax administration on the basis of advanced information technologies.
Table 1 provides a summary of the key indicators used in the analysis.
Table 1. Brief description of variables
|
Indicator name and abbreviations |
Brief description and source |
Expected correlation |
|
Тобе ўзгарувчи (Yit) |
||
|
The size of the informal economy (SE) |
The share of the informal economy is the share of GDP (in%). Source: Medina and Schneider (2018); UNDP (2018). |
|
|
Main (concerned) variables, ( X it ) |
||
|
Start-up costs ( CS ) |
All costs associated with the registration of business, as a share of GDP per capita (in%). Source: World Bank (worldbank.org) |
+ |
|
Compliance costs (CC) |
Index of time spent on fulfillment of tax obligations. (0 -past; 10 - high) Source: Fraser Institute (fraserinstitute.org) |
+ |
|
Tax burden (TB) |
The sum of the rates of total taxes and mandatory payments levied on profits (%). Source: World Bank (worldbank.org) |
+ |
|
Information and communication technologies (ICT) |
Index of the level of development of information and communication technologies (1 - low; 50 - high). Source: UNCTAD (unctad.org) |
˗ |
|
E-Invoice (EI) |
An indicator that reflects the period in which the electronic invoicing practice was introduced (1) and the period in which it was not introduced (0). Source: Formed by the author on the basis of internet data. |
˗ |
|
Controlling variables, ( Z it ) |
||
1 Муаллифлар томонидан тайёрланди.
|
Control of corruption (СС) |
Index of corruption in the country (-2.5 - weak; 2.5 - strong) |
— |
|
Income level (IL) |
GDP per capita (%). Source: World Bank (worldbank.org) |
— |
|
Level of education (EL) |
The level of admission to secondary education is higher than the number of all children eligible for education (in%). Source: World Bank (worldbank.org) |
— |
Analyzing the statistics on the indicators listed above, Table 2 shows that the average level of the informal economy in 44 countries was 21.3% of GDP (20042015), with the highest rate being 53.07% (2009) in Georgia. observed.
|
Table 2. Descriptive statistics |
||||||
|
All countries |
||||||
|
Number of |
Standard deviation |
|||||
|
Variables |
observation s |
Mean |
Minimum |
Maximum |
VIF |
|
|
The size of the shadow economy |
528 |
21.31 |
12.54 |
6.16 |
68.46 |
- |
|
Start-up costs |
1.0 |
|||||
|
528 |
22.63 |
47.93 |
0.00 |
429.20 |
6 |
|
|
Compensation costs |
1.4 |
|||||
|
494 |
7.49 |
1.53 |
0 |
9.38 |
9 |
|
|
Tax burden |
1.1 |
|||||
|
451 |
44.67 |
17.79 |
15.3 |
137.2 |
6 |
|
|
AKT |
1.3 |
|||||
|
528 |
16.78 |
6.34 |
3.23 |
31.71 |
6 |
|
|
E-invoice |
1.0 |
|||||
|
528 |
0.12 |
0.32 |
0.00 |
1.00 |
7 |
|
|
Corruption control |
1.8 |
|||||
|
528 |
0.82 |
1.15 |
-1.37 |
17199 |
7 |
|
|
Income level |
1.1 |
|||||
|
528 |
30400 |
24189 |
311 |
118823 |
1 |
|
|
Level of education |
1.4 |
|||||
|
468 |
103.52 |
14.60 |
80.04 |
163.93 |
8 |
|
|
OECD countries |
||||||
|
Number of |
Standard deviation |
|||||
|
Variables |
observation s |
Mean |
Minimum |
Maximum |
VIF |
|
|
The size of the shadow economy |
408 |
15.74 |
6.51 |
6.16 |
32.65 |
- |
|
Start-up costs |
1.1 |
|||||
|
408 |
23.56 |
42.63 |
0.00 |
332 |
0 |
|
|
Compensation costs |
1.6 |
|||||
|
407 |
7.71 |
1.37 |
0 |
9.38 |
4 |
|
|
Tax burden |
1.3 |
|||||
|
349 |
42.28 |
12.43 |
19.8 |
76.7 |
2 |
|
|
AKT |
1.2 |
|||||
|
408 |
18.43 |
5.37 |
4.04 |
31.71 |
6 |
|
|
E-invoice |
1.1 |
|||||
|
408 |
0.13 |
0.33 |
0.00 |
1.00 |
0 |
|
|
Corruption control |
1.9 |
|||||
|
408 |
1.31 |
0.78 |
-0.77 |
2.47 |
8 |
|
|
Income level |
1.0 |
|||||
|
408 |
38132 |
22133 |
6040 |
118823 |
6 |
|
|
Level of education |
1.3 |
|||||
|
377 |
106.19 |
14.62 |
80.04 |
163.93 |
7 |
|
|
CIS countries |
||||||
|
Variables |
Number of observation s |
Mean |
Standard deviation |
Minimum |
Maximum |
VIF |
|
The size of the shadow economy |
120 |
40.25 |
9.11 |
23.70 |
68.46 |
- |
|
Start-up costs |
120 |
19.46 |
62.81 |
0.00 |
429.20 |
1.4 0 |
|
Compensation costs |
87 |
6.48 |
1.83 |
0 |
8.11 |
1.8 8 |
|
Tax burden |
102 |
52.83 |
28.11 |
15.3 |
137.2 |
2.1 4 |
|
AKT |
120 |
11.17 |
6.19 |
3.23 |
30.05 |
2.3 0 |
|
E-invoice |
120 |
0.08 |
0.28 |
0.00 |
1.00 |
1.5 3 |
|
Corruption control |
120 |
-0.85 |
0.42 |
-1.37 |
0.79 |
2.3 3 |
|
Income level |
120 |
4113 |
3743 |
311 |
16007 |
1.2 5 |
|
Level of education |
91 |
92.49 |
7.78 |
80.32 |
111.93 |
1.5 0 |
A balanced panel data set was used in the econometric analysis. The panel data set allows you to increase the number of observations as they are crossed over years and different countries. This form is also non-observable and allows the management of features and time effects specific to country units [15].
The mathematical expression of the primary econometric model formed in the analysis is given in equation 1, which is based on the Ordinary Least Squares (OLS) method:
SEit = α +βXit +δŹit+ εit (1) i = 1, 2, 3,…, N t = 2004, 2005,…, T where, SEit - t is the size of the informal economy available in country i; α -intercept; coefficients β and δ; X – set of concerned variables; Ź - set of controlling variables; εit - displays a standard error term.
Because the panel data set in our study was shorter than the number of country units in time (large N and small T ), the results of our primary model (1) were validated using models recommended by Gujarati and Porter [16], particularly Fixed Effects (FE) and Random Effects (RE). check and determine the appropriate model for our data set.
SE it = (α+ u i ) +β X it +δŹ it + ν it
In contrast, in the Random Effects (RE) model, u i is considered as a component of a complex standard error (ε) indicator, which allows the random deviation of the standard deviation across the country and (or) over time (Equation 3). Also, unlike FE , RE does not imply the influence of country-specific factors and no correlation between arbitrary variables, and evaluates the coefficient and intercept value (α, β, and δ) of the factors under study as invariant.
SE it = α +β X it +δŹ it + (u i + ν it ) (3)
In our econometric analysis, we consider the results of this three model in three cases. In particular, in the first case, the OLS , RE and FE models are used for all selected 44 countries, in the second case for the OECD member states and in the third case for the CIS countries.
Prior to the model-based regression, a series of tests were performed, and the necessary adjustments were made to the selected models based on their results.
In particular, the Variance Inflation Factor (VIF) test was performed to check the degree of multicollinearity between the selected independent variables. The test results showed that the degree of reflection of all regressors were less than 5 (see Table 2), i.e., the degree of error that could occur as a result of multicollinearity was statistically insignificant [16].
The Cook-Weisberg test was also performed to determine whether the selected indicators were homoskedastic or heteroskedastic across the values of the dependent variables under study. The test results showed that there was a problem of “heteroskedasticity” (see Table 3). In order to solve the existing problem, the “robust” specification was selected [17].
It is important to determine the appropriate model for the data set before interpreting the analysis results. For this reason, the “Lagrangian Multiplier” (LM) diagnostic test, initially recommended by Breusch and Pagan [18], was performed. This test shows which of the OLS or RE models is compatible with our panel kit. As can be seen from Table 3, in all three cases, the LM test supported the RE model results.
The Hausman test [19] was also performed to select between the RE and FE models. According to the results of this test, the regression of the data set covering 44 OECD and CIS countries, as well as the data set covering 34 OECD countries, shows that the results of the RE model are reliable. In contrast, the Hausman test showed that the FE was the most suitable model for the panel set data formed for the 10 CIS countries (see Table 3).
Based on the below test results, if we analyze the data of the relevant models in all three cases, the initial situation, i.e. RE model results obtained for 44 countries, shows that Start-up costs are statistically significant at 99% (or 0.01 coefficient). This means that a 1% increase in the cost of official business registration in these countries will lead to an increase in the share of clandestine activity in the economy by 0.008%. The impact of this indicator on business entities operating in the OECD countries is higher, which is also statistically significant at 99%. It was found that a 1% increase in these expenditures could lead to a 0.011% increase in the share of the shadow economy in the OECD countries. However, although the impact of this indicator is greater in the CIS countries, we can see that it is not statistically significant. This indicates that the impact of this factor is secondary or insignificant for businesses operating in these countries. These results support the findings of a study conducted by Henrique et al. [20] in developed countries. Their research showed that the abolition of registration costs in developing countries with high levels of corruption had no effect on the voluntary registration of informal entities or, in some cases, an increase in the number of informal operators.
In terms of time spent on tax compliance and the impact of financial costs (compliance costs) on the share of the shadow economy, the results for the OECD and CIS countries are statistically significant at 90% (or 0.1), which indicates that 1 % increase thereof contributes to 0.223 and 0.661% growth in the informal economy, respectively.
Table 3. Results of regression analysis of informal economic factors
|
Variables |
Барча мамлакатлар (44 мамлакат) |
ИҲТТ мамлакатлари (34 мамлакат) |
МДҲ мамлакатлари (10 мамлакат) |
|
RE R |
RE R |
FE R |
|
|
CS it |
0.008*** |
0.011*** |
0.045 |
|
(0.002) |
(0.002) |
(0.040) |
|
|
CC it |
0.384*** |
0.233* |
0.166* |
|
(0.131) |
(0.126) |
(0.644) |
|
|
TB it |
0.025* |
0.011* |
0.078** |
|
(0.015) |
(0.018) |
(0.048) |
|
|
ICT it |
-0.318*** |
-0.205*** |
-0.675*** |
|
(0.039) |
(0.036) |
(0.198) |
|
|
EI it |
-0.800** |
-0.562* |
-1.611** |
|
(0.322) |
(0.310) |
(1.156) |
|
|
CoC it |
-5.624*** |
-3.639*** |
-10.572*** |
|
(0.488) |
(0.463) |
(1.808) |
|
|
IL it |
-0.146*** |
-0.142*** |
-0.156*** |
|
(0.020) |
(0.020) |
(0.053) |
|
|
EL it |
-0.014 |
-0.002 |
-0.179 |
|
(0.012) |
(0.011) |
(0.109) |
|
|
Constant |
31.499*** |
25.408*** |
27.494** |
|
(2.286) |
(2.054) |
(12.334) |
|
|
Observations |
382 |
329 |
53 |
|
Number of countries |
44 |
34 |
10 |
|
R2 |
0.592 |
0.509 |
0.786 |
|
F-statistics |
354.32*** |
196.55*** |
17.48*** |
|
1 Cook-Weisberg test |
- |
- |
- |
|
2 Breusch - Pagan LM test |
1115.80*** |
853.02*** |
- |
|
3 Hausman test |
- |
- |
1272.82*** |
|
R - «Robust» standart errors |
in paranthesis (ε) . |
*** - Significance level p<0.01 (99%); ** -p<0.05 (95%); * - p<0.1 (90%).
Note: 1 Cook-Weisberg test - Н 0 – No Heteroskedasticty. 2 Breusch - Pagan LM test: Н 0 – OLS model is appropriate. 3 Hausman test: Н 0 – RE model is appropriate.
Similarly, the tax burden reflected by the sum of income tax rates is positively correlated with the size of the informal economy, and in all three cases the results are statistically significant, reaching 90% (or a 0.01 coefficient) in OECD countries and 95% in CIS countries (or coefficient of 0.05). It was confirmed that as a result of a 1% increase in this factor, the informal economy will grow by 0.011% in the OECD countries and by 0.078% in the CIS countries.
In order to assess the role of the main object of the study, ie the improvement of tax administration on the basis of information and communication technologies in reducing the share of the shadow economy, the index of ICT development in the country was obtained. At the same time, it is estimated that with the development of ICT in the country, the level of its implementation in various fields (tax authorities) will increase [21]. Econometric analyzes showed that the impact rate of this factor was high and statistically significant (99% or 0.01 coefficient) in reducing the size of the shadow economy in all three cases. In particular, our analysis of 44 countries showed that an increase in the level of ICT development in the country by 1 index will reduce the level of economic informality by 0.318%. However, the impact rate of this factor in developed OECD countries (-0.205%) is lower (-0.675%) than in the CIS countries, which are economies in transition, which in turn is due to the fact that the level of ICT development varies in these two groups. It can be concluded that the CIS countries have an opportunity to effectively combat tax evasion through the further development of ICT and its application in the activities of tax authorities.
The role of electronic invoicing in the fight against the informal economy through the improvement of the VAT mechanism is great, it is an effective tax instrument that is widely used today in developed countries. The effect of einvoices in reducing the share of the shadow economy was statistically significant at 95% (or 0.05) in both countries, with mandatory introduction in the OECD countries contributing to an average of 0.562% in the shadow economy and 1.611% in the CIS.
The size of the shadow economy in countries depends on the degree of transparency and legitimacy of public administration institutions, and the high level of corruption in them increases the impact of other factors and reduces the effectiveness of tax mechanisms used to combat them. This is because corruption and the informal economy appear as complementary or substitute and encourage business entities to operate in the informal economy by acting as a specific form of taxation. Therefore, it is necessary for countries to take measures to reduce corruption in the development (or improvement) of mechanisms to combat the shadow economy [22].
In our empirical analysis, the significance level of the Control of corruption indicator is statistically 99% (or a coefficient of 0.01) in all three cases. This, in turn, indicates that the improvement of corruption control in the OIC countries by a factor of 1 will contribute to the reduction of the share of the shadow economy by 3.639 percent. However, due to the high level of corruption in the CIS countries, the results of econometric analysis show that an increase in the control of corruption by a factor of 1 in these countries will reduce informality in the economy by 10.572%.
Conclusions
-
1. The shadow economy is a fact of life in countries that reflects all forms of economic activity that are hidden from official authority for monetary, regulatory, and institutional purposes.
-
2. An analysis of the scientific and theoretical literature revealed that the main factors contributing to the expansion of the shadow economy are fiscal factors such as the burden of taxes and mandatory payments, tax culture, the quality of public institutions.
-
3. Studies have shown that the issue of improving tax compliance should be at the heart of tax reform in reducing the size of the shadow economy. At the same time, it is important to ensure that taxpayers fulfill their tax obligations voluntarily, in a timely manner and in full.
-
4. The level of tax collection concludes how formed three types of confidence, that is, the righteousness of the tax system, which is directly related to the wise system of trust and confidence in the potential of the budget.
-
5. Increasing confidence in the tax system requires improving the tax culture, reducing compliance costs, designing tax policy on the basis of fundamental principles, optimizing the elements of the tax mechanism, improving tax control on the basis of information and communication technologies.
-
6. The analysis of the measures taken to improve the tax complex in the OIC and CIS countries confirms that the countries have implemented reforms in two main areas. These are reflected in the measures taken to optimize the tax burden and improve the capacity of tax administration on the basis of information and communication technologies.
-
7. An econometric analysis of the impact of tax compliance factors on the growth of the shadow economy and the impact of reforms in the OIC and CIS countries on their elimination showed that start-ups and compliance costs, tax burden and corruption in the country are the main factors influencing the informal sector. He also noted that the introduction of electronic invoicing and the level of development of information technology in the country play an important role in their elimination.
References The determinants of the informal economy: an empirical study from Uzbekistan
- The Organisation for Economic Co-operation and Development (OECD), 2014.Compliance Risk Management: Managing and Improving Tax Compliance.Committee on Fiscal Affairs.
- International Monetary Fund (IMF), 2011. Revenue Mobilization in Developing Countries. Prepared by the Fiscal Affairs Department. [Электрон ресурс] URL https://www.imf.org/external/np/pp/eng/2011/030811.pdf.
- Marti, L. O., 2010. Taxpayers' attitudes and tax compliance behaviour in Kenya. African Journal of Business & Management, 1. 112-122.
- Palil M., and Mustapha F., 2011. Determinants of tax compliance in Asia: a case of Malaysia. EurJSocSci 24(1), 7-32.
- Heider F., 1958. The Psychology of Interpersonal Relations. New York: Wiley.
