The evolution of demographic and social construction of the age of "old age"

Author: Barsukov Vitalii N., Kalachikova Olga N.
Journal: Economic and Social Changes: Facts, Trends, Forecast @volnc-esc-en
Section: Theoretical issues
Article in issue: 1 т.13, 2020.
Free access
In the 21st century, global demographic system is in the transition from the stage of demographic dividend implementation to population ageing. A global trend of the age structure transformation is a new, by the history’s standards, phenomenon. Reasons and mechanisms of its emergence are revealed and empirically confirmed. However, the issue of the population ageing’s consequences, which do not have universal mechanisms of formation and differ according to a territorial basis, remains relevant. The reason of differences is not only about socio-economic parameters of countries, which determine the potential to overcome the consequences of demographic ageing, but also about the lack of a common understanding of the “old age” and the correlation between the demographic basis of its construction and the social perception of this category. Population ageing and ageing society are manifestations of the age structure transformation, which have common reasons of emergence, but they are conceptually different in defining the age of the “old age”. Thus, the purpose of this work is to identify and systematize the evolutionary features of demographic and social construction of the age of the “old age”. The article consists of two main parts: the analysis of existing approaches to constructing the age of the population’s demographic “old age” and features of the transformation of public perception of elderly population in different historical epochs (social construction of the studied category). The main conclusion of the study is that within global, irreversible (with a narrowed reproduction) ageing of the population and demographic beta-convergence, the construction of the age of the “old age” gradually moves into the social area. Societies restructure the concept of the old age not only through the prism of increasing life expectancy (including healthy), but also through awareness of the increasing role of the older generation in maintaining sustainable rates of the socio-economic development. On this background, the main task of “ageing” states is to overcome the persistent (albeit on a less significant scale) manifestations of age discrimination against older citizens.
Age of “old age”, population ageing, older generation, social construction
Short address: https://sciup.org/147225440
IDR: 147225440 | UDC: 314.9:316.4 | DOI: 10.15838/esc.2020.1.67.2
Text of the scientific article The evolution of demographic and social construction of the age of "old age"
Global population ageing is one of the main trends of modern times. Increase of the share and the number of senior population significantly impacts socio-economic development of “ageing” states. Considering the inevitability of demographic ageing within narrowed reproduction of the population, it is important to note that one of the main instruments of overcoming its consequences is the efficient implementation of the resource potential of senior population. However, our earlier research on the spread of age discrimination against older people (according to sociological data, in more than 50 countries) allowed concluding that the prevalence of such discriminatory practices takes place in many regions of the planet [1]. Stereotyping of older population, which is one of the main factors of inclusion of this socio-demographic group, has a basis in the form of a social construct of the age of “old age”, parameters of which were studied by representatives of various scientific fields, but, due to the versatility of the research object, the information about it is not systematized in a single approach. In this case, the stumbling block is the subjective component of the “old age” phenomenon, which is reflected in three projections: population (a set of representatives of Homo Sapiens species with accompanying demographic characteristics), social (a set of society’s representatives with their characteristic values and norms), and individual (psychological self-perception of certain individuals). Thus, the age of “old age” is defined as a complex versatile construct, the perception of which is highly likely to be subjective (on the level of individual territories, communities, individuals). Despite the complexity of the studied object, the global nature of demographic ageing and its consequences actualize the conducting of studies which are aimed at the generalization of interrelations between two different, but closely overlapping phenomena: population ageing and society ageing. The relevance of the study is also confirmed by the need to change the existing socio-cultural “old age” paradigm. This need is caused by new demographic conditions, where the role of older people will be much more important than in previous eras.
The purpose of this work is the identification and systematization of evolutionary features of demographic and social construction of the age of “old age”. The article consists of two main parts: a critical analysis of methodological problems of determining the population’s
“old age” and a brief summary of the transformation of its social perception within demographic changes. The informational basis of the research is the results of scientific studies on historical demography, anthropology, archaeology, ethnography, sociology, social gerontology, physiology, and statistical data on the population’s age structure.
Methodological problems of determining age criteria for demographic old age of the population
One of the main issues of the study of problems, related to the population ageing, is the determination of age boundaries for “old age”. It is obvious that ideas on this problem may significantly differ due to its conditional nature. The concepts which define three types of human age – biological, social, psychological – and create a single “triad” in the construction of the periodization of a person’s life are the most generally accepted concepts in the scientific literature. However, it should be noted that, while studying the evolution of public perception of senior people in the context of population ageing, there is a need to use another measure of “old age” – demographic. In the 21st century, the process of demographic ageing has become global: in all regions of the world, there is an increase of the share and number of older population. However, despite the universal trend, we can still observe and record differences in the course of this process on certain territories, manifested in different intensity of the increase of the share of older people among population [2]. The existing differentiation does not contradict the basic postulates of the theory of demographic transition, and it is largely a reflection of differences in the completion of its phases. Without denying the fact that there are common trends, we should also pay attention to the fact that the variety of demographic development models in the world today is even greater than, for example, in the middle of the 20th century.
It has intensified the scientific debate about the patterns and features of regional demographic development [3; 4]. If we narrow down the subject of the discussion to the phenomenon of population ageing, then a question arises: how much do existing approaches to measuring and comparing the levels of demographic old age correspond to modern realities?
Before proceeding directly to the subject of our study, we need to draw terminological boundaries between the concepts of “demographic old age” and “demographic ageing”, which are often used as synonyms. “Old age” is a static concept, and “ageing” is a dynamic one. Studies, based on the comparison of separate territories (countries, regions), are aimed at assessing “young age” or “old age” according to selected classification criteria. The characteristic of “ageing” is given according to the analysis of changes of the population structure on territories (countries, regions) in different periods. At the same time, the measure of “old age” is determined by some conditional age limit. There are many age classifications, and each of them highlights different periods and boundaries of stages of human life, including old age ( Tab. 1 ).
Approaches, given in the table, are only a small part of all approaches toward the classification of a person’s life. We have used the most known classifications, the analysis of the evolution of which allows us to draw an important conclusion: despite the increase of population’s life expectancy, the age of old age, throughout the history of mankind, was determined somewhere around 60 years.
Discoveries of Ch. Darwin and A.R. Wallace became catalysts for the development of many areas of anthropology in the late 19th–the early 20th century, including the periodization of a person’s age, and the limits of a life’s duration. Physiologists and anthropologists (for example, M. Rubner, P. Flourens, L. Aschoff, and I.
Table 1. Boundaries of the age of “old age” in different classifications
|
Classification |
Boundaries of the age of “old age” |
Beginning of old age |
|
Ancient Chinese classification (BC) |
50–60 years – the last period of creative life 60–70 years – desired age After 70 years – old age |
60 years |
|
Pythagoras’ classification (BC) |
60–80 years – old and fading man |
60 years |
|
Hippocrates’ classification (BC) |
56–63 years – the ninth period 63–70 – the tenth period |
Не определено |
|
Classification of French physiologists (beginning of the 19th century) |
After 55–60 years – the period of old age |
55-60 years |
|
Flourens’ classification (mid-19th century) |
70–85 years – first period of old age After 85 years – second period of old age |
70 years |
|
Rubner’s classification (end of the 19th century) |
50-70 years – old age After 70 years – venerable old age |
50 years |
|
Aschoff’s classification (early 20th century) |
45–65 years – the beginning of old age 65–85 years – senile age After 85 years – venerable old age |
45 years |
|
Classification of English physiologists (early 20th century) |
After 50 years – the period of old age |
50 years |
|
Classification of German physiologists (early 20th century) |
After 60 years – the period of old age |
60 years |
|
Frankel’s classification (mid-20th century) |
After 60 years – the period of old age |
60 years |
|
The Great Soviet Encyclopedia (1960) |
65–75 years – beginning of old age |
65 years |
|
All-union Congress in Gerontology (1963) |
60–74 years – old age 75-90 years – senile age 91 and older – long-livers |
60 years |
|
WHO classification (second half of the 20th century) |
51–60 years – ageing man; 61–75 years – elderly person; 76–90 years – old man; 90–100 years – very old man; After 101 years – man in deep old age |
50 years |
|
Peter Laslett’s concept of the “third” age (second half of the 20th century) |
60–65 years – The Young Old 65 years and older – The Old Old |
60 years |
|
WHO classification (21st century) |
60–75 years – old age; 75–90 years – senile age; After 90 years – long-livers. |
60 years |
|
Source: own compilation. |
||
Schwidetzky), based on the results of their research, tried to determine the natural limit of a human life (age periodization was carried out on the basis of it), while statisticians and demographers focused on calculating population’s modal (“normal”) life expectancy (Lexis, Meiner, and Freudenberg’s methods). Different scientists set different tasks and used different methodological tools. Moreover, in the first case, the subject of the study was an individual, and in the second – the population as a whole.
The question, related to the process of the population’s age structure transformation, has been studied quite widely. The theoretical and methodological basis was formed during the 20th and 21st centuries. One of the first researchers to propose a classification of types of age structure was the Swedish demographer A. G. Sundberg (1894). He introduced into scientific use the concept of progressive, stationary, and regressive types of age structure. With a progressive age structure – the population grows, with a stationary one – its number does not change, and with a regressive one – the number decreases. The difference is in the proportion of children, aged 0–14, and “old people”, aged 50 and above. In Sundberg’s progressive age structure, the proportion of children is 40%, and the proportion of old people is 10%, in the stationary age structure – 27% and 23%, respectively, and in the regressive age structure – 20% and 30%. Due to the fact that the regressive type of age structure practically did not appear in Sundberg’s times (with the exception of some France’s provinces), he formulated so-called “Law of the age structure equilibrium”, the main postulate of which is that the share of able-bodied population (15–49 years) remains unchanged within 49–50% range1. However, if we apply this age classification, for example, to the population of modern France, we can state that the range of values of the share of population, aged from 15 to 49, in 1950–2015 varied from 44 to 50.5%2. In practice, Sundberg’s law is not confirmed, but his approach became the basis for the study of age profiles in demography.
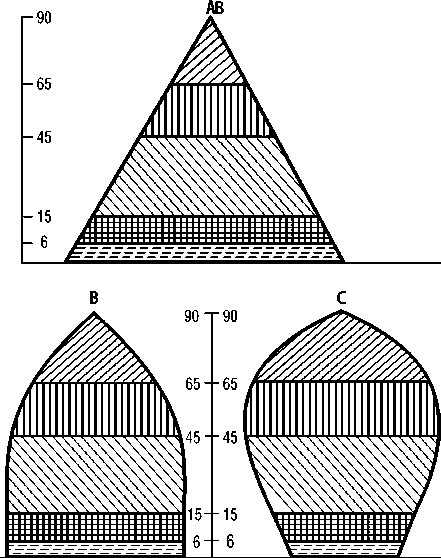
In the 1930s, the German statistician F. Burgderfer developed the concept of types of population’s age structures, formulated by Sundberg [5]. The progressive age structure (young population) corresponds to the correct pyramid. A diagram, depicting a stationary structure, resembles a “bell”. The regressive age structure corresponds to a figure called the “urn” ( Fig. 1 ).
However, if the regressive type was considered a theoretically possible in times of F. Burgderfer, then, according to 2015 data, the entire spectrum of selected types of age structures is reflected in practice ( Fig. 2 ).
Burgderfer and his compatriot V. Mayer believed that the thesis about the interconnection between demographic ageing and depopulation is erroneous, and it is not confirmed empirically. Their opinion was quite reasonable, given the fact that, in the first half
Figure 1. Types of age structures (according to F. Burgderfer): A – young (growing) population; B – aged (stationary) population; C – very old (decreasing) population
Г 90
-65
-45
B
C
90 т 90
65--65
45--45
15--15 6-- 6
-15
- 6
Source: Medkov V.M. Demografiya: ucheb. posobie dlya vuzov. R/nD: Feniks, 2002. 448 p.
of the 20th century, the process of the increase of the share and number of older people happened simultaneously with the growth of the entire population. However, the current situation shows the opposite. In particular, over the past ten years (2005–2015), the population of Japan (the country with the highest share of old people above 60 years old) decreased by 1%, and, according to the average version of the UN forecast, it will have decreased by almost 20% by 20503.
It should be noted that, until the middle of the 20th century, the phenomenon of population ageing received very little
Figure 2. Age structures of the population in some countries of the world in 2015: A – Niger; B – Colombia; C – Japan
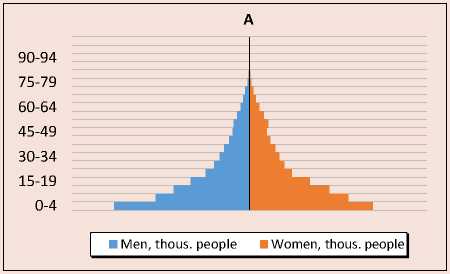
Source: own compilation according to data of World Population Prospects: the 2015 revision. Available at: http://esa. attention from the scientific community, since the share and number of older people had not shown significant growth rates for a long time. At the same time, within the actively developing theory of demographic transition, some forecasts and assumptions about the potential growth of the problem in the near future were made [6]. In the 50s and the 60s, the problem of population ageing became clear. It stimulated the research, purpose and objectives of which were the definition of fundamental methodological principles of evaluating demographic ageing territories. During this period of time, a number of theoretical and practical works were published, the totality of which could be called a classic stage in the development of ideas about the phenomenon of population ageing: the UN Report “The
Ageing of Populations and its Economic and Social Implications” (1956), E. Rosset’s fundamental works (1959), J. Beaujeu-Garnier (1965), A. Sauvy (1966), etc. UN experts were among the first researchers who attempted to classify countries by the level of demographic “old age”, and the main criterion was determined by the share of the population above 65 years old. Three levels, characterizing the population’s age structure, were proposed [7]:
-
1) with 4% of people over 65 years old – the young population;
-
2) 4–7% – mature population;
-
3) more than 7% – old population.
Let us emphasize that this classification is currently used by many experts for analyzing trends in the process of demographic ageing. However, in the late 50s, it was fairly
Table 2. Beaujeu-Garnier–Rosset’s scale of demographic old age
|
Stage |
Share of people, aged 60 and above, % |
Stage of ageing and the level of population’s old age |
|
1 |
<8 |
Demographic youth |
|
2 |
8–10 |
The first threshold of old age |
|
3 |
10–12 |
Actual threshold of old age |
|
4 |
12 and above |
Demographic old age |
|
12–14 |
Initial level of demographic old age |
|
|
14–16 |
Average level of demographic old age |
|
|
16–18 |
High level of demographic old age |
|
|
18 and above |
Very high level of demographic old age |
criticized by some scientists: in particular, by the Polish demographer E. Rosset. He considered the UN classification too narrow, which did not reflect the entire global scale of the population ageing phenomenon [5]. After carrying out a conceptual analysis of existing approaches to determining the age of old age, Rosset formed his own scale of demographic old age, which included four levels. As a classification criterion, he used the age of 60 years and older. Later, when he came to a consensus with the French scientist J. Beaujeu-Garnier (initially E. Rosset criticized her approach to highlighting the boundaries of demographic old age), the scale was expanded ( Tab. 2 ).
Thus, the Sundberg’s concept acquired a slightly different format: the progressive, stationary, and regressive population was replaced by the young, mature, and old population. In this case, it is rather a question of terminology, since the diversity of types of age structures has not been questioned. However, the main methodological difference between new approaches was the departure from two criteria in the measurement of the demographic old age (previously, the share of children and the share of old people were used for characterizing the type of the population’s age structure). The level of old age of the population was measured using only the indicator of the share of the population above 60/65 years old. According to scientists themselves, it allowed introducing stricter methodological boundaries in the study of demographic ageing [5].
Later, Alfred Sauvy in his book “Theorie generale de la population: La vie des populations” (1966) presented some kind of a resume in relation to approaches toward the study of the demographic ageing process. At the same time, the French scientist did not focus on defining the boundaries of old age. The center of his attention was the practical result of assessing possible consequences of population ageing and indicators that allow their measurement and forecast [8]. In the classic projection of assessing the effects of the studied phenomenon, such indicators included the average age of the population, the number of old people per 1000 able-bodied population (most often – from 14 to 59/64 years old), the old age index (the number of elderly people per 100 children, aged 0–14). The important methodological point is the shift of the two-criteria principle from measuring the level of population’s old age to measuring the consequences of this phenomenon.
In later periods, a number of scientists [9– 12] repeatedly attempted to create new typologies and classifications for measuring levels of demo-graphic old age and consequences of population ageing, which, however, were based on previously established classic principles. In the 21st century, when the phenomenon of population ageing became global, the main question, which started the scientific discussion on the definition of “old age” in the 50s and 60s, has become even more relevant: how do established methodological boundaries correspond to modern realities? For clarity, let us compare the distribution of countries in the UN and Beaujeu-Garnier– Rosset’s classifications in 1950 and 2015 (Tab. 3 and 4).
The data show that the share of countries, which could be called demographically old, became several times higher in 1950–2015: from 23.5% to 44% according to the UN methodology, and from 12% to 39% according to the Beaujeu-Garnier–Rosset’s scale. This trend once again confirms the fact of the sufficient intensity of the process of global demographic ageing. However, the presence of countries in the “buffer” zone between “young” and “old” territories has significantly decreased. In fact, in the 50s, three conventional levels of old age were distributed in the descending order from “young” to “old”. However, at the moment, both classifications allow speaking about the existence of two poles: the first one includes primarily “young” territories, and the second one – “old” territories. There is a contradiction: on the one hand, it is difficult to deny the global nature of demographic ageing, and, on the other hand, these data do not indicate the decrease of differentiation between countries, but the distance between two opposite groups.
Thus, the departure from two-criteria (which should have created a stricter methodological framework and reduced the impact on the final indicator of the share and the number of children) did not justify itself. In both classifications, there was a narrowing of the “buffer” zone between “young” and “old” countries due to increasing differentiation between them in terms of fertility. The “bottom-up ageing” format, which happens due to the reduction of the birth rate and, consequently, the proportion of children in the population, has severely deformed the structure of the world’s countries in terms of demographic old age. Comparison of territories with each other
Table 3. Distribution of countries by demographic old age in 1950 and 2015 (UN classification), %
Level of old age Share of countries, % 1950 2015 Young population (share of people, aged 65 and above, is less than 4%) 47.5 31.5 Mature population (share of people, aged 65 and above, is from 4 to 7%) 29 24.5 Mature population (share of people, aged 65 and above, exceeds 7%) 23.5 44 Source: own compilation according to data of World Population Prospects: the 2015 revision. Available at:
Table 4. Distribution of countries by demographic old age in 1950 and 2015 (Beaujeu-Garnier–Rosset’s classification), %
|
Stage |
Share of people, aged 60 and above, % |
Distribution of countries, % |
|
|
1950 |
2015 |
||
|
1 |
Demographic youth (<8) |
66 |
43.5 |
|
2 |
The first threshold of old age (8–10) |
9.5 |
10 |
|
3 |
Actual threshold of old age (10–12) |
12 |
7.5 |
|
4 |
Demographic old age (12 and above) |
12 |
39 |
|
Initial level of demographic old age (12–14) |
6 |
4.5 |
|
|
Average level of demographic old age (14–16) |
5.5 |
5 |
|
|
High level of demographic old age (16–18) |
1 |
2 |
|
|
Very high level of demographic old age (18 and above) |
0 |
27.5 |
|
Source: own compilation according to data of World Population Prospects: the 2015 revision. Available at:
has become much more complicated. This difficulty has made it more relevant to search for other criteria of demographic old age, less dependent on birth rates.
In 1975, Norman Ryder proposed a new measure of the population’s old age: it reflects not the number of years passed since birth, but the number of years of living in older ages [13]. As a criterion for measuring the level of demographic old age, he chose the indicator of the population share with a life expectancy of less than 10 years. This methodological principle was later used as the basis for the concept of prospective age, actively developed by W. Sanderson and S. Shcherbov [14–17]. Their proposed criterion for determining the level of old age of the population is the share of population with a life expectancy of 15 years or less. Researchers set the task of determining the objective boundaries of old age from the perspective of the “ageing from above” model on the basis of the indisputable fact that a conditionally modern 70-year-old individual has fundamentally different biological and social characteristics than his peers a few decades ago did. The main difference between this approach and the traditional one is a seemingly paradoxical statement: the increase of life expectancy at older ages leads to the rejuvenation of the population, not the ageing. In many developed countries, where the demographic transition began much earlier, the median population’s age, calculated using the prospective method, tended to decrease since the middle of the 20th century, while the indicator in the traditional projection continued to grow [18]. As a confirmation, let us overview the indicators of demographic old age, calculated using different methods for the population of Russia, Sweden, and Denmark (Tab. 5).
The data show diverged nature of demographic ageing in classic and prospective projections: the share of population above 60 and 65 years old grows, whereas the share of the population with a LE of 15 years and less reduces. Moreover, Denmark, which is at the top of a rating in terms of demographic old age in traditional measurement, has a smaller share of older people than Russia, based on calculations of the prospective indicator. It is also obvious that countries are less differentiated by the level of demographic old age.
An important point is also the fact that the shift in the boundaries of old age in the prospective concept generally corresponds to the trends of the social age shifting, which has more formal boundaries (for example, the
Table 5. Share of older population of some countries in different classifications (1990–2015)
|
Country |
Year |
Share of population above 60 years, % |
Share of population above 65 years, % |
Share of population with LE from 15 years and less, % |
|
Russia |
1990 |
15.9 |
10 |
11.4 |
|
2015 |
19.8 |
13.2 |
11.1 |
|
|
+/- |
+3.9 |
+3.2 |
-0.3 |
|
|
Sweden |
1990 |
22.7 |
17.8 |
14 |
|
2015 |
25.2 |
19.6 |
11.6 |
|
|
+/- |
+2.5 |
+1.8 |
-2.4 |
|
|
Denmark |
1990 |
20.3 |
15.6 |
13.6 |
|
2015 |
24.7 |
19 |
10.7 |
|
|
+/- |
+4.4 |
+3.4 |
-2.9 |
Source: own compilation according to data of Federal State Statistics Service of the Russian Federation. Available at: ; official website of statistics in Sweden. Available at: ; official website of statistics in Denmark. Available at:
retirement age). Consequently, increased life expectancy at older ages expands the definition of productive population, which may be a reason for the retirement age increase. However, there is one flaw: the concept of prospective ageing does not take into account the growth rate of healthy life expectancy (HLE) and other characteristics that reflect, for example, the institutional features of the population’s employment in older ages. In the classic measurement of demographic old age, these elements are also not provided, while the setting of the age of old age at the level of 60/65 years allows bringing closer the ratio of biological and social (in this case, we mean the retirement age) ages from an applied point of view. Let us overview the Russia as the example.
If we rely on calculations in the projection of prospective ageing, age limits in the country would be 62 years for men and 69 years for women in 2015. At the same time, determined retirement age limits were 60 years for men and 55 years for women then. Therefore, if we calculate the demographic workload in the projection of prospective ageing, millions of men, aged 60–62, and women, aged 55–69, will formally belong to the productive part of the population, although the vast majority of them have already retired. The example of Russia may not be the most significant, but we should note that the prospective age of old age in Sweden and Denmark, which had been already overviewed, also significantly exceeds the standard retirement age (by 4 and 5 years, respectively).
Let us go back to the HLE indicator in three overviewed countries. Dynamics of this indicator is probably one of the most significant critical arguments against the concept of prospective ageing. Thus, between 1990 and 2015, the age of “old age” in Russia, Denmark, and Sweden increased by 2; 4.5 and 3.5 years, respectively, while the HLE indicator of the population, aged 65, increased by 1 year in the Russian Federation and by 2 years in the Scandinavian countries. Objectively, the situation in all countries, without exceptions, develops in such a way that the growth rate of the HLE indicator is significantly slower than the growth of average life expectancy. The question appears: how objective are the boundaries of age in the concept of prospective ageing? We believe that the usage of the criterion of the share of the population with LE of 15 years and less in the measurement of demographic ageing slightly distorts the idea of old age, because it ignores the real achievements in extending healthy life in older ages.
The analysis allows us to conclude that existing approaches to measuring the level of demographic old age have a number of shortcomings. Thus, the measurement with traditional methods, which apply indicators of the share of population older than 60/65 years, is somewhat outdated, while the measurement with the prospective method, in our opinion, might overestimate real boundaries of population’s old age. Also, the issue of the representativeness of the comparison of demographic old age levels in certain regions of the world remains unresolved.
If we overview population ageing as a dynamic process, then the transformation of age structure reflects the movement of population from one phase of demographic transition to another. However, if we overview demographic old age in static, it is a set of completely different types of age structures, which are difficult to compare with each other due to the different influence of individual factors on its change. Thus, in fact, the need for the global measurement of demographic old age loses its relevance from the point of view of traditional methods and the prospective ageing concept.
It worth mentioning that we do not pursue the aim of a complete denial of existing methods of the demographic old age measuring. The problem lies solely in the methodological validity of applying common criteria of its “age” to countries at different stages of demographic transition. The main drawback of these methods is that the determination of the population ageing extent through the prism of the age of demographic old age (in fact, the population level) does not answer the important question: how does society grow old? Countries with similar indicators of demographic old age may differ significantly in socio-demographic characteristics of older generation. Demographic construction of the age of “old age” is based on the usage of methods which allow assessing the factors and consequences of increasing the share and number of older people in the population, but they do not allow determining the parameters of changes of the older people’s position in the social structure. In this regard, the study of the evolution of the “old age” social construction (a process that occurs simultaneously with demographic changes) is a necessary condition for a complete understanding of the nature of the “silent revolution”.
Main milestones of the evolution of the public perception of old age: from geronticide to a society “for all ages”
In all discussions on consequences of demographic ageing, the attention is usually focused on the economic component (the deficit of pension systems, the reduction of supply on labor market, etc.). At the same time, the transformation of the population’s age structure leads to the change of social space where the older generation becomes more and more important. It poses the question: what will happen after these changes, and is society ready for it? The answer to this question lies in the public perception of the inevitable change of the socio-cultural paradigm of “old age”, where the resource potential of older generation is considered to be one of the main factors of sustainable socio-economic development. It is important to understand that the process of social “restructuring” of old age began in ancient times, when the population’s age structure, the place and the role of an old person were completely different. The attitude toward older people and demographic transformations has an evolutionary nature, which implies the presence of certain factors that influence its change. In this part of the paper, we attempted to build a chronological sequence of changes of the public perception of older generation on the context of changes of the population’s age structure. The study was conducted by a step-by-step review of five historical epochs (primitive society, ancient era, Middle Ages, modern and contemporary history). The overview of the demography of old population and the social status of this socio-demographic group was given for each period.
Primitive society. E. Rosset in his fundamental work “Proces starzenia sie ludnosci” called ancient society “the society without old people” [5; 19]. It is worth mentioning that his statement is confirmed by the data of archaeological excavations – the only source of information about the population of that time. In the middle of the 20th century, the French researcher Henri Valois publically presented the data on the study of 186 human remains from the late Paleolithic (40–13 thousand years BC) and Mesolithic (13– 4 thousand years BC) eras, according to which, on average, only 2–2.5% of the population lived to the age of 50–60 years [20]. An outstanding domestic demographer B. Ts. Urlanis in his work [21] refers to the data on excavations in North America, where only four out of 1132 found skeletons of a pre-agricultural tribe were 55 years old or older.
Hungarian scientists Acsádi J. and Y. Nemeskeri calculated the survival coefficient for the Paleolithic population aged 40–44 years: it was 0.01. In general, the peaks of mortality were observed in the ages from 0 to 5 and from 20 to 30 years old [22]. According to B. Ts. Urlanis [21], the main cause of adult mortality in ancient times was violent death (death in skirmishes with animals, ritual killings, battle for prey, etc.).
If we speak about older people, then, according to E. Rosset [19] and L. Krzywicki [23], in primitive society, the deliberate killing of old persons was common. The reason, most likely, was the limited resources for living and the decline of their bodies’ physiological properties, which led to the loss of ability to perform useful functions for the community. A middle aged person was an important part of the social structure, because he had an experience and skills to gather useful resources, but when a person became old, all these skills got devaluated. At the same time, L. Krzywicki, on the basis of studies on the age structure of the remains and behavioral characteristics of the tribes of New Zealand and New Guinea, put forward a hypothesis that this situation significantly improved, when ancient people learned how to make a fire [23]. If we turn to a well-known classification of L. Morgan [24], we can assume that the social significance of older generation has changed fundamentally with the transition of mankind to the middle stage of savagery. In tribes, old men, along with women, were given an important function – the keeping of fire. In fact, it could be called the first of the most significant stages of the evolution of attitudes toward older people, characterized by the awareness of the usefulness of functions, performed by older generation.
Ancient era. The early historical era provides much more information about the age structure, place, and role of older people in society. J.
Angel in his work [25] compared archaeological data on Greeks’ remains, which belonged to times between the Neolithic period and the Roman Empire. According to it, average mortality age increased by almost 7 years during this period (31.8 and 38.5 years, respectively). For comparison, Ya. Shiladi, who conducted a study of tombstones in 48 cities and districts of the Roman Empire, determined that the average age of the dead in the ancient era was 32.2 years [19]. C. Pearson, who studied tablets attached to mummies in Ancient Egypt [26], and W. Macdonel, who studied tombstones in the Western part of the Roman Empire from the first century BC to the first century AD [27], estimated the average population’s life length in the ancient world at 22 years. American researchers L. Dublin, A. Lotka, and M. Spiegelman assumed that this number was between 20 and 30 years [28]. The difference of these estimates could be explained by differences of methods applied.
However, what is important for us is not the order of numbers, but the fact that the population’s life expectancy, in comparison with prehistoric times, increased in this era. J. Angel called the improvement of sanitary conditions and the elimination of certain types of external causes of death main reasons of such changes [25]. Of course, the increase of life expectancy and its quality had a positive impact on society’s attitude to older generations.
The collapse of tribal relations significantly changed the position of older people in the structure of society. It is safe to say that the social structure of ancient states was based on family and clan principles. The famous ancient Greek historian and geographer Strabo noted that “... the most famous, oldest, and experienced people are trusted” [29]. The highest authorities in Ancient Greece (“Gerousia”) and the Roman Empire (“Senate”) were councils of elders. The etymology of these words shows that they are derived from the word “old man” [30]. In our times, the system of state administration of ancient states was called “gerontocracy”, i.e. “the power of old”.
At the same time, in the literature of ancient world, there was the information which could be used for assessing the public perception of older people and their way of living. The Roman philosopher Cicero was one of the first to present a philosophical understanding of old age in the dialogue “Cato the Elder on Old Age”, written by him in 44 BC [31]. In this work, he identified four main reasons that form a negative image of older people. His thoughts remain relevant in the XXI century:
-
– old age hinders activity;
-
– old age weakens a body;
-
– old age deprives all pleasures;
-
– old age brings us closer to death.
Cicero does not deny the existence of these phenomena, but pays great attention to the philosophical attitude of an individual to older age. In his opinion, foresight, accumulated experience, and persistent character make old age the most useful age for a wise person. Cicero gives many examples of active political and military activity of his elderly contemporaries, thus refuting the statement that age hinders social activity. Common sense, memory training, and reflection compensate for fading physical strength, and the rashness of youth is replaced by foresight. As for the last reason mentioned by the philosopher, in his opinion, every person is at the same distance from death.
Later, Cicero’s reflections on old age were supported by his compatriot Lucius Annaeus Seneca. In the 12th chapter of “Moral Letters to Lucilius” [32], he calls for considering old age an unavoidable part of a person’s life path, filled with its own advantages that are natural for this age. Following Cicero, Seneca writes that “all pleasures ... replace the lack of need for them”, but, at the same time, old age “...is full of pleasures, if you know how to use them”.
It is important to note that historical sources indicate the preservation of the ancient tradition of killing the elderly in the ancient era. Strabo gives several examples that date back to the 4th century BC [29]. On the Island of Keos (Polis Yulida), there was a custom that ordered all old people over 60 years to drink hemlock (poisonous extract). This was justified by the lack of food, and the “law” itself sounded like this: “The one who does not live well, should not live bad”. In the Sogdian and Bactrian tribes (the modern territory of Uzbekistan and Tajikistan), old people were fed alive to dogs, but this custom, according to Strabo, was eliminated by Alexander the Great. In the Scythian-Sarmatian tribes of the Aral-Caspian region, there was a practice of eating older men over 70 years of age and their starvation. M.I. Kulisher, referring to the protestant pastor and ethnographer Matthaus Pratorius [33], notes that gerontocide (“killing of old people”) was practiced by Prussian Lithuanians and ancient Prussians.
Thus, despite some old people’s social status changes, the problem of geronticide in the ancient world remained relevant. Due to the lack of available information, we cannot define the scale of this phenomenon, but the fact of its existence is difficult to deny. Moreover, given examples show that the practice of killing older people was not attached to a particular culture. As before, in each case, a single direct or indirect cause can be seen: the lack of resources. Therefore, we can assume that gerontocide was one of the first and most radical manifestations of age discrimination, which primarily applied to older people, whose physical and moral condition, according to their contemporaries, did not allow them to be classified as a
“useful”, productive part of society.
The Middle Ages. This period of human history provides scientists with an extremely small number of materials on population statistics and historical demography. One of the most significant works on medieval demography belongs to J. Russel [34]. The scientist calculated 11 mortality tables for the population of England for the period from 1276 to 1450, according to which the average life expectancy at birth was about 26–28 years in this era. It is worth mentioning that the value of the indicator varied greatly (from 17 to 35 years), which was caused by the plague epidemic, which reached its peak in the second half of the 14th century. This factor became the main barrier to the growth of life expectancy in the medieval era. One of the confirmations of the hypothesis on the decrease of the average life expectancy in reviewed historical periods is the study of V. Valaoras: according to his data, the value of the indicator for the population of Greece in the era of antiquity and in the Middle Ages was the same – 22 years [35].
The most detailed information about the age structure of the population in the Middle Ages is presented in the work of J. Acsadi and Y. Nemeskeri [22]. According to their research, conducted in Yugoslavia (10–11th centuries), Sweden, and Germany (12–14th centuries) in the studied period in Europe, averagely 6% of the population lived to the age of 60 years. E. Rosset in his research [5; 19] refers to the work of Pope Innocent III (1161–1216) “On the predictable world and human poverty”, who characterized the demographic situation of his era with the following words: “Few people lived to forty years, and sixty-year-olds were rare cases”. On the basis of this information, we can assume that, in the Middle Ages, the evolution of life expectancy and, consequently, the growth of the number of elderly people slowed down, which happened primarily due to the large number of wars, unsatisfactory sanitary and economic conditions.
Let us now discuss the public perception of older people in the studied historical period. Famous historian and sociologist Ph. Aries provides important information about the image of the older generation in the eyes of medieval society [36]. The iconographic tradition of France in the 14–18th centuries shows that each specific age was assigned a certain social function. In case of an elderly person (the house-sitting age), it was an untidy, old-fashioned, bearded scientist (or a representative of a different cohort related to mental work). Thus, in the Middle Ages, knowledge and related functions were associated with old age. This fact allows us to assume that representatives of the older generation get a specific niche in the social structure. At the same time, Ph. Aries notes that, in medieval France, older people did not enjoy public respect [36]. Old age was defined as the age of renunciation, the age of reading books and praying. In the 16–17th centuries, the image of a full-fledged man was formed: it was a young military man in an officer’s belt at the top of a social pyramid. Without doubt, the example of France does not make it possible to extrapolate the results to all regions of the world, but, in our opinion, this information allows us to indirectly characterize the situation in the countries of continental Europe: they have historically been the “vanguard” of social transformations.
The cases of geronticide, which were typical for that time, need to be mentioned too. One of the most important historical facts is the Commission of Pope Alexander IV, dated the 13th century, according to which the famous medieval theologian Saint Albert the Great had to go to Poland to eliminate the barbaric custom of killing old people, which existed there [33]. A. A. Kotlyarevskii thoroughly reviewed the Wends’ (collective designation of Slavic tribes that inhabited Europe) traditions of killing elderly people. The author gives an example that dates back to 1220, when the elder Levin von Schuleberg forcibly took an old man, who was sentenced to death, from a group of Wends. After this incident, the rescued old man lived for about 20 years [37]. The last mention of this Wends’ custom is from the 17th century. The Church Minister Hildebrand wrote: “In former times, children killed their decrepit parents, who were unable to earn money, saying that God is not pleased with people who do not work” [33]. In our opinion, this quote is another confirmation of the fact that, in a relatively stable demographic situation, the economic context largely deter-mined the attitude toward older people in ancient and medieval times. However, it should also be noted that this custom was questioned and regarded as an inhumane relic of the past in relatively developed countries.
Modern Age. This historical era is associated with the birth of the demography science. The first two known mortality tables were constructed in the second half of the 17th century: J. Graunt’s table was for the population of London (the 1660s) and E. Halley’s table was for the population of Wroclaw (1687–1691). However, estimates of average life expectancy varied significantly: the number was around 18 years in the first case [38] and 30 years in the second one [39]. According to E. Halley’s calculations, 24.2% of the population lived to the age of 60 (in the Middle Ages, this number was around 6%). In France, The Netherlands, and Sweden of the 18th century, the share of those who lived to 60 years increased to 30% [5]. In the 19th century, the share of those who could live to old age ranged from 35 to 46% in developed countries, while the number was about 25% in the European part of Russia: according to E. Halley’s calculations, it was similar to the indicators of Poland of the 17th century. S.A. Novosel’skii in his work “Mortality and life expectancy in Russia” (1916) characterized the age structure of the Russian Empire as “typical for agricultural countries which are underdeveloped in sanitary, cultural, and economic terms” [40]. At the turn of the 19th and 20th centuries, about 29% of the inhabitants of the European part of Russia lived to 60 years, while this number exceeded 50% in Sweden and Denmark [41]. The revealed differentiation is important for comparing the demographic development of countries, but the most important thing needs to be mentioned: in all reviewed countries, there was the decrease of mortality (to varying degrees) in all ages, including older ages. At the beginning of the 20th century, in several European countries, the share of the population, aged over 60 years, exceeded 10% (France, Sweden, Ireland). As for the change of average life expectancy, it is estimated4 that it averagely increased by almost 10 years in developed countries between 1840 and 1900 (from 41 to 50.5, respectively).
The public perception of older people has also been changing. The image of a respected elder gradually changed to “a man of age” and “a well preserved woman or a man” in developed countries [36]. In this regard, the change of the perception of the age of old age becomes decisive, which is some kind of a social phenomenon. Social phenomena are structures created by man in the course of historical development [42]. The construction of old age in Modern Age takes place in the context of the awareness of demographic (increase of life expectancy and transformation of the age structure), economic (industrial revolution), and cultural changes.
Despite significant changes in the perception of the older population, references to gerontocide are found even in the 19th century. Thus, the famous traveler D.N. Bukharov described the custom of Lapp (Sami) nomads: a sick or elderly person was left to his fate, if he could not continue the journey with the rest. They built a small hut for him, left some water and provisions, and then left him [43]. An article by P. Litvinova in the journal “Kievskaya starina” (1885), called “How old people were put on the lubok in the old days”, is of particular interest [44]. The author gives data from interviews with residents of one of the villages of Little Russia, confirming the fact of elderly people murders. The story of a local resident directly traces the nature of the attitude toward elderly people in those days: an old person was significant and respected only if he had useful skills for his social group.
It is also important to mention that, at the end of the historical era, regular population censuses, which gave a more realistic idea about the age structure, began in several developed countries (for example, Sweden, England, Germany). In the second half of the 19th century, the first Chancellor of Germany Otto von Bismarck implemented the first model of the social service and insurance system (including pension), which marked the beginning of the “welfare states” era. One of the main reasons for these changes was the awareness of the fact that the older population grows in a number of European countries. It those years, the phenomenon, which became global and radically changed the society’s perception of the older generation and the “age of old age” by the 1920s, began – population ageing.
Contemporary Age. The contemporary era is associated with demographic transformations. In 1909, the French demographer A. Landry drew attention to the existence of certain patterns in the demographic development of Western countries and to the transition to a “new demographic regime” [45]. A significant event was the publication of his book “La Revolution Demographique” (1934 [46]), which gave the eponymous name to the change of birth and death trends in developed countries in the first half of the 20th century. The decrease of the number of births and the increase of life expectancy caused a significant transformation of the population’s age structure. Its main feature was an unprecedented increase of the share and the number of the elderly population (Tab. 6). According to 2015 data, the share of the population, aged over 60, is, averagely, 24% in developed countries (in the world – 12%).
Changes of the demographic situation led to a revision of state policy toward older citizens. The problem of population ageing required solution of two interrelated tasks: the maintenance of the economic growth and the provision of decent living conditions for the older generation. At the beginning of the 20th century, most of the developed countries of the world set a course for the introduction of national social programs. For a long time (more precisely, until the 70s–80s), the pension systems in developed countries were based on so-called principle of generational solidarity (“pay-as-you-go” model of the conditional-funded pension system) and functioned by redistributing funds between generations, or rather transferring part of incomes of working population in favor of disabled citizens. However, when the demographic dividend was exhausted, and many developed countries entered the third phase of the demographic transition, the pension load on able-bodied population began to significantly increase, which made the issue of the fairness of public finances redistribution relevant. The sociodemographic group of older people, previously considered to be only an unproductive part of
Table 6. Change of the share of older people in the total population of developed countries
|
Share of people aged 60 and above, % |
Country, year |
|||
|
France |
Sweden |
Great Britain |
Germany |
|
|
8 |
1788 |
1860 |
1910 |
1911 |
|
10 |
1850 |
1882 |
1925 |
1925 |
|
12 |
1870 |
1912 |
1931 |
1937 |
|
14 |
1931 |
1948 |
1938 |
1950 |
|
15 |
1939 |
1950 |
1940 |
1954 |
|
16 |
1947 |
1956 |
1952 |
1960 |
|
17 |
1961 |
1959 |
1961 |
1962 |
Source: Sauvy А. La vie des populations. Translation from French by F.R. Okuneva. Moscow: Progress, 1977. 520 p.
the population, is labelled as “burden” for the state and its budget. We need to point out that many countries responded to this challenge by switching to a funded pension system, which increases the individual responsibility of a citizen for pension savings.
Another important consequence of demographic ageing is the transformation of the labor market and the reduction of supply on it. In the second half of the 20th century, employers in developed and developing countries used a system that could be called “last in, first out” for older people [47]. It means that people, approaching retirement age, became the first candidates for dismissal and the last in the process of applying for a job. In the 70s, developed countries actively introduced the practice of early retirement, due to the employment crisis that arose in those years, and developed special programs for “exempt employment” (England) or pre-retirement payments (Germany) [47]. However, despite the context, this system is discriminatory by definition. It is economically justified only within the “demographic window”: if the ratio of the share of dependents and the share of working population tends to a minimum.
At the turn of the 20–21st centuries, the problem of supply surpluses on the labor market was replaced by its deficit in many developed countries. Due to the irreversibility of global demographic ageing, the problem of imple- menting the second demographic dividend [48] has become relevant. It was based on the resource potential of the older generation. In other words, on the stimulation of the employment of older people and the implementation of a policy of extending the period of labor activity of citizens after reaching retirement age. Global community responded by adopting normative documents that regulate the work of older people too: the Vienna International Plan of Action on Ageing (1982), Proclamation on Ageing (1992), and the Madrid International Plan of Action on Ageing (2002). States and employers are encouraged to create favorable conditions and to employ the “third age” population. The attitude to older people in society is built through the awareness of the need for effective implementation of their resource potential.
There is no place for gerontocide in the modern world, but the scornful attitude toward elderly people still exists in a different form, which is called “ageism” in science. The term was coined by the American scientist R. Butler [49], and it means age discrimination, similarly to Nazism and sexism. Butler reviewed it as a combination of three interrelated aspects, such as the negative stereotyping of older people, discriminatory manifestations in people’s interpersonal interaction, and discrimination on the institutional level (in particular, on labor market) [50].
It is possible to assume that age discrimination against older people is a factor which reduces their living quality. To confirm this hypothesis, we attempted to compare the results of the sixth wave of The World Values Survey’s sociological research 5 (a set of questions aimed at identifying age discrimination) with the data of the global rating of older people’s living quality (Global AgeWatch Index, 2015), calculated using the methodology of the international non-governmental organization HelpAge International. The calculations showed a strong positive correlation (r=0.71), i.e. the lower the level of discriminatory attitudes toward older people, the higher their living quality is. The elimination of ageism, which is as much of a social vestige as gerontocide, has become an integral part of the transition to a new sociocultural paradigm of “old age” and the policy of effective implementation of the older generation’s resource potential.
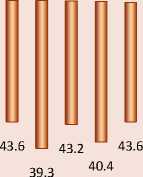
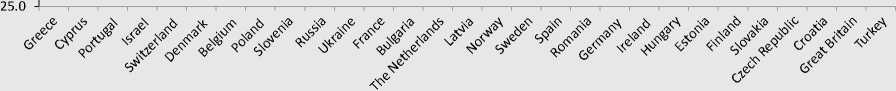
Sociological surveys are among the most important tools for obtaining information about limits of the age of “old age” from the position of a society itself. In 2008, participants of the European Sociological Survey (ESS) were asked to answer two questions: 1) “At what age does youth end?” and 2) “At what age does old age begin?”. Figure 3 shows data for some countries (the number at the bottom of the column is the end of youth, at the top – the beginning of old age).
According to the aforementioned data, we may conclude that these countries differ most significantly in terms of the end of the youth period (which affects the duration of “maturity”), while the age of “old age”, without considering extreme points, varies from 60 to 65 years. In general, it confirms the relevance of using similar criteria for determining demographic old age and approximate compliance with the retirement age, which is one of the formalized versions of the social
Figure 3. Distribution of answers to questions “At what age does youth end?” and “At what age does old age begin?”, 2008, years
70.0
65.0
60.0
55.0
50.0
45.0
40.0
35.0
30.0
. 66.7 65.6 65.5
65.3 64.3 64.3 64.0 63.9 63.5
63.1 63.1 63.0 62.9 62.8 62.5 62.2 62.1 61.9 61.9 61.9 61.4 61.4 61.1 61.0 60.4 60.1
51.7 51.5
42.9
41.0
43.8 44.3
46.8
43.5
42.1
43.6
55.1
38.5 37.7
35.0
39.2 39.2 39.6
34.8
33.7 34.2
35.2 34.4
40.0 38.9
Source: ESS4 2008. Available at:
Figure 4. Distribution of answers to the question “In Your opinion, at what age does old age begin?”, 2018
Source: Demoscope Weekly. Available at:
age. It might be assumed that the age of “old age” largely corresponds to the legally fixed retirement age in the society’s understanding. In other words, not only demographic factors cause social changes, but it also might happen vice versa: the age of “incapacity” becomes a product of social construction in the public consciousness.
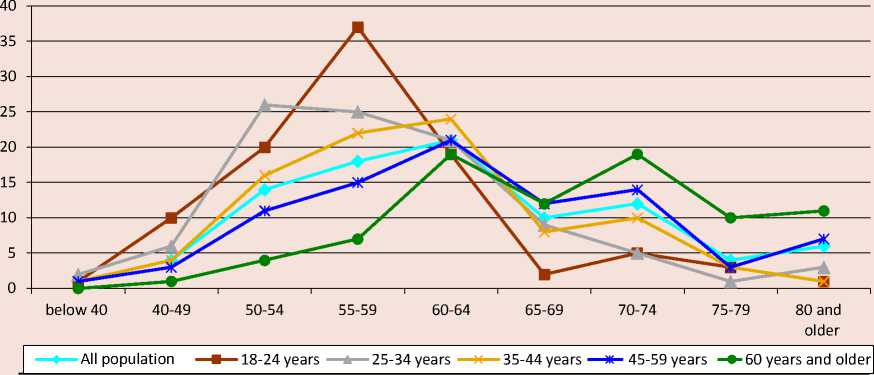
Interesting information was obtained by VCIOM, which conducted a similar version of the survey in Russia ( Fig. 4 ).
In this case, the important thing is not only what age Russians relate old age to, but also differences of old age perceptions in different age groups. Thus, based on these data, we may assume that, according to members of younger groups, the age of “old age” comes much earlier in comparison with the older generation’s point of view. Thus, we may assume that, with population ageing and increasing number of older people, the age of “old age” is constructed not only through awareness of the fact of growing life expectancy, but also through the change of the balance of representation of different socio-demographic groups in the population. This is indirectly confirmed by the earlier data: according to it, the level of tolerance toward older people is higher in countries where the largest presence of these groups in the overall structure is recorded [1].
It is obvious that demographic changes are the root cause of the population (Homo Sapiens population) and society ageing. However, in the current conditions of globality and irreversibility of population ageing, cause-and-effect connections are not so clear. Ageing society, adapting to new demographic parameters, “restructures” the concept of the age of “old age”, which is largely determined by social constructs (like the retirement age). The population and society ageing is an absolutely natural process which might only be accelerated or slowed down, but it could hardly be prevented. Coming back to methodological reflections concerning the relevance of approaches to determining the age of “old age”, we face the question: is there a place and need for this term in ageing society?
Conclusions
While the ancient society could be confidently called the “society without old people”, the current demographic situation is the opposite. Based on the available information, we assume that fundamental changes in the position of the older generation were influenced by revolutionary civilizational breakthroughs (fire, industrial revolution, etc.) and qualitative changes of the demographic system.
In particular, the rise of social states in developed countries occurred at the stage of the implementation of demographic dividends, when the share of dependent groups in the population reached a historical minimum: it allowed creating a foundation for the development of protectionist social security systems for older citizens. Thus, it becomes obvious that the construction of the age of “old age” in its original manifestation primarily had a demographic context with distinct economic factors.
In the context of global, irreversible (with maintaining a narrowed reproduction) population ageing and demographic betaconvergence (developing countries “age” significantly faster than developed countries) [51], the construction of the age of “old age” is gradually moving into the social area. Societies restructure the concept of old age through the prism of increasing life expectancy (including healthy life) and the awareness of the growing role of the older generation in maintaining sustainable rates of the socio-economic development.
Changes in public opinion about old people in different historical periods were determined by the perception of the demographic structure and current socio-economic conditions. In each of studied eras, the attitude toward older people had its own features: elderly people’s functions and social appearance changed too. The analysis shows that systemic gerontocide took place throughout the history of mankind up to the 19th century. It is obvious that main factors, which determined the existence of this phenomenon, were the elementary lack of resources and, according to the rest of society, the loss of useful skills by the older generation. The gradual transition from the contempt toward elderly people to the disappearance of the “old age” concept, at least in the sense of degradation, could be seen as a reaction of society to life expectancy changes. At the same time, the social construction of an old person’s image in the context of demographic ageing is carried out by evaluating the usefulness of skills of the older generation, just like in previous historical eras. The main difference is that the primary social function of an elderly person in the past was the “transmission” of life experience. Today, while the share of older people in most developed and developing countries is the only one increasing, this socio-demographic group is responsible for maintaining state’s sustainable socio-economic development. In this regard, the primary objective is to create favorable conditions for increasing the involvement of the older generation in socially useful activities. It might significantly simplify the transition to the new society. The effectiveness of the solution depends not only on elderly people themselves, but also on the state’s policy and the willingness of society to accept these inevitable changes.
References The evolution of demographic and social construction of the age of "old age"
- Barsukov V.N. Assessment of the prevalence of discriminatory attitudes toward older people in countries of the world. Vestnik Tomskogo gosudarstvennogo universiteta=Tomsk State University Journal, 2018, no. 4, pp. 82–90. (In Russian).
- Dobrokhleb V.G., Barsukov V.N. Demographic Theories and the Regional Aspect of Population Ageing. Ekonomicheskie i sotsial’nye peremeny: Fakty, tendentsii, prognoz=Economic and Social Changes: Facts, Trends, Forecast, 2017, no. 6, pp. 89–103. (In Russian).
- Vishevskii A.G. This is the key to another lock. Obshchestvennye nauki i sovremennost’=Social Sciences and Contemporary World, 2005, no. 2, pp. 150–155. (In Russian).
- Klupt M.A. The theory of demographic development: An institutional perspective. Obshchestvennye nauki i sovremennost’=Social Sciences and Contemporary World, no. 2, 2005, pp. 139–149. (In Russian).
- Rosset E. Protsess stareniya naseleniya. Moscow: Statistika, 1968. 508 p. (Transl. of: Rosset E. Proces starzenia się ludności. Warszawa: Polskie Wydawnictwo Gospodarcze, 1959).
- Thompson W.S. Population. American Journal of Sociology, 1929, no. 34 (6), pp. 959–975.
- The ageing of populations and its economic and social implications. United Nations: New York, 1965. 128 p.
- Sauvy А. Obshchaya teoriya naseleniya. T. 2: Zhizn’ naseleniya. Moscow: Progress, 1977. 520 p. (Transl. of: Sauvy А. Théorie générale de la population: La vie des populations. Vol. 2. Presses universitaires de France, 1966).
- Bukher S. Current trends of the ageing of Russian population. Vestnik Rossiiskoi Akademii Nauk=Herald of the Russian Academy of Sciences, 2016, no. 3, pp. 215–223. (In Russian).
- Meltem I. Economic and Social Consequences of Population Aging the Dilemmas and Opportunities in the Twenty-First Century. Applied Research in Quality of Life, 2015, vol. 10, pp. 735–752.
- Dlugosz Z. The level and dynamics of population ageing process on the example of demographic situation in Europe. Bulletin of Geography (Socio-Economic series), 2003, no. 2, pp. 5–15.
- Golini A. Demographic trends and aging in Europe. Prospects, problems and policies. Genus, 1997, vol. 53, pp. 33–74.
- Ryder N. B. Notes on Stationary Populations. Population Index, 2017, vol. 41(1), pp. 3–28.
- Sanderson W., Scherbov S. Average remaining lifetimes can increase as human populations age. Nature, 2005, vol. 435(7043), pp. 811–813.
- Sanderson W., Scherbov S. Remeasuring Ageing. Science, 2010, vol. 329, pp. 1287–1288.
- Sanderson W., Scherbov S. The Characteristics Approach to the Measurement of Population Aging. Population and Development Review, 2013, vol. 39, pp. 673–685.
- Lutz W., Sanderson W., Scherbov S. The coming acceleration of global population ageing. Nature, 2008, vol. 451(7179), pp. 716–719.
- Vasin S.A. Traditional and prospective age, or the dual role of high mortality. Demoscope Weekly, 2008, no. 357–358. Available at: http://www.demoscope.ru/weekly/2008/0357/tema03.php (In Russian).
- Rosset E. Prodolzhitel’nost’ chelovecheskoi zhizni. Moscow: Progress, 1981, 384 p. (Transl. of: Rosset E. Trwanie życia ludzkiego. Wrocław: Zakład Narodowy im. Ossolińskich – Wydaw. Polskiej Akademii Nauk, 1977. 368 p.).
- Vallois Н. Vital Statistics in Prehistorical Population as Determined from Archeological Data. The Application of Quantitative Methods in Archeology. Chicago, 1960. 358 p.
- Urlanis B. Ts. Evolyutsiya prodolzhitel’nosti zhizni. Moscow: Statistika, 1978. 310 p.
- Acsádi J. History of human life span and mortality. Budapest: Akadémiai Kiadó, 1970. 346 p.
- Krzywicki L. Primitive Society and its Vital Statistics. London: Macmillan and Co, 1934. 589 p.
- Morgan L.H. Drevnee obshchestvo ili issledovanie linii chelovecheskogo progressa ot dikosti cherez varvarstvo k tsivilizatsii. Leningrad: Izdatel’stvo instituta narodov Severa TCIK SSSR, 1935. 386 p. (Transl. of: Morgan L.H. Ancient Society; Or Researches in the Lines of Human Progress from Savagery, Through Barbarism to Civilization. New York: Henry Holt and Company, 1877).
- Angel J. The Length of Life in Ancient Greece. Journal of Gerontology, 1947, vol. 2, pp. 18–24.
- Pearson C. On the Change in Expectation of Life in Man During a Period of circa 2000 years. Biometrika, 1901, vol. 1, pp. 261–264.
- Macdonel W. On the Expectation of Life Ancient Rome and Provinces of Hispania and Lusitania, and Afrika. Biometrika, 1913, vol. 19, pp. 366–380.
- Dublin L., Lotka A., Spiegelman M. Length of Life: A Study of the Life Table. New York: Ronald Press Co, 1949. 349 p.
- Strabo. Geographia. Leningrad: Nauka, 1964. 944 p. (Transl. of: Strabo. Geography. Cambridge, MA: Harvard University Press, 1917).
- Melikova K.A. Gerontocracy as a phenomenon of ancient culture. In the world of science and art: Issues of philology, art history, and cultural studies, 2014, no. 37, pp. 24–31. (In Russian).
- Cicero M.T. O starosti. O druzhbe. Ob obyazannostyakh. Moskva: Nauka, 1993. 248 p. (Transl. of Cicero M.T. On Old Age. On Friendship. On Divination. Cambridge, MA: Harvard University Press, 1923).
- Seneka L.A. Nravstvennye pis’ma k Lutsiliyu. Moscow: Nauka, 1977. 386 p. (Transl. of: Seneca L. A. Moral Letters to Lucilius. Harvard University Press, 1917).
- Kulisher M.I. Ocherki sravnitel’noi etnografii i kul’tury. S.-Peterburg: Tip. I.N. Skorokhodova, 1887. 308 p.
- Russel J. British Medieval Population. Albuquerque: Univ. of New Mexico Press, 1948. 389 p.
- Valaoras V. Standard Age and Sex Patterns of Mortality. Trends and Differentials in Mortality, 1956, pp. 133–149.
- Aries Ph. Rebenok i semeinaya zhizn’ pri Starom poryadke. Ekaterinburg: Izd-vo Ural. un-ta, 1999. 416 p. (Transl. of: Aries Ph. L’enfant et la vie familiale sous l’Ancien Régime. Maisons-Laffitte, 1973, 316 p.).
- Kotlyarevskii A.A. Drevnosti prava baltiiskikh slavyan: opyt sravnitel’nogo izucheniya slavyanskogo prava. Prague: tip. V. Nagelya, 1874. 178 p.
- Westengaard, H. Contributions to the History of Statistics. New York: A. M. Kelley, 1978. 280 p.
- Pearl R. Introduction to Medical Biometry and Statistics. London: W. B. Saunders company, 1923. 398 p.
- Novosel’skii S.A. Smertnost’ i prodolzhitel’nost’ zhizni v Rossii. Petrograd: Tip. Ministerstva vnutrennikh del, 1916. 208 p.
- Hart H. Expectation of Life as an Index of Social Progress. American Sociological Review, 1944, vol. 9, pp. 609–621.
- Berger P. L., Luckmann T. Sotsial’noe konstruirovanie real’nosti. Traktat po sotsiologii znaniya. Moscow: Medium, 1995. 323 p. (Transl. of: Berger P. L., Luckmann T. The Social Construction of Reality. A Treatise on sociology of Knowledge. 1966).
- Bukharov D.N. Poezdka po Laplandii osen’yu 1883 goda. SPb.: Tip. Imp. Akad. nauk, 1885. 345 p.
- Litvinova P. How old people were put on the lubok in the old days. Kievskaya starina, 1885, vol. 12, pp. 354–356.
- Vishnevskii A.G. Unnoticed contribution to the theory of demographic transition. Demograficheskoe obozrenie=Demographic Review, 2015, no. 4. Available at: https://demreview.hse.ru/data/2016/04/12/1126752684/DemRev_2_4_2015_6-34.pdf (In Russian).
- Landry A. La Révolution Démographique. INED, 1982. 230 p.
- Zelikova Yu.A. Stareyushchaya Evropa: demografiya, politika, sotsiologiya. SPb.: Norma, 2014. 224 p.
- Lee R., Mason А. Population ageing, wealth, and economic growth: Demographic dividends and public policy. WESS background paper, 2015, 35 p.
- Butler R. Ageism: Another form of bigotry. The Gerontologist, 1969, no. 9, pp. 243–246.
- Barsukov V.N. Causes and consequences of intergenerational conflict as a social issue of “ageing” countries. Sotsial’noe prostranstvo=Social Area, 2016, no. 5. Available at: http://sa.vscc.ac.ru/article/2069 (In Russian).
- Barsukov V.N. From the Demographic Dividend to Population Ageing: World Trends in the System-Wide Transition. Ekonomicheskie i sotsial’nye peremeny: Fakty, tendentsii, prognoz=Economic and Social Changes: Facts, Trends, Forecast, 2019, vol. 12, no. 4, pp. 167–182. (In Russian).
